
A Market That Isn’t Breaking. It’s Aging.

Two days ago I wrote the closing note and meant it. I’m not signing up for daily commentary again, and I’m not interested in filling space.
But when the market shifts character, it’s worth documenting.
Not because I need a take, but because this is exactly where most traders slowly leak money. Not from being wrong… no… but from forcing action when the market is quietly telling you the terms have changed.
This is one of those moments.
After an aggressive bull run that really got going around the week of Thanksgiving, ES did what strong markets tend to do. It kept pushing. Pullbacks stayed shallow. Price kept accepting higher. By last week, we were trading in ATH territory.
A 400pt rally in seven sessions (11/21–11/28) is epic.
But it wasn’t emotional.
It was steady, accepted, and efficient.
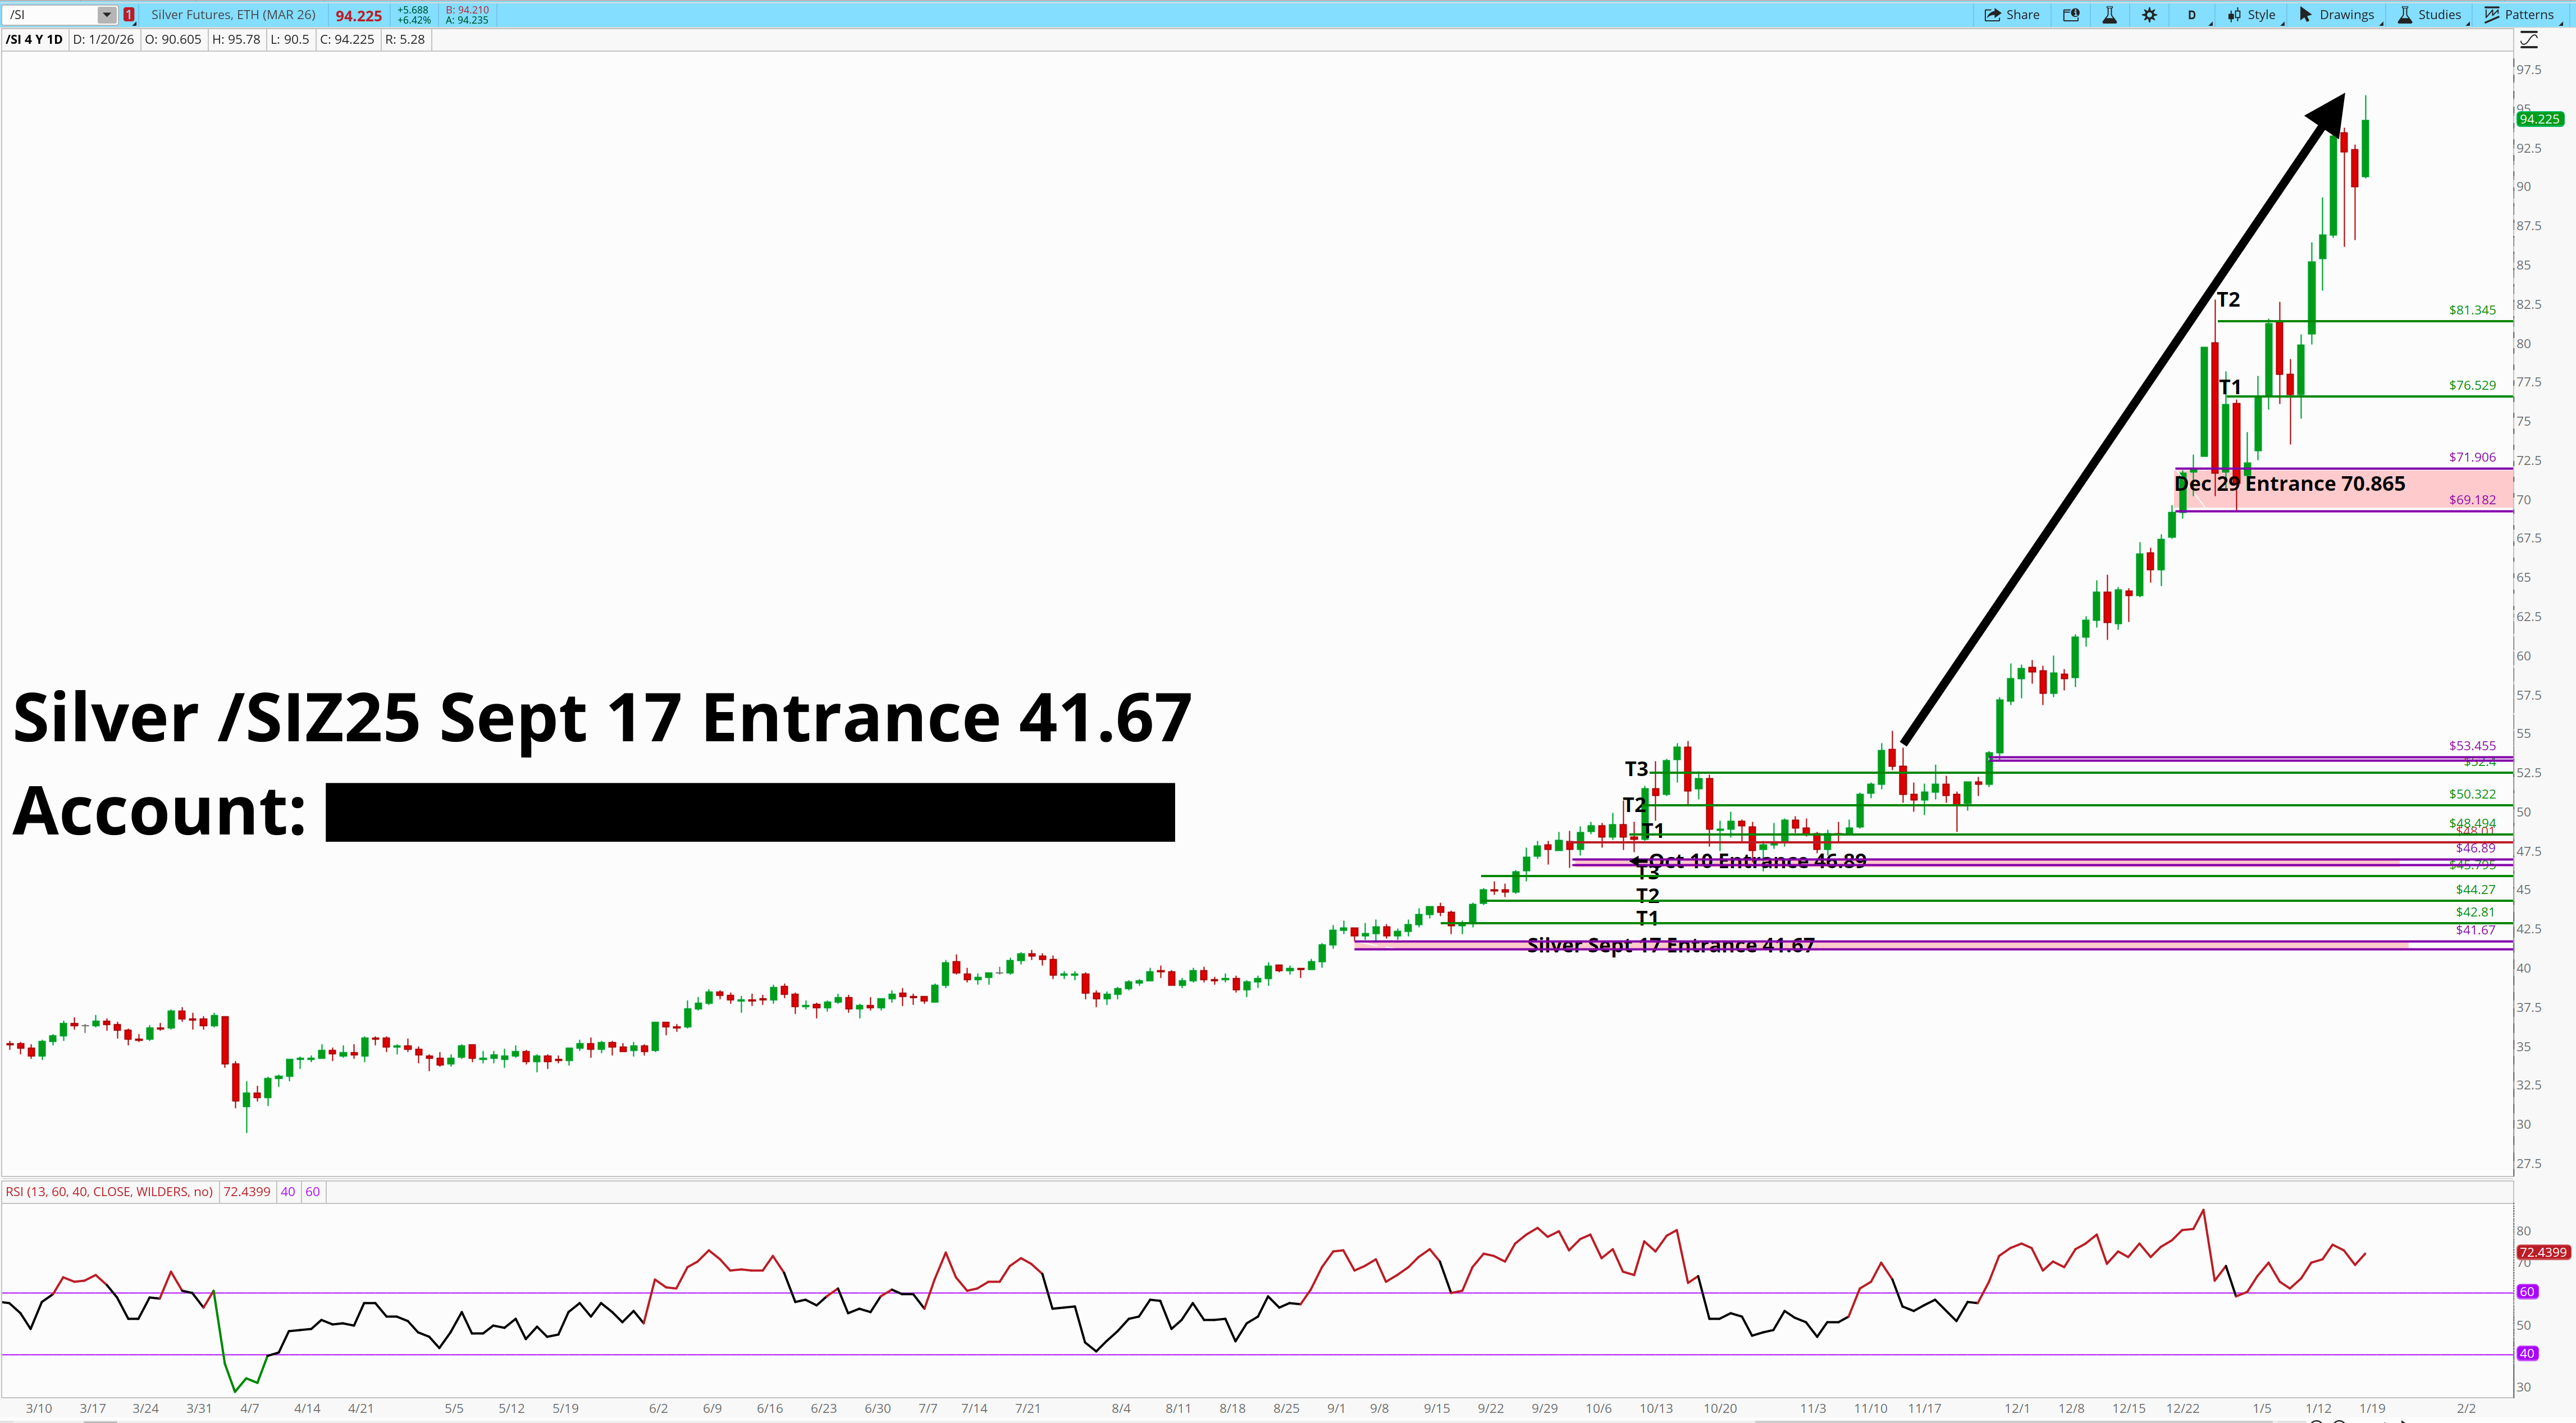
(It didn’t look anything like the kind of vertical blow-off you see in something like Silver right now.)
Nope…
Since then, the character has changed.
Not because the market suddenly found a reason to sell, but because once price reached new highs, it stopped getting paid for urgency.
Rates never really backed off.
Cut expectations got less clean.
The headline tape got louder again.
And instead of breaking, price just started working.
That’s what ES is doing now.
This daily chart is about six months of memory. Late July to late January. That’s a full cycle of impulses and corrections, not a two-week mood swing.
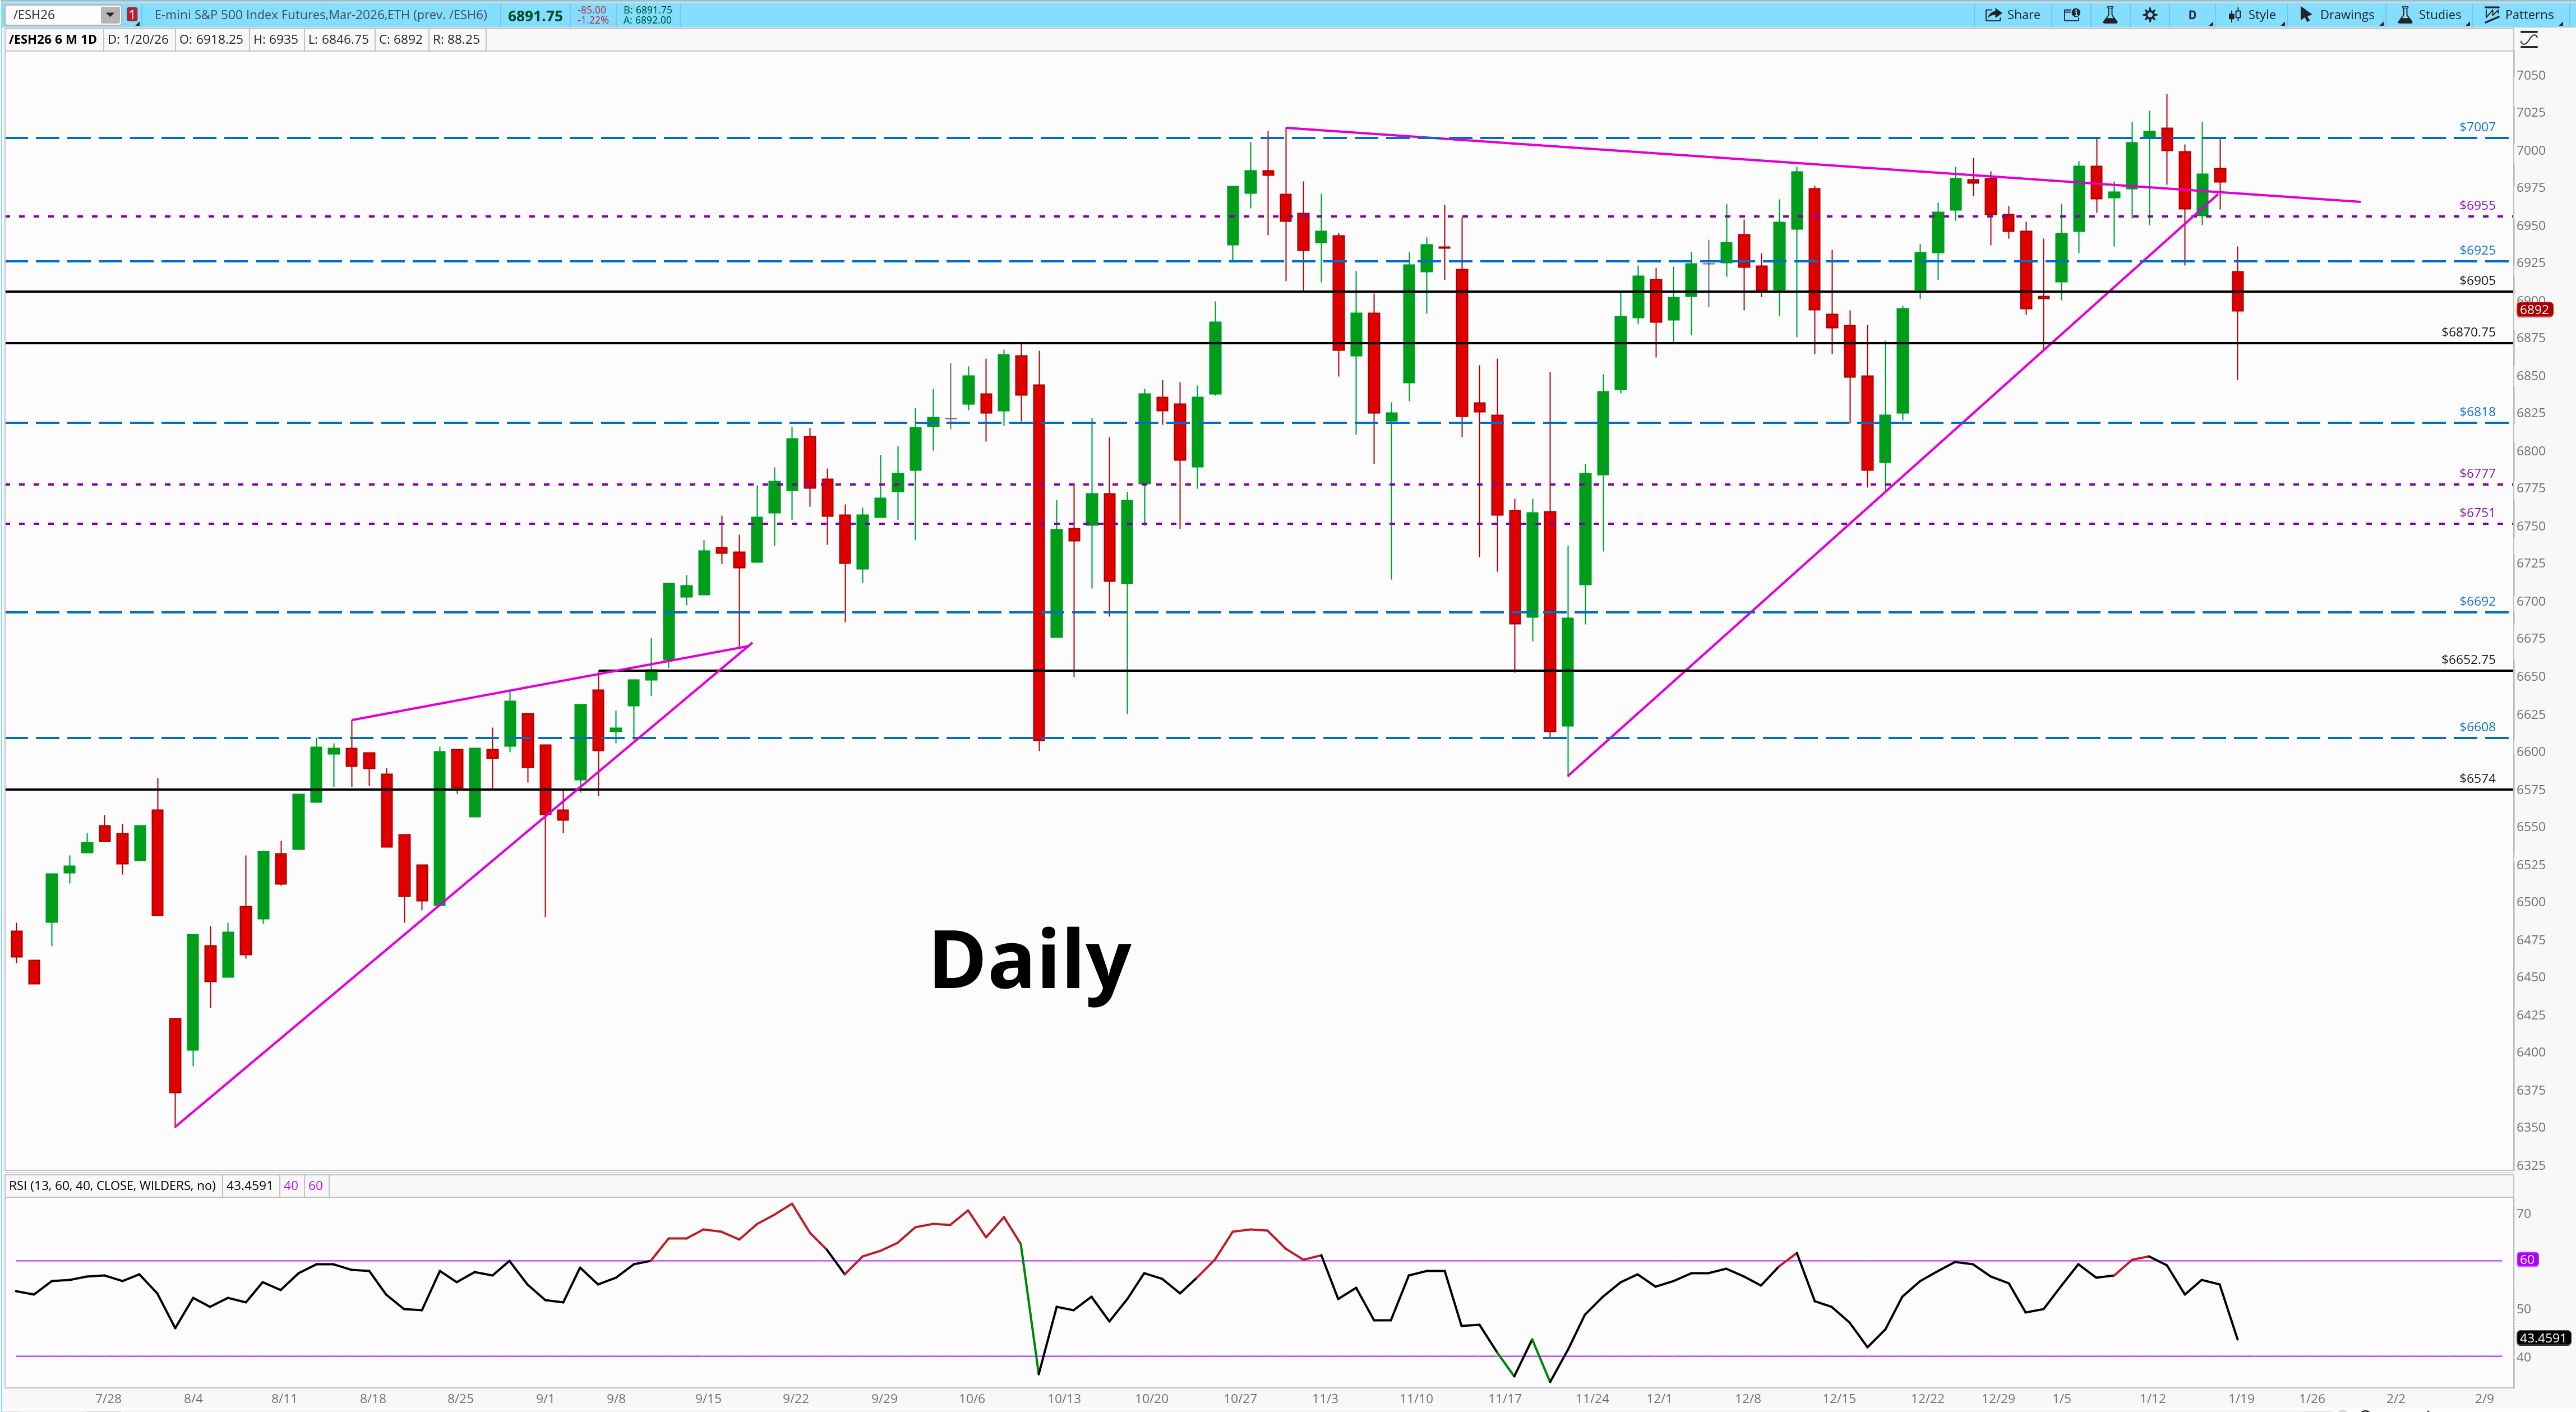
Price points that define the structure
Let’s start with the top, because that’s where the change began.
7007 is the obvious one.
That’s the upper ceiling, and price has already proven it can trade there. The important part is what happened next. Instead of expanding away from 7007, ES started chopping around the upper band, then failed to hold the upper channel.
That’s not a crash signal.
It’s a follow-through signal that didn’t show up.
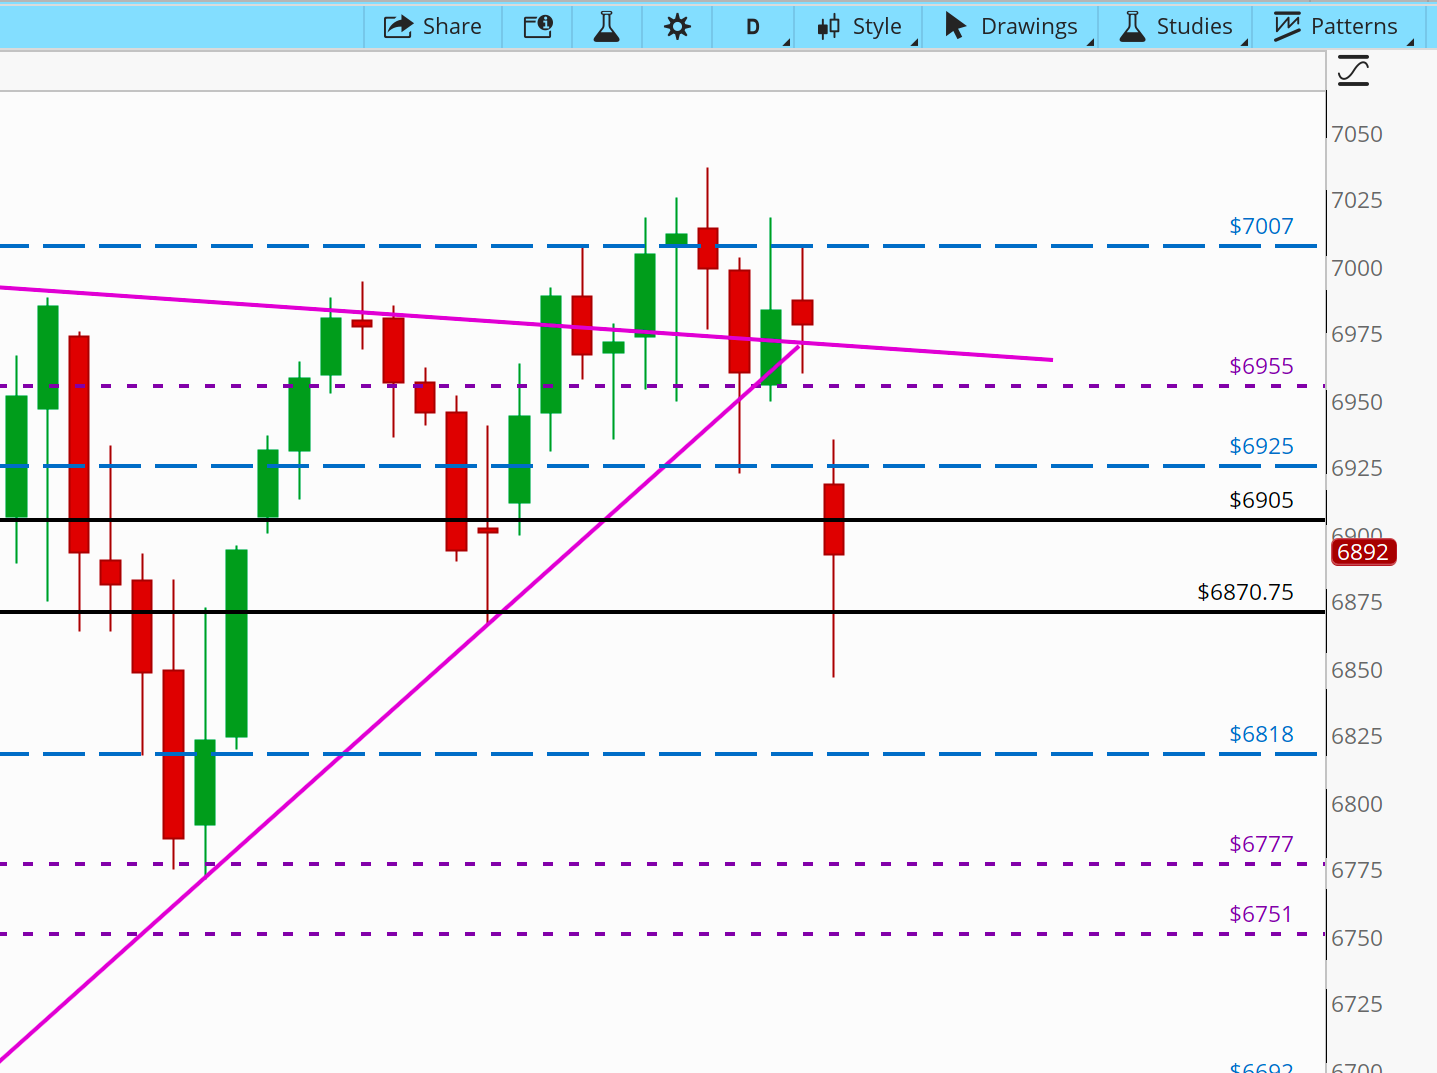
Below that, the market has been living inside a tight stack of decision levels.
6955 is the mini-dash tell.
The market worked around it, but didn’t build clean acceptance above it. It behaved like a level that gets tagged and rotated from, not one that gets reclaimed and left behind.
6925 is a bigger deal.
It’s a major blue dashed shelf, and it’s been a repeat pivot. When the market is healthy, it doesn’t keep coming back to 6925. It uses it and goes. When the market is maturing, it keeps revisiting it, and every revisit turns into work.
Now look at where we are.
6905 is the solid black line sitting right under that shelf.
That’s a regime line on your chart. When price is above it, the market can still act like an uptrend that’s just pausing. When price is below it, the market starts behaving like balance that can rotate deeper.
This morning, we’re trading around 6892, sitting under that 6905 line after printing down to 6846.75.
That is the first real “terms changed” datapoint on this chart.
Below 6905, the next shelves are clean and already mapped.
6818 is the next blue dashed level that matters.
It’s the first place you’d expect the auction to try to stabilize if this rotation continues.
Then you have the midrange mini-dash cluster, 6777 and 6751.
Those are not regime breakers. They’re the areas that tell you whether downside is being accepted or just explored.
And then you get to the deeper structure.
6692 is the next major blue dashed shelf, and it sits above the big black-line base in the mid-6600s.
If ES is rotating inside a larger, six-month uptrend, 6692 is exactly where you’d expect the market to try to find its footing.
Below that, your major black-line references are 6652.75 and 6574.
Those are the lines that change the bigger story if they ever stop holding.
Right now we are not there.
We are still in the upper half of the six-month structure. But we are no longer acting like a clean continuation.
Impulses vs corrections, what changed
Go back to the rally phase and the structure is clear.
The November low launched a sharp impulse that carried straight into early December. That move paused around 12/11, delivered a correction that respected structure, and then price pushed again into early January, eventually tagging the upper band near 7007.
That’s the anatomy of a trend. But what changed wasn’t direction…
It was the shape of the moves.
Since the 12/11 high, impulses have become sharper in both directions. Up moves no longer expand cleanly. Down moves come faster, but don’t fracture structure. Instead of drifting into shelves, price snaps into them.
Instead of continuing, medium S/R….it works.
Today is a good example.
A session that opens near 6918, trades up to 6935, dumps to 6846, and then sits back around 6892 is not trend efficiency.
That’s two-sided trade, a large gap down after a 3 day weekend, pushing to a new low, and flirting with 40 on the daily RSI.
That’s inventory being moved around.
That’s what aging looks like.
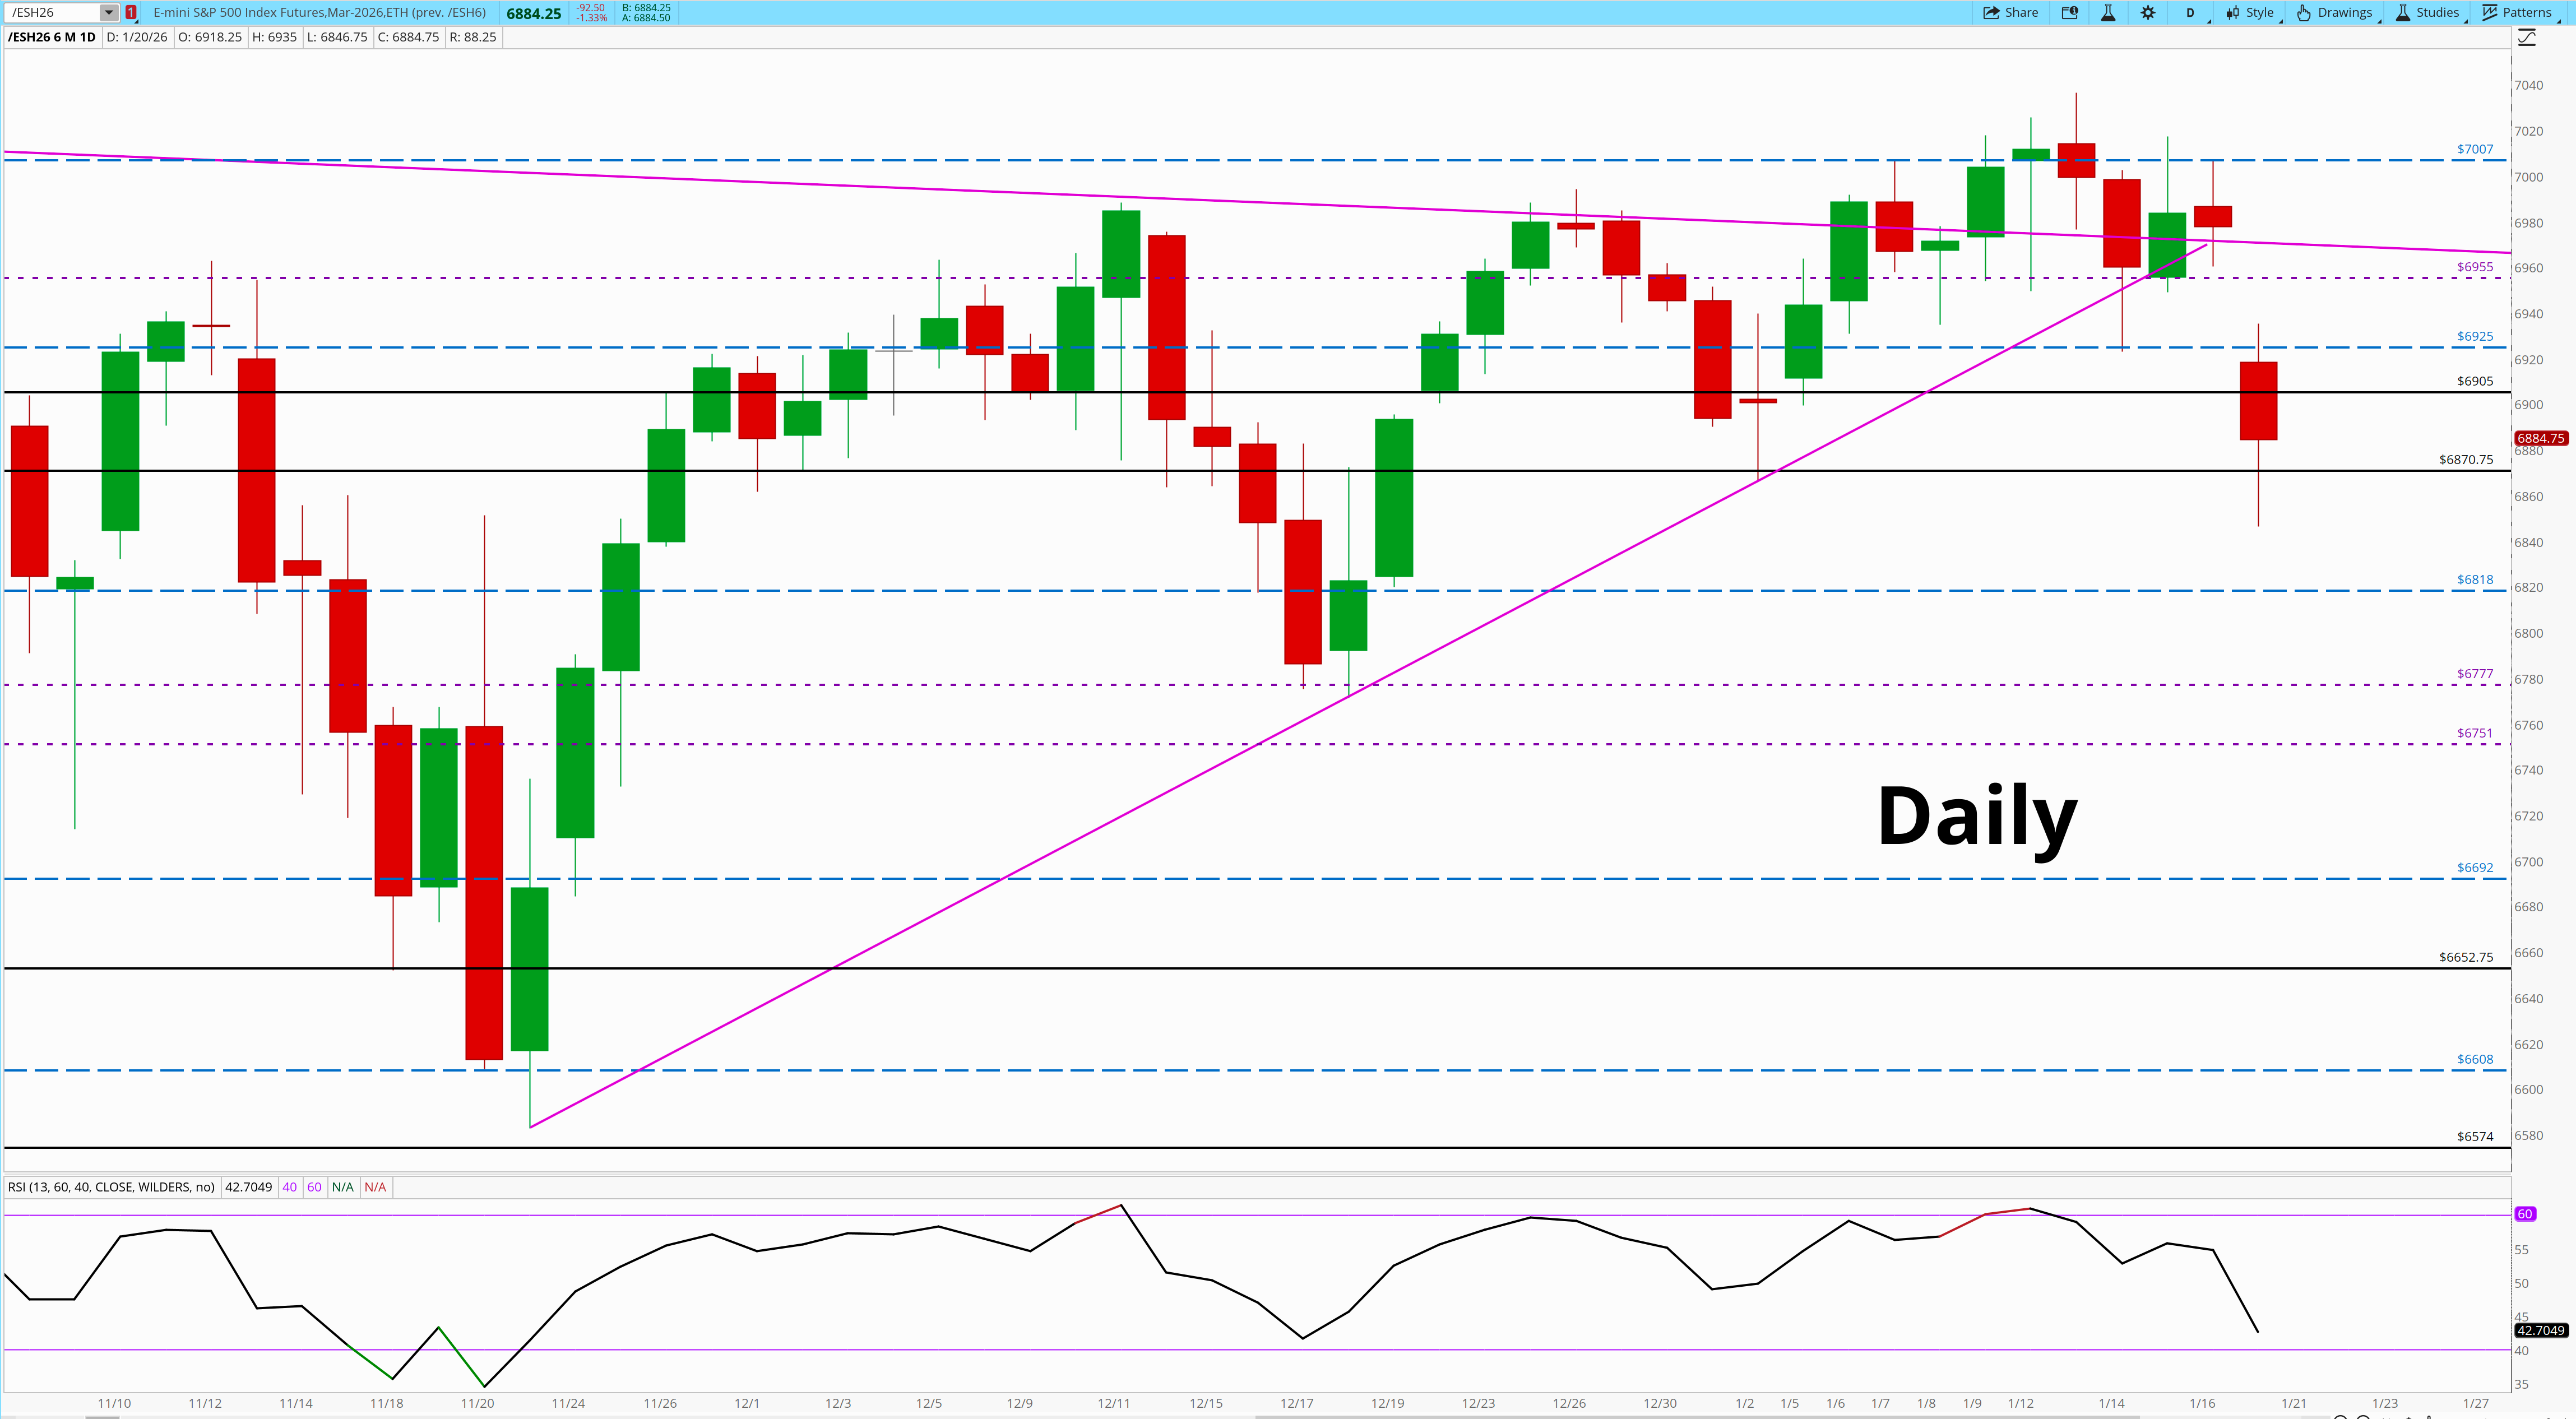
Daily RSI and why it matters now
Now look at RSI across that same window.
RSI is sitting around 43.5.
Earlier in the rally, that would’ve been unthinkable.
During the impulse legs, RSI lived comfortably above 53. Pullbacks reset shallowly and momentum stayed supportive. That’s how strong trends behave.
That regime is gone.
Since the 12/11 high, daily RSI has breached 60 only once, on the January 9-13 all-time high breakout… but more imptly, it failed, almost immediately.
That matters.
When price makes new highs but momentum can’t sustain a bullish regime, the market is telling you expansion is no longer the default.
RSI has spent more time in the middle, and now it’s pressing into the lower half of the range.
It’s not collapsing.
It’s not signaling a bear market.
But it is confirming what price has already shown.
Momentum has cooled.
Follow-through is less reliable.
Higher lows are still intact.
Structure has not broken.
But the combination of momentum divergence, failure for daily RSI to hold above 60, and impulses getting shallower and shorter paints a very specific picture.
This is no longer a trend-first environment.
It’s a range-bound, shakeout-heavy market.
That means more failed breakouts.
More sharp probes into levels.
More frustration for anyone trading momentum instead of location.
If RSI can’t recover back through the midrange while price is trying to reclaim 6905–6925, upside attempts are far more likely to be worked and sold than extended.
If RSI breaks and holds below 40, that’s when the market tells you this rotation is no longer just a reset. Price will reset lower.
Right now, RSI is sitting squarely in the fatigue zone.
Not trend supportive.
And that matches the tape.
As it sits, the 6870 FBD from yesterday did what it was supposed to do. Price flushed, reclaimed, and rotated higher. That part worked.
But it’s now run straight into 6905, the first real resistance that matters on this chart, and momentum hasn’t followed. The push higher has been labored, overlapping, and slow.
That’s not how strong follow-through looks 3 hrs post reclaim.
Below us, the demand zone is still there. It’s real.
But it’s also already been tested…. first around 6860, then again near 6868. Each test weakens it.
Demand doesn’t get stronger by being used repeatedly.
So structurally, this is where things get honest.
If this were a high-quality FBD with trend behind it, price wouldn’t be spending time struggling at the first resistance.
It would be separating.
Instead, it’s stalling.
That suggests failure.
But we don’t trade suggestions.
We don’t predict.
We wait.
If price can’t hold above 6905 and starts losing acceptance back below 6870, then this stops being an FBD and starts becoming a breakdown through a weakened demand zone. At that point, the chart stops asking “will it bounce” and starts asking “where does structure give way next.”
Until that happens, nothing is confirmed.
This is exactly how these transitions play out.
Good looking setups work just enough to draw participation, then stall where momentum should have shown up. That’s not an opinion. That’s what the chart is doing.
So the play here isn’t anticipation.
It’s patience.
The chart will tell us.
And until it does, doing less is the right trade.
Keep on eye on that