
April 30 – Compounding Longs into the Elusive 7. Structure Still Leads – ESDaily Gameplan
As ES tries to make it 7 Green Days in a row, we're still holding from 5405, 5529, and 5565. Does the structure hold?

Wednesday April 30, 2025
Six green closes in a row.
Statistically, we’re in rare territory — Streaks this long happen in less than 1% of all ES sessions.
Four- and five-day rallies are relatively common in a bull cycle, but once you push into the sixth day, things thin out fast.
I stitched together this chart using Yahoo Finance to show you just how rare these are:
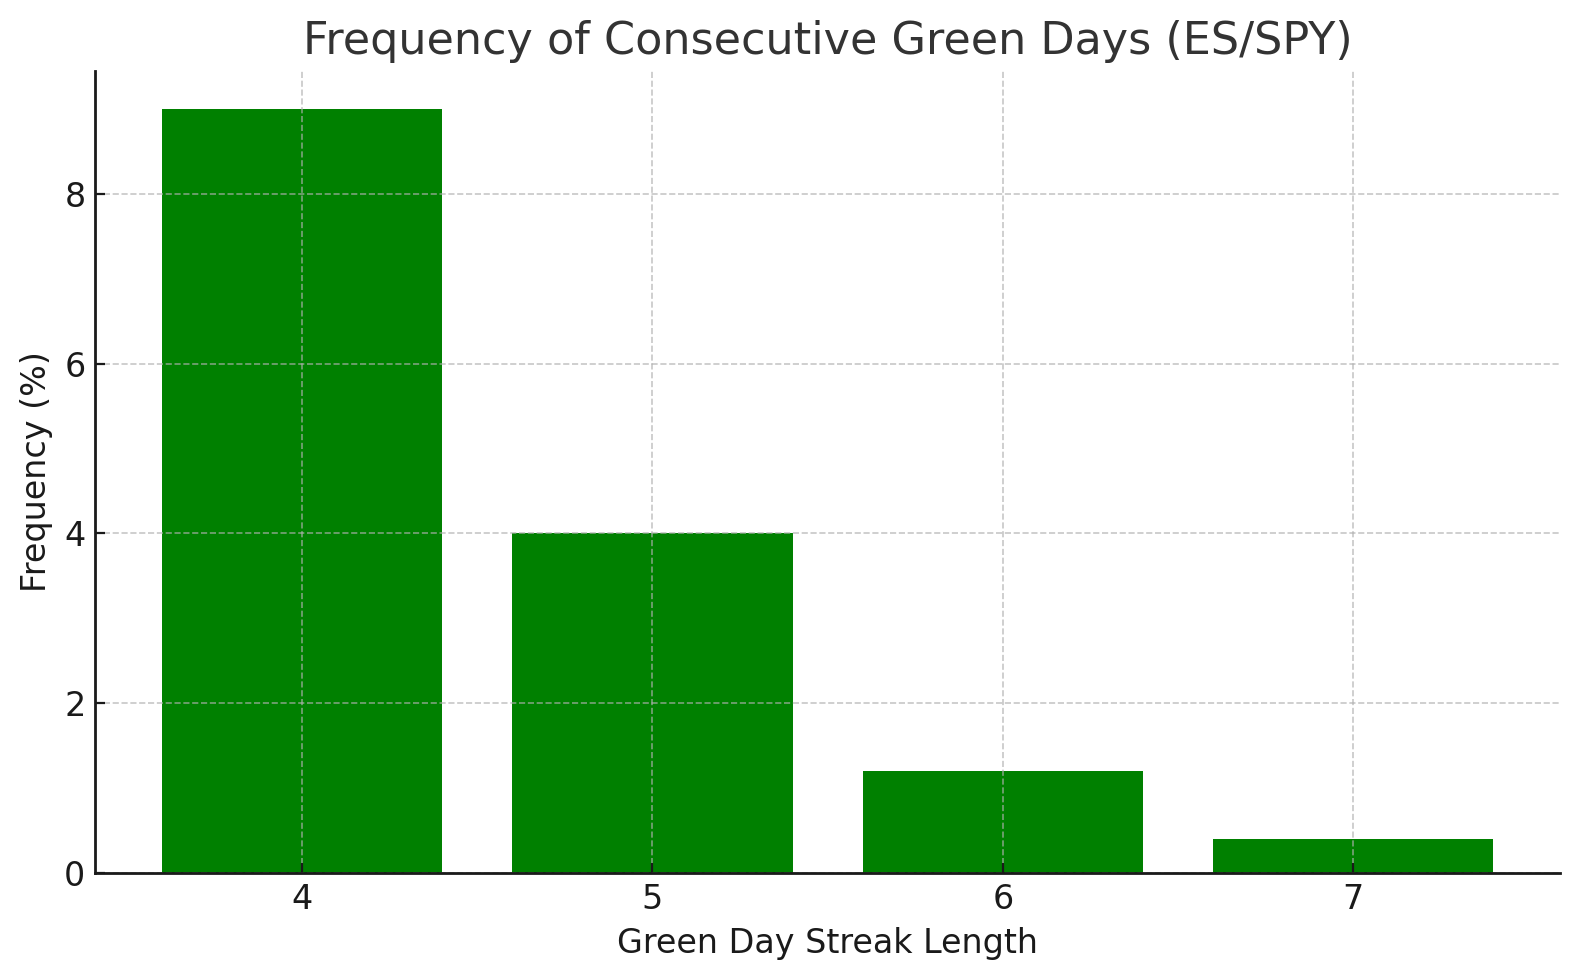
Seven-day streaks? Almost unheard of.
And when they do show up, they’re usually followed by sharp pauses, failed breakouts, or resets.
That’s why we’re not pressing here.
We’re positioned, not chasing.
Still holding from 5405. Still holding from 5529. Still holding from 5565.
Letting the market prove it wants a seventh — not assuming it will.
But this hasn’t been a clean glide higher.
It’s been a rally built on failed rejection — a recurring series of failed breakdowns, reclaimed structure, and grinding breakups - squeezing through stacked supply shelves.
And I’ve been holding through it from two of the cleanest inflection points, and a breakout retest on the chart:
April 28: Long from 5405 — a reclaim after price flushed below demand and reversed with strength.
April 29: Long from 5529 — a failed breakdown that reclaimed the level and built structure into the close.
April 29: Long from 5568 - A LBT that occurred after the breakout of 5575 to 5597
Each of these entries wasn’t just a breakout or a bet — they were responses to structure confirming strength.
Since the 5127 low, there have been six distinct breakdown attempts.
Each one has found buyers.
Each one has printed a higher low.
Each one has reminded us: ES doesn’t move in straight lines — it moves in traps, tests, and reclaim.
That’s not a parabolic move.
That’s a tape with order.
Last week, shorts stopped us out or barely hit T1/T2. There were no runners.
This week? We’re compounding strength — not predicting, not forcing.
“Don’t fight the tape.”
— Marty Zweig
He coined it. The market’s been proving it.
Even sentiment confirms it:
Below you’ll see the sentiment reading from SentimenTrader. SentimenTrader is a service provided that will give you all sorts of data across all sorts of markets. 100’s of charts if you’re into stats.
But, this one is my favorite and it speaks volumes about who is buying, when. We can’t trade off of it, but it can give us a broader view as to what’s happening in the market.
If you're wondering who’s still buying up here, the sentiment split is telling.
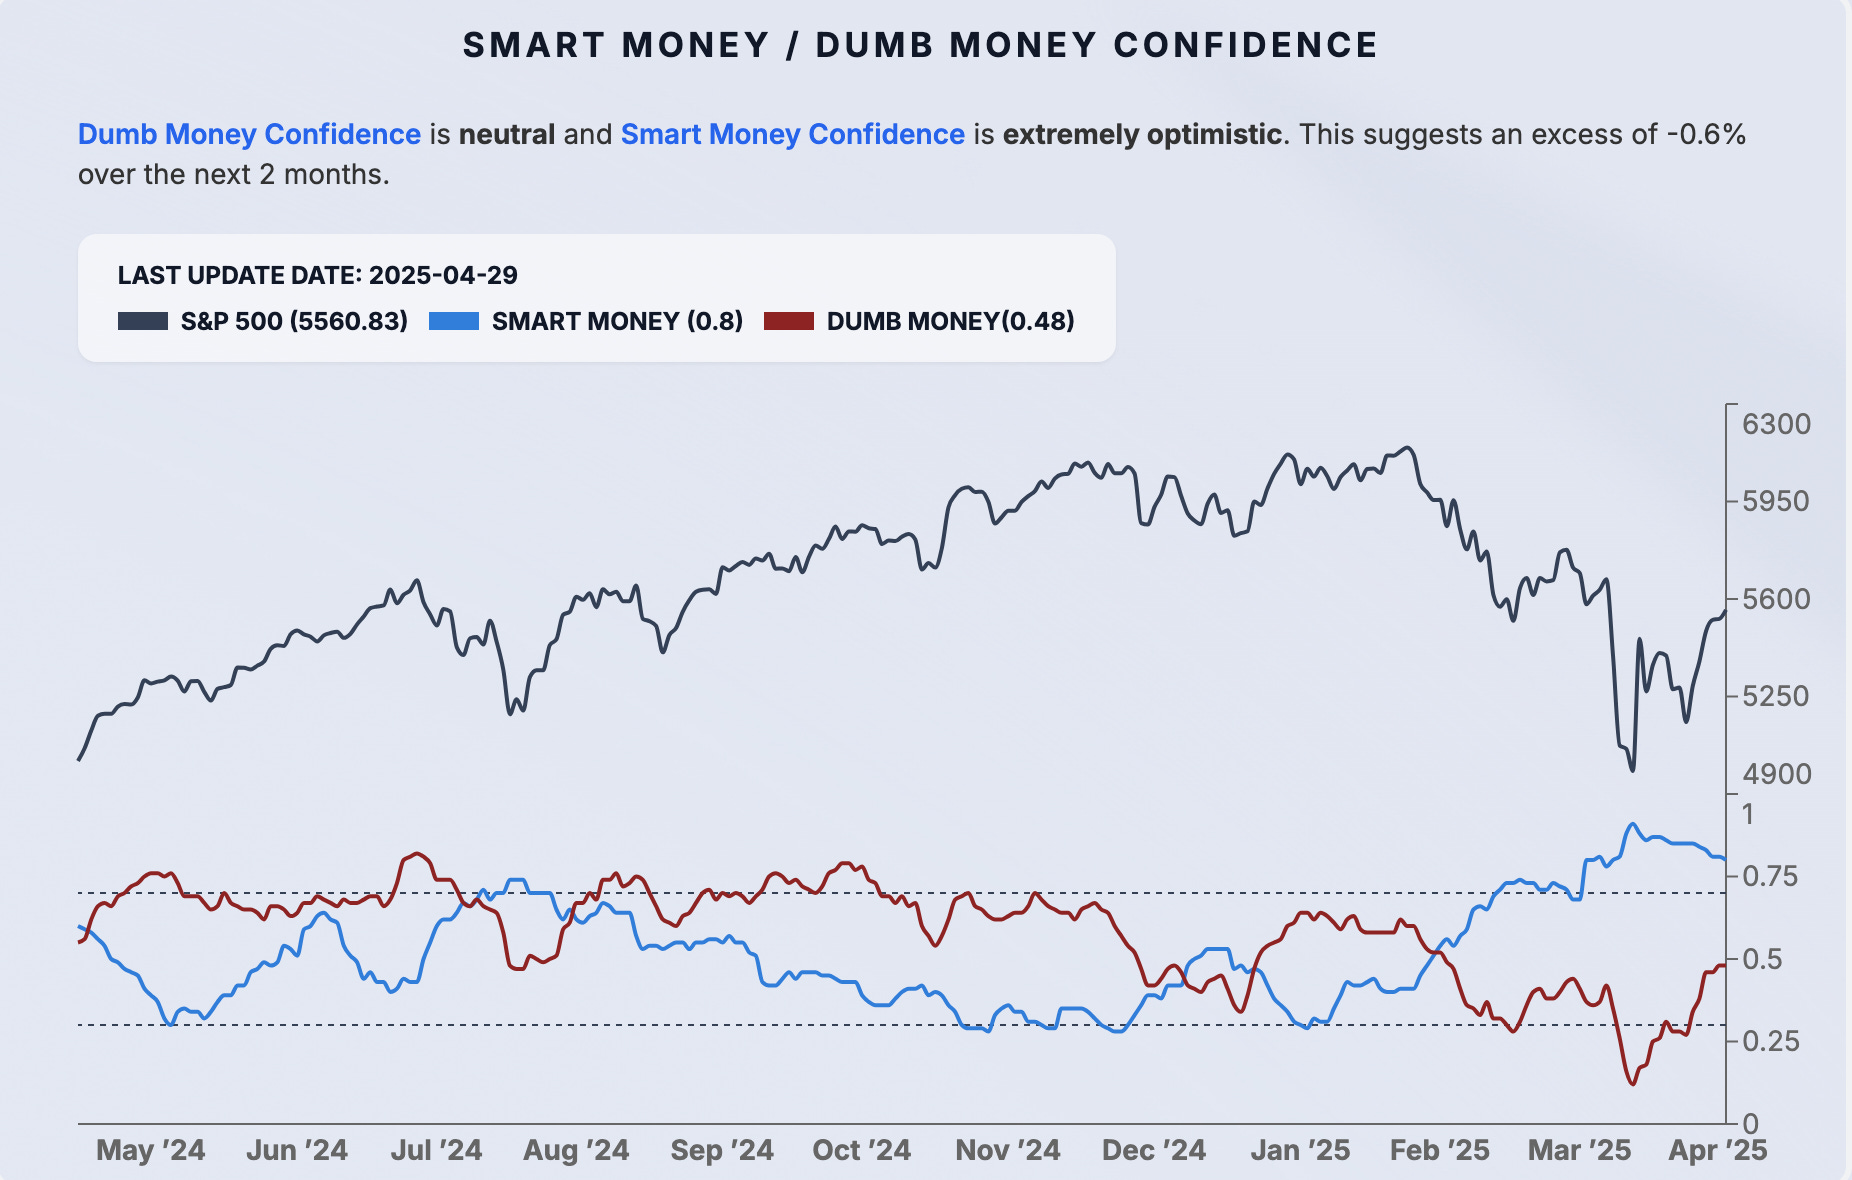
As of April 29, Smart Money Confidence is extremely optimistic (0.80), while Dumb Money is only neutral (0.48).
That’s not what you’d expect after a six-day run — and it’s what makes this rally more structurally interesting than frothy.
Historically, when markets are rising smart money leads sentiment while dumb money lags.
It's often a sign of orderly strength buying, not a euphoric blow-off. That doesn’t mean we chase — but it does mean we don’t fade simply because it’s gone far.
If this rally were overextended or driven by emotion, you'd expect Dumb Money to be peaking. It's not. That divergence supports holding runners and stalking pullbacks — just like we’ve done this week.
This in additional to seeing daily RSI readings below, leads me to believe even though we’re going for 7 Days, there’s not a lot of technicals suggesting we pull the rug on this.
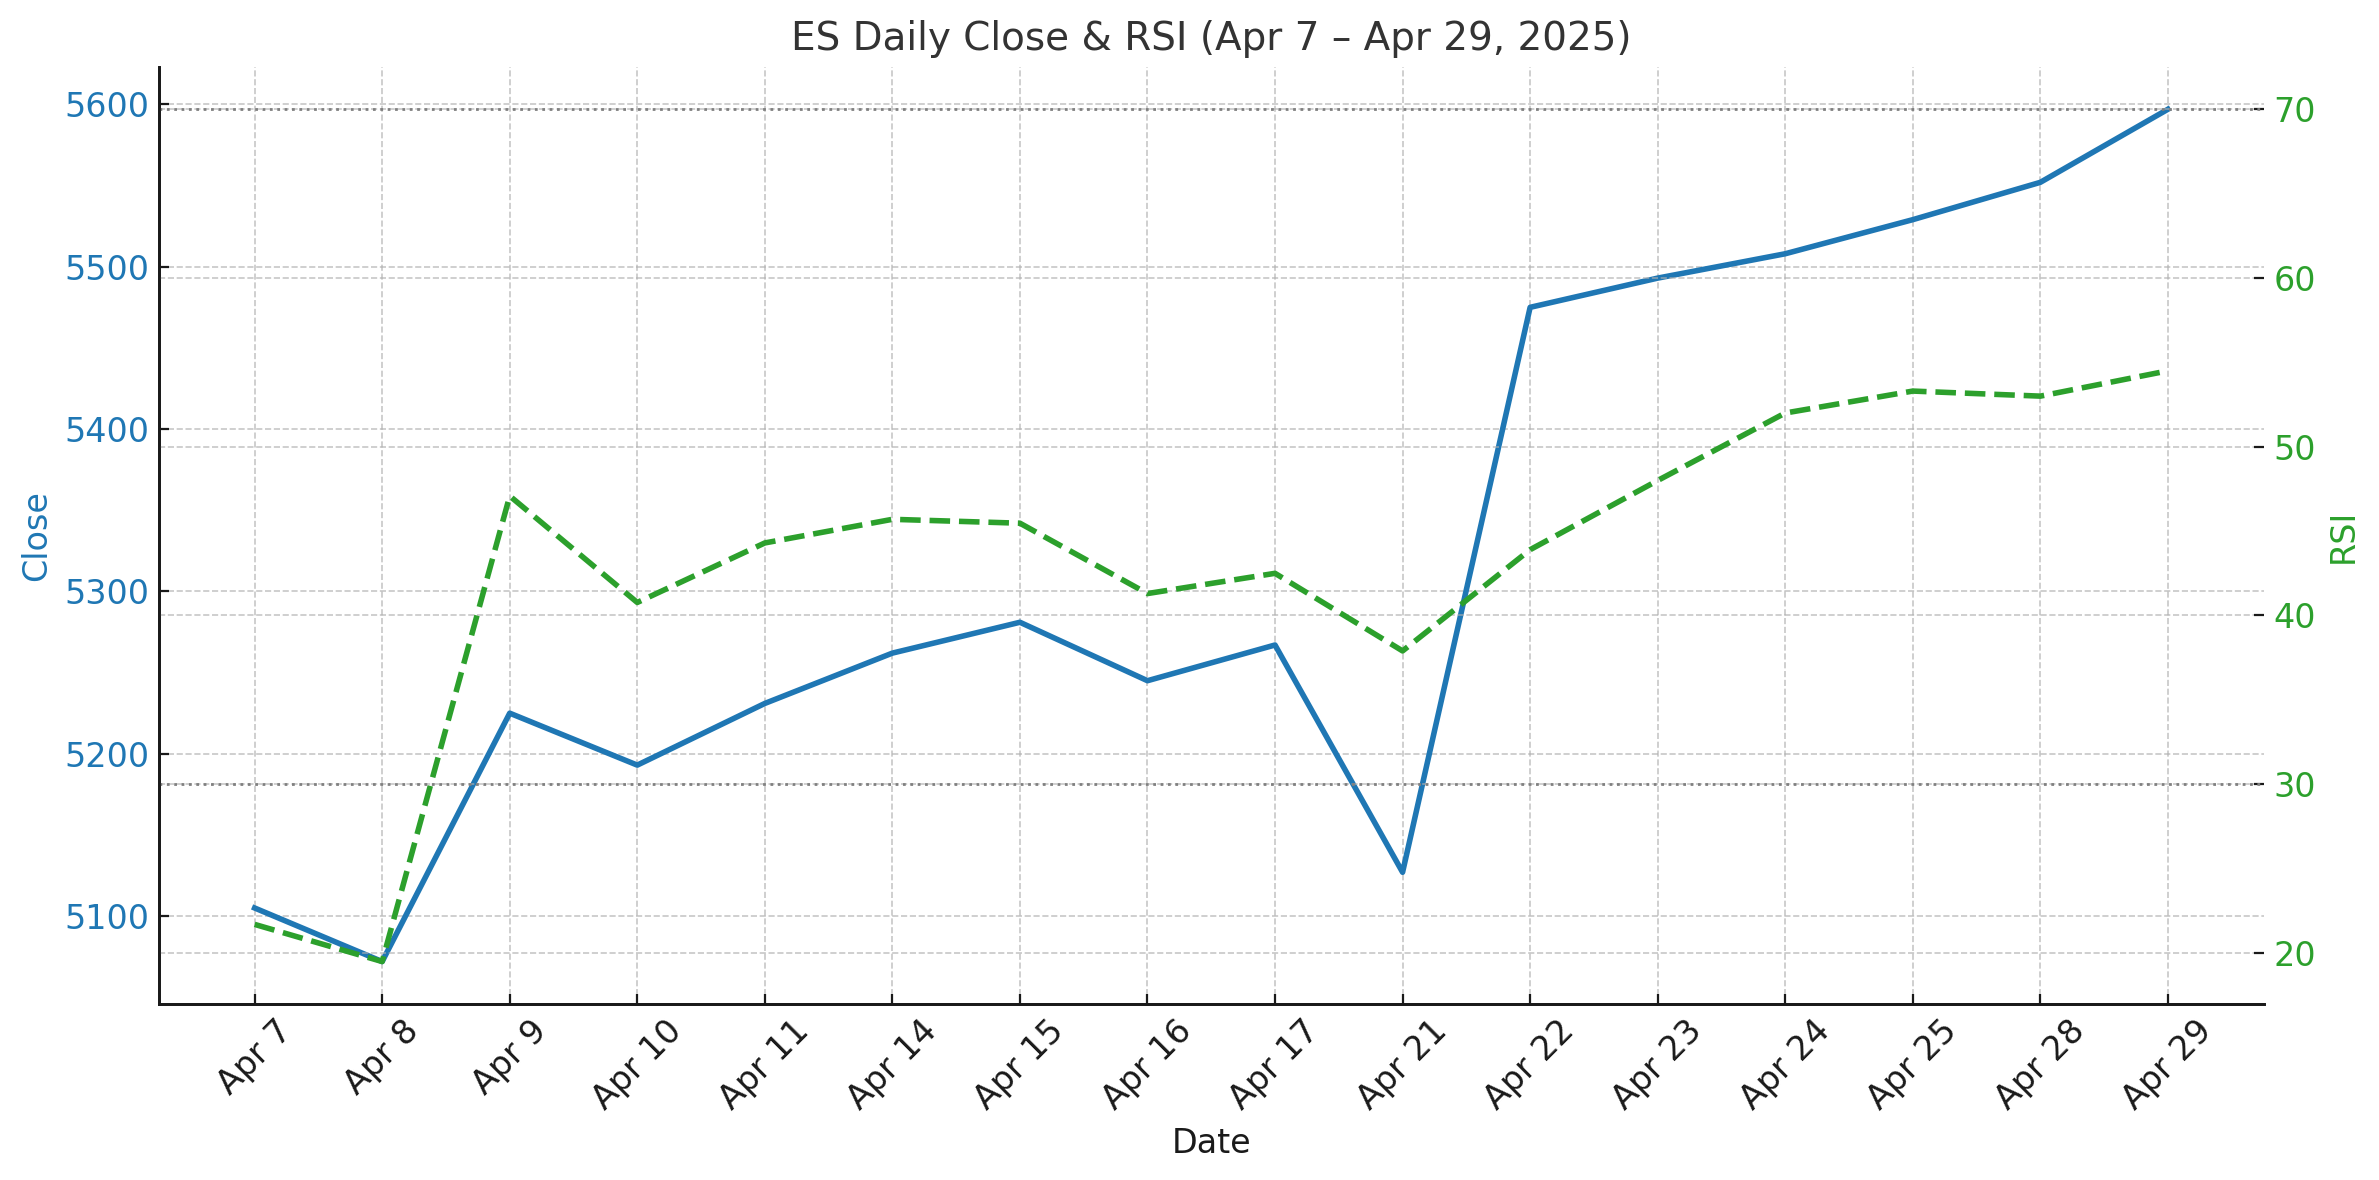
What This Chart Shows:
Momentum (RSI) bottomed out hard in early April, hitting ~19–21.
Price made a sharp low on April 21 (5127), but RSI only dipped slightly
Since then, we’ve had both price and RSI climbing in lockstep, showing structural confirmation — not hype.
RSI remains well below overbought of 60, even after six green closes.
7 Days of Green?
History says — It ain’t gon happen.
Structure says — We’ll give it our best.
Let’s get to it.
Keep reading with a 7-day free trial
Subscribe to ES Daily by PriceTrader to keep reading this post and get 7 days of free access to the full post archives.