
Trump’s Deadline Is Hours Away. Something Doesn’t Add Up in Oil.
Crude is reacting to escalation. Diesel isn’t confirming it.

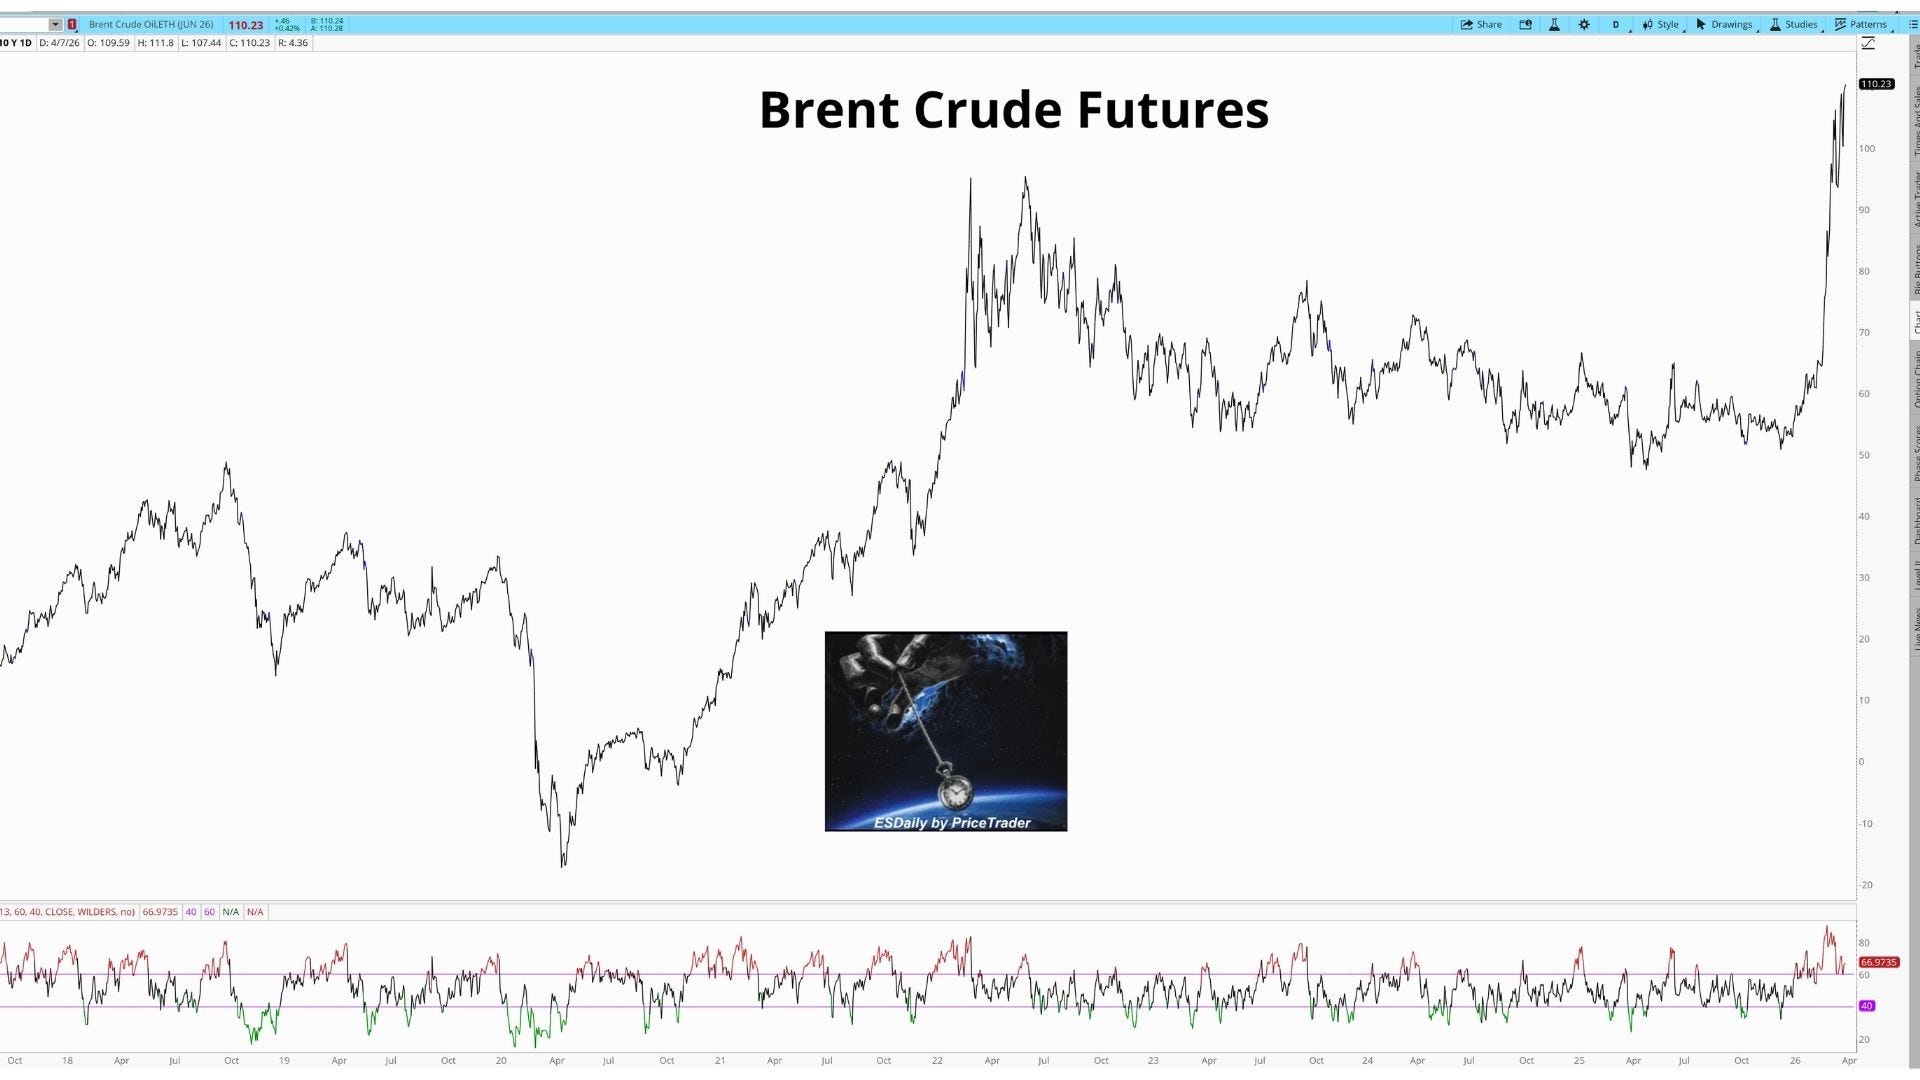
Oil gone vertical.
From $55 in January to $115 in early April.
But, what’s happening underneath doesn’t line up…
It may make you feel like you missed it.
I get it.
It’s hard to think clearly right now.
You turn on the TV and someone is telling you the war is almost over.
Two weeks. Maybe three.
Then you scroll your phone and see the opposite.
More strikes. More threats. Deadlines. Ultimatums. Missiles landing in places most people never heard of… let alone could find on a map.
You see clips of “regime change.”
You see people speaking with certainty about things that clearly aren’t certain.
And then you see the memes.
Oil at $150. $200. Jokes about something that doesn’t really feel like a joke.
Note: Here’s my favorite 😂

And somewhere in the middle of all that, oil is moving fast.
But, not everything is moving with it.
The United States, Israel, and Iran are in an active conflict.
The Strait of Hormuz, one of the most important energy chokepoints in the world, is effectively restricted. Roughly 20% of global oil supply moves through it, and at times, traffic has dropped close to zero. You can see this live at:
https://www.marinevesseltraffic.com/HORMUZ-STRAIT/ship-traffic-tracker
If this were already a real shortage, you’d expect to see it everywhere.
Right now, you don’t.
➡️ Missile strikes are ongoing.
➡️ Infrastructure is being hit.
➡️ Deadlines are being issued and ignored.
At the same time, there are constant signals that things could calm down. Talks. Mediation. Statements that the war is “nearing completion.”
So you end up with two completely different stories at once:
This could be over soon
This could get much worse
And the market is trying to price both at the same time.
That’s why oil is moving like this. Not because the outcome is clear, it isn’t. When the world gets this noisy, it’s easy to feel like you need to react.
Buy something.
Sell something.
Do something.
But before doing anything, it helps to step back and look at what’s actually happening underneath the headlines.
Think of oil like something very simple.
You don’t use crude oil directly. You turn it into things like diesel and gasoline. Those are what actually power the real world. So if something is truly wrong with supply, you should see it show up in both places.
Not just crude.
Right now, crude is moving like there is a shortage.
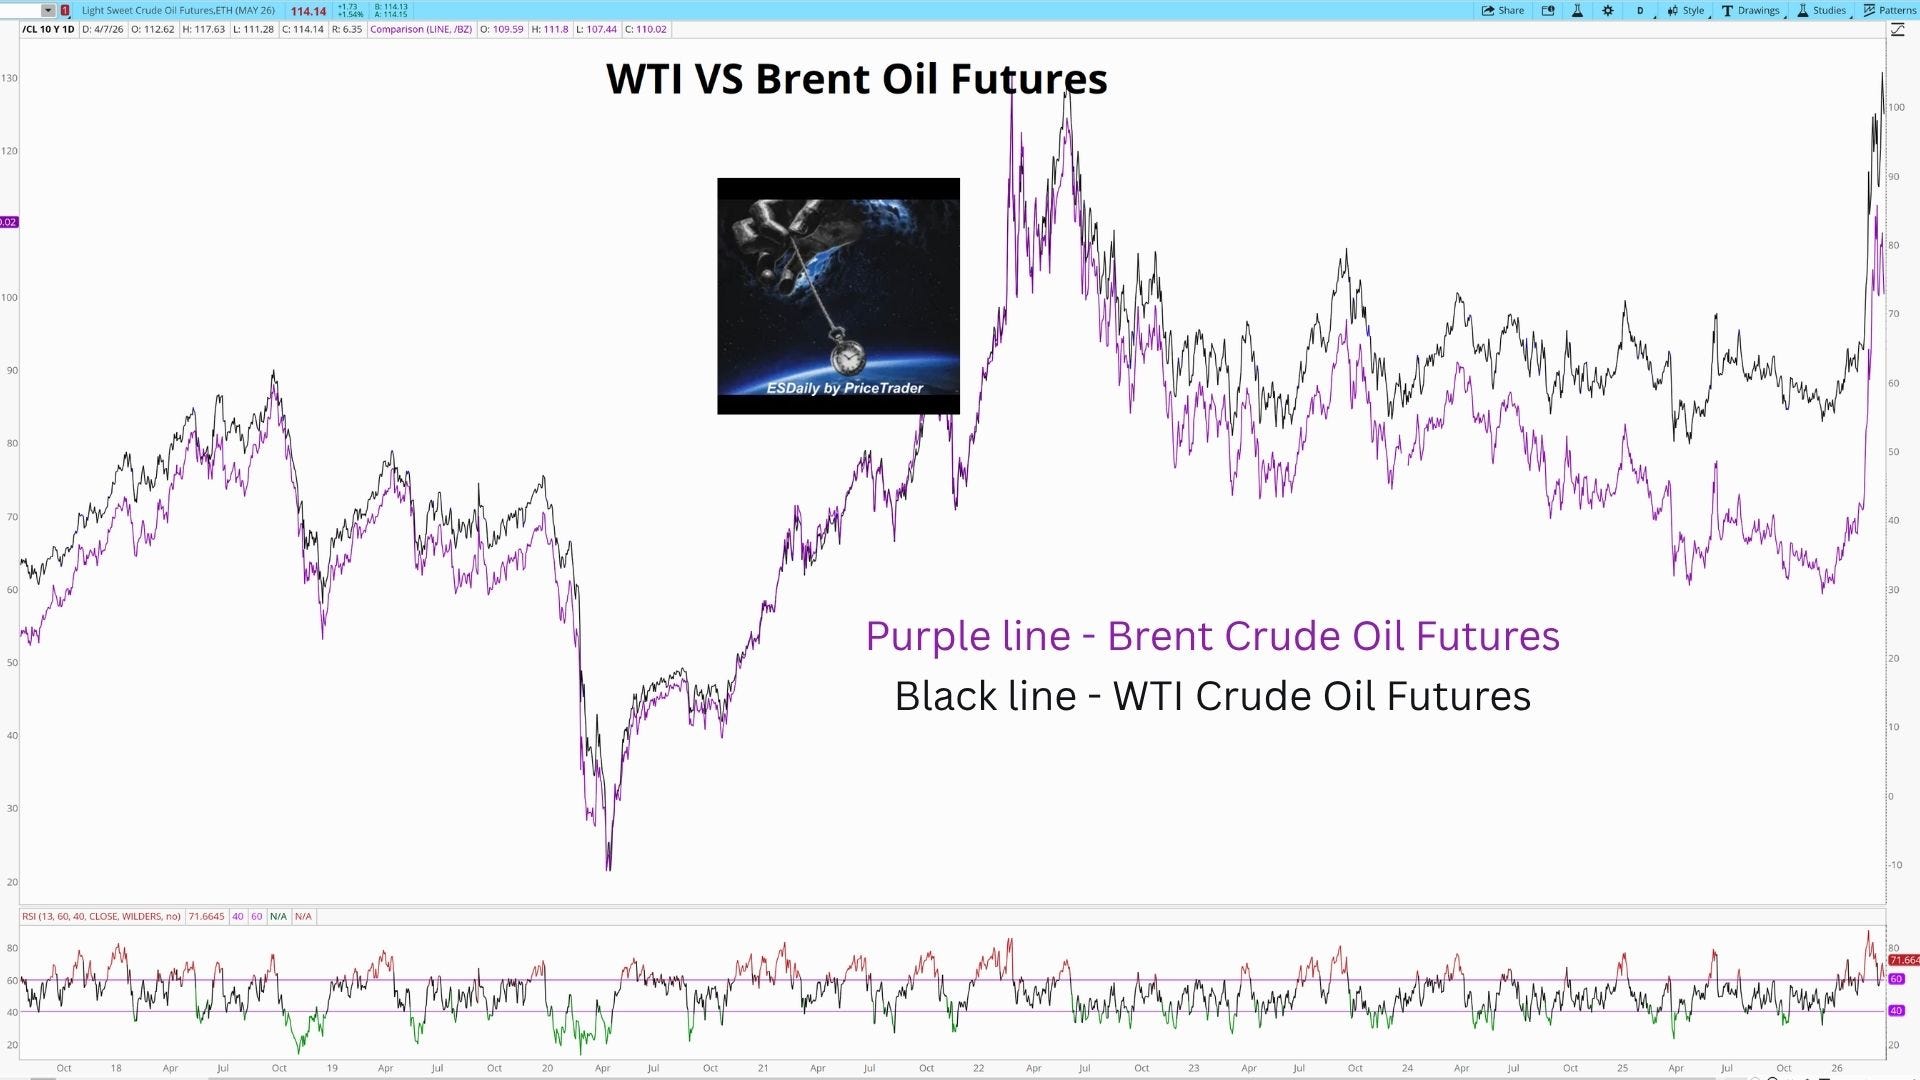
But diesel is not.
That difference is called the crack spread.
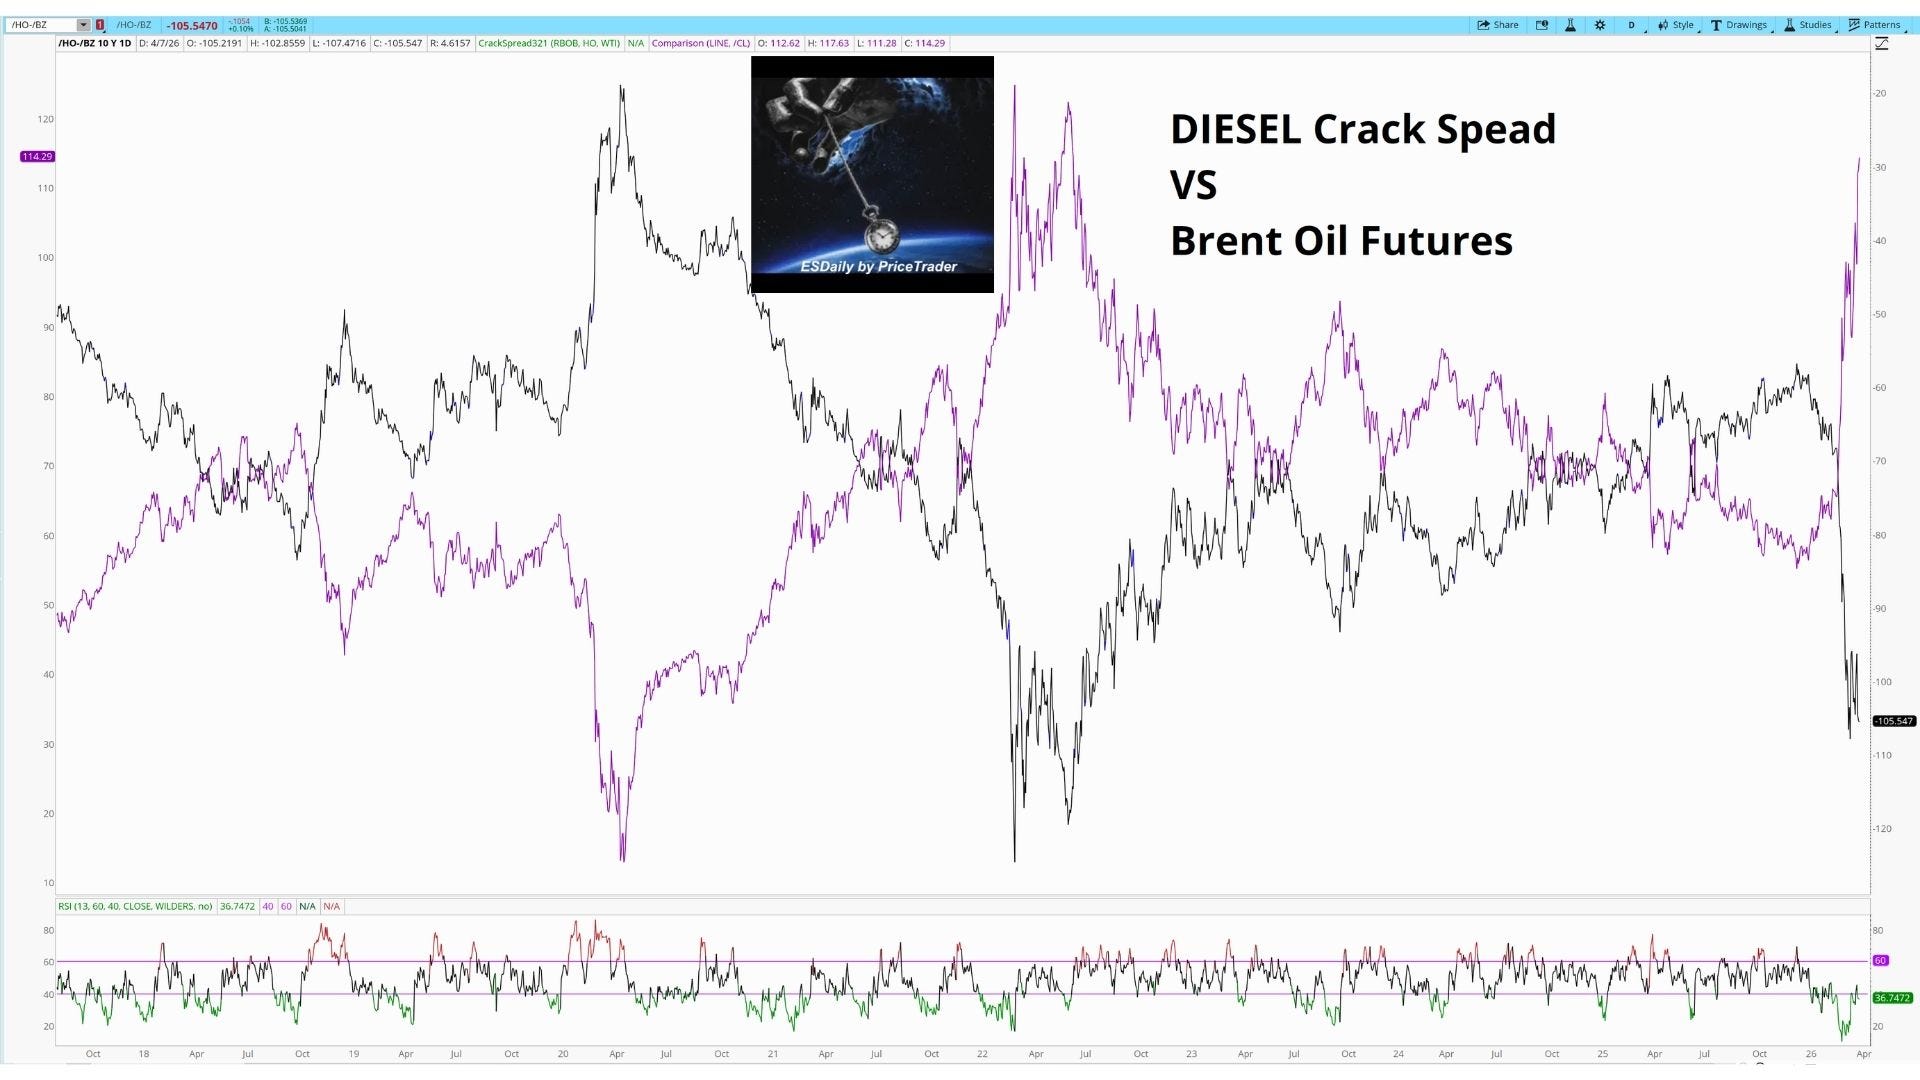
And it’s one of the simplest ways to understand whether the move in oil is real or just early.
If oil goes up and diesel goes up with it, that tells you the system is tight.
If oil goes up and diesel doesn’t, that tells you something is out of sync.
That’s exactly what’s happening now.
Crude is exploding higher.
The diesel crack is falling hard.
That’s not how a tight system behaves.
That’s a mismatch.
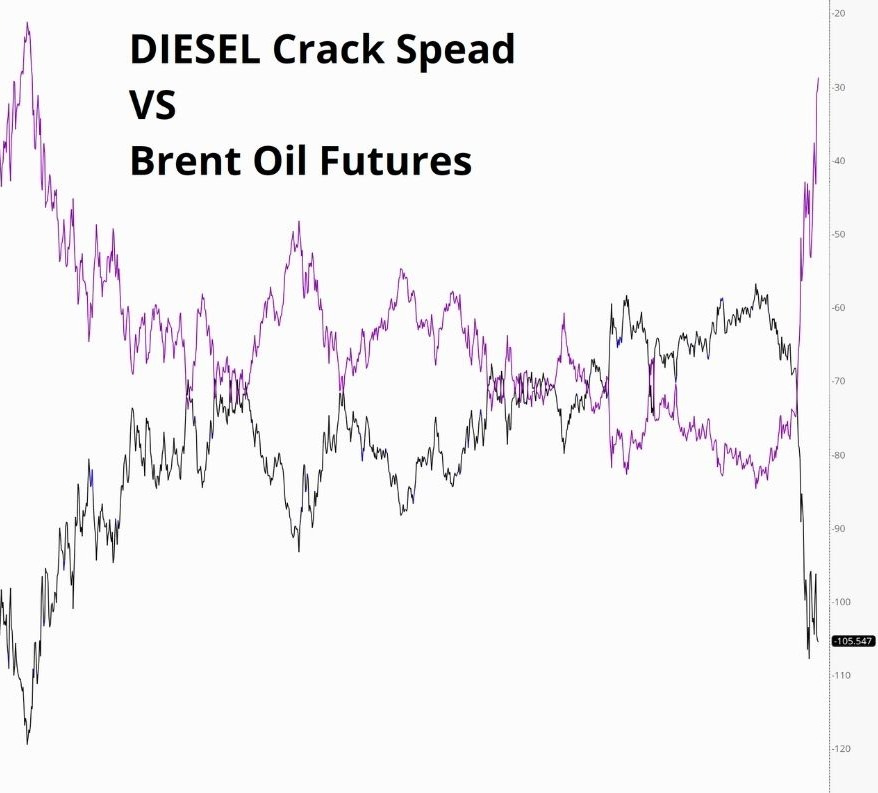
That combination doesn’t usually last.
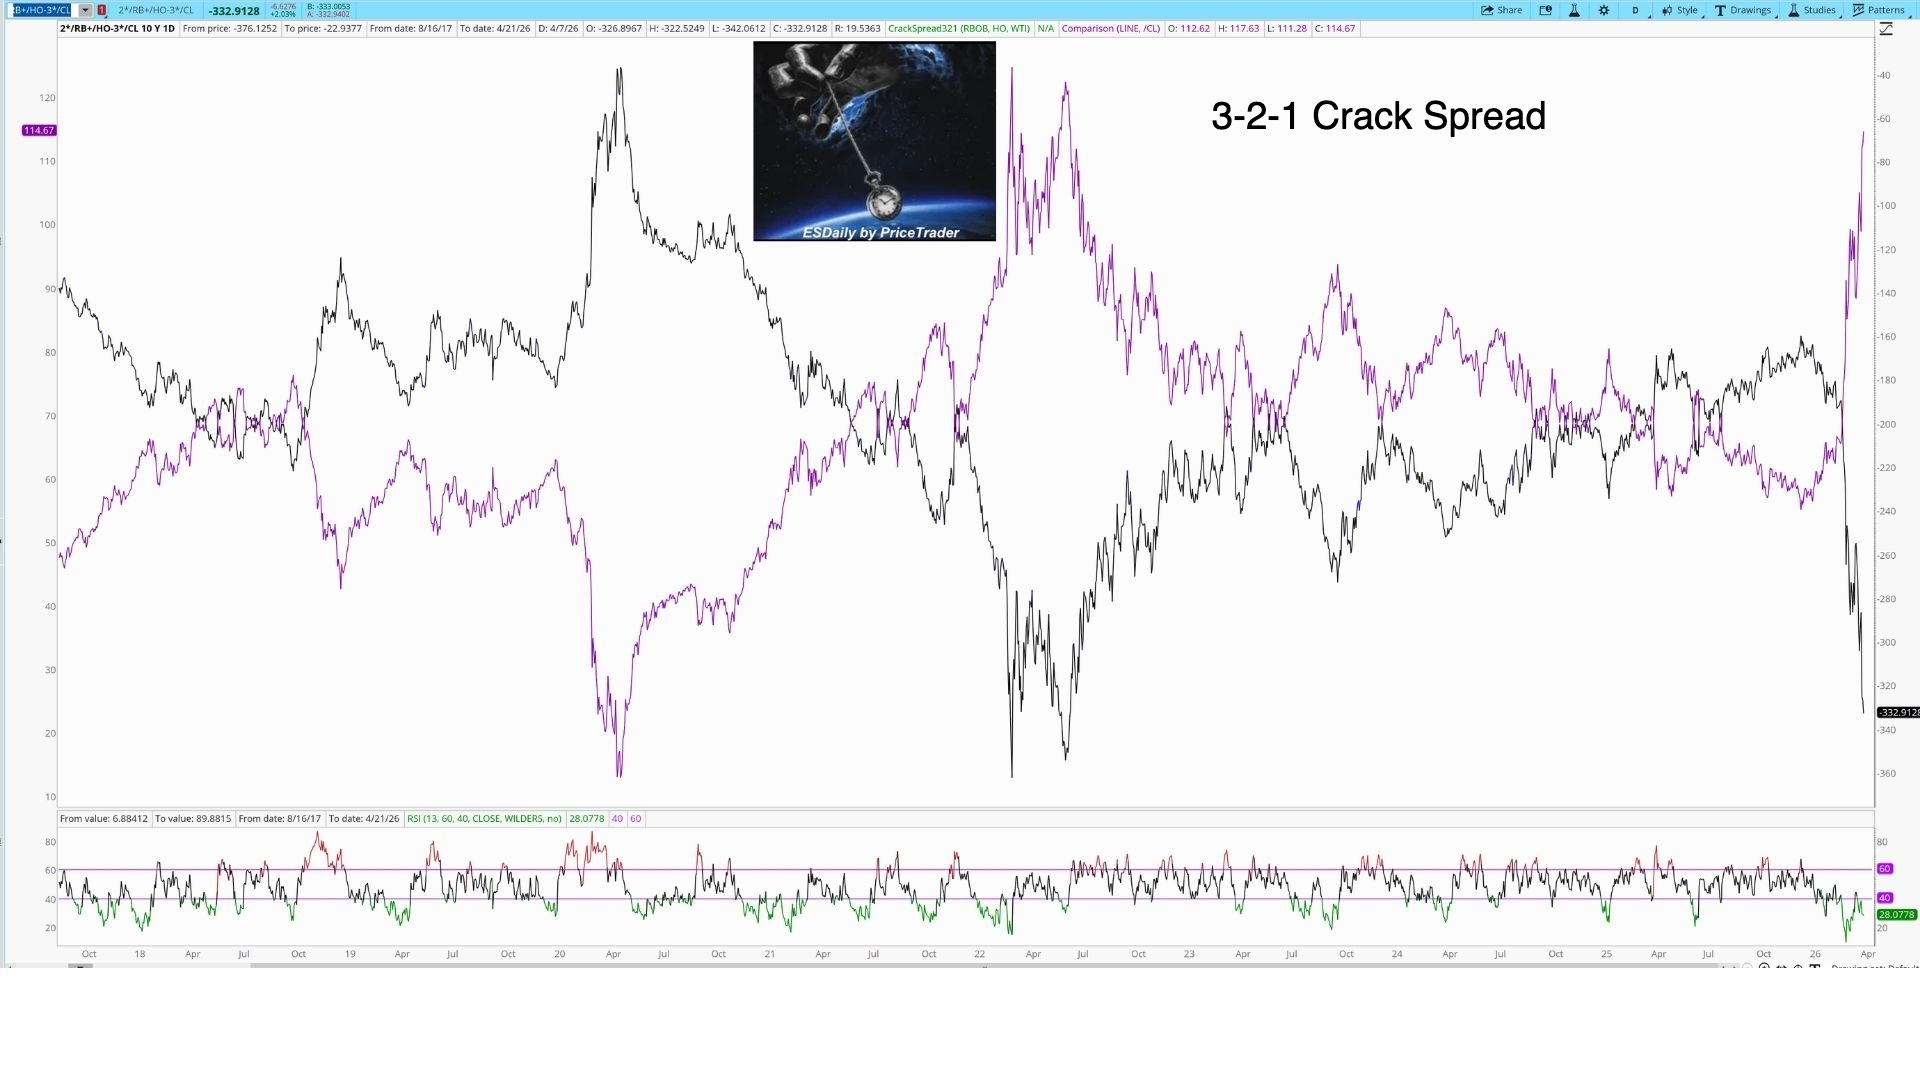
This chart - known as the 321 Crack Spread shows something slightly different from the diesel crack.
Instead of isolating one product, it looks at the broader product complex.
Gasoline and diesel together relative to crude gives you. a broader sense of the oil breakdown. It gives you a sense of how refined products, as a group, are behaving.
And what it’s showing is consistent.
Products are lagging crude.
But diesel still matters more.
Gasoline is more seasonal and more tied to consumer behavior. It moves with driving demand, weather, and short-term trends.
Diesel is different.
It is tied to freight, industry, and global trade.
It is less discretionary and is much more impacted by what is going on today in the middle east supply distruption.
So when you want to know if the system is truly tight, diesel is the cleaner signal.
That’s why the weakness in diesel stands out.
It’s not just that products are lagging. It’s that the part of the market most sensitive to real economic demand and logistics pressure is not confirming the move in crude.
Because when you look back at history, whenever the spread gets this weak, oil is usually near a turning point.
In 2020, it led to a collapse.
In 2022, it marked the top.
In more normal periods, it led to sideways movement.
But there’s a catch.
Those were demand problems.
This is a supply problem.
And supply problems tend to play out differently.
They don’t hit all at once. First, crude reacts to the risk. Then, over time, the system starts to feel it. Inventories drop. Shipping slows. Refineries struggle to keep up.
Eventually, products like diesel begin to move.
We are not there yet.
Right now, what you’re looking at in these charts is a gap. Crude is pricing what might happen. Diesel is reflecting what has happened so far. That gap doesn’t stay open forever.
It resolves one of two ways.
Either crude came too far, too fast and it pulls back.
Or the system catches up and diesel moves higher.
The headlines won’t tell you which one is happening. The tweets won’t tell you. The talking heads won’t tell you.
But, the chart will.
If diesel keeps falling, the move in oil probably needs to cool off. If diesel stabilizes and starts moving higher, that’s when things change.
That’s when the shortage becomes real.
And if that happens, the move you’ve already seen in oil is probably not the move.
It’s just the beginning.
So what do you do?
You watch the system.
Crude has moved.
Now you watch diesel.
When real tightness meets a supply shock, prices don’t drift. They move in fleets making $100/oil look like childs play...
The effect that has on the global economy?
Well… it’s not good.
-PriceTrader
I write these in real time, as things are unfolding.
If you want to follow along, subscribe.