
ES +9.5% In Biggest Daily Gain Recorded -April 10 Gameplan
ES Puts in a 646.25 point peak to trough rally, breaking intraday records

Thursday, April 10, 2025
Well, that escalated quickly.
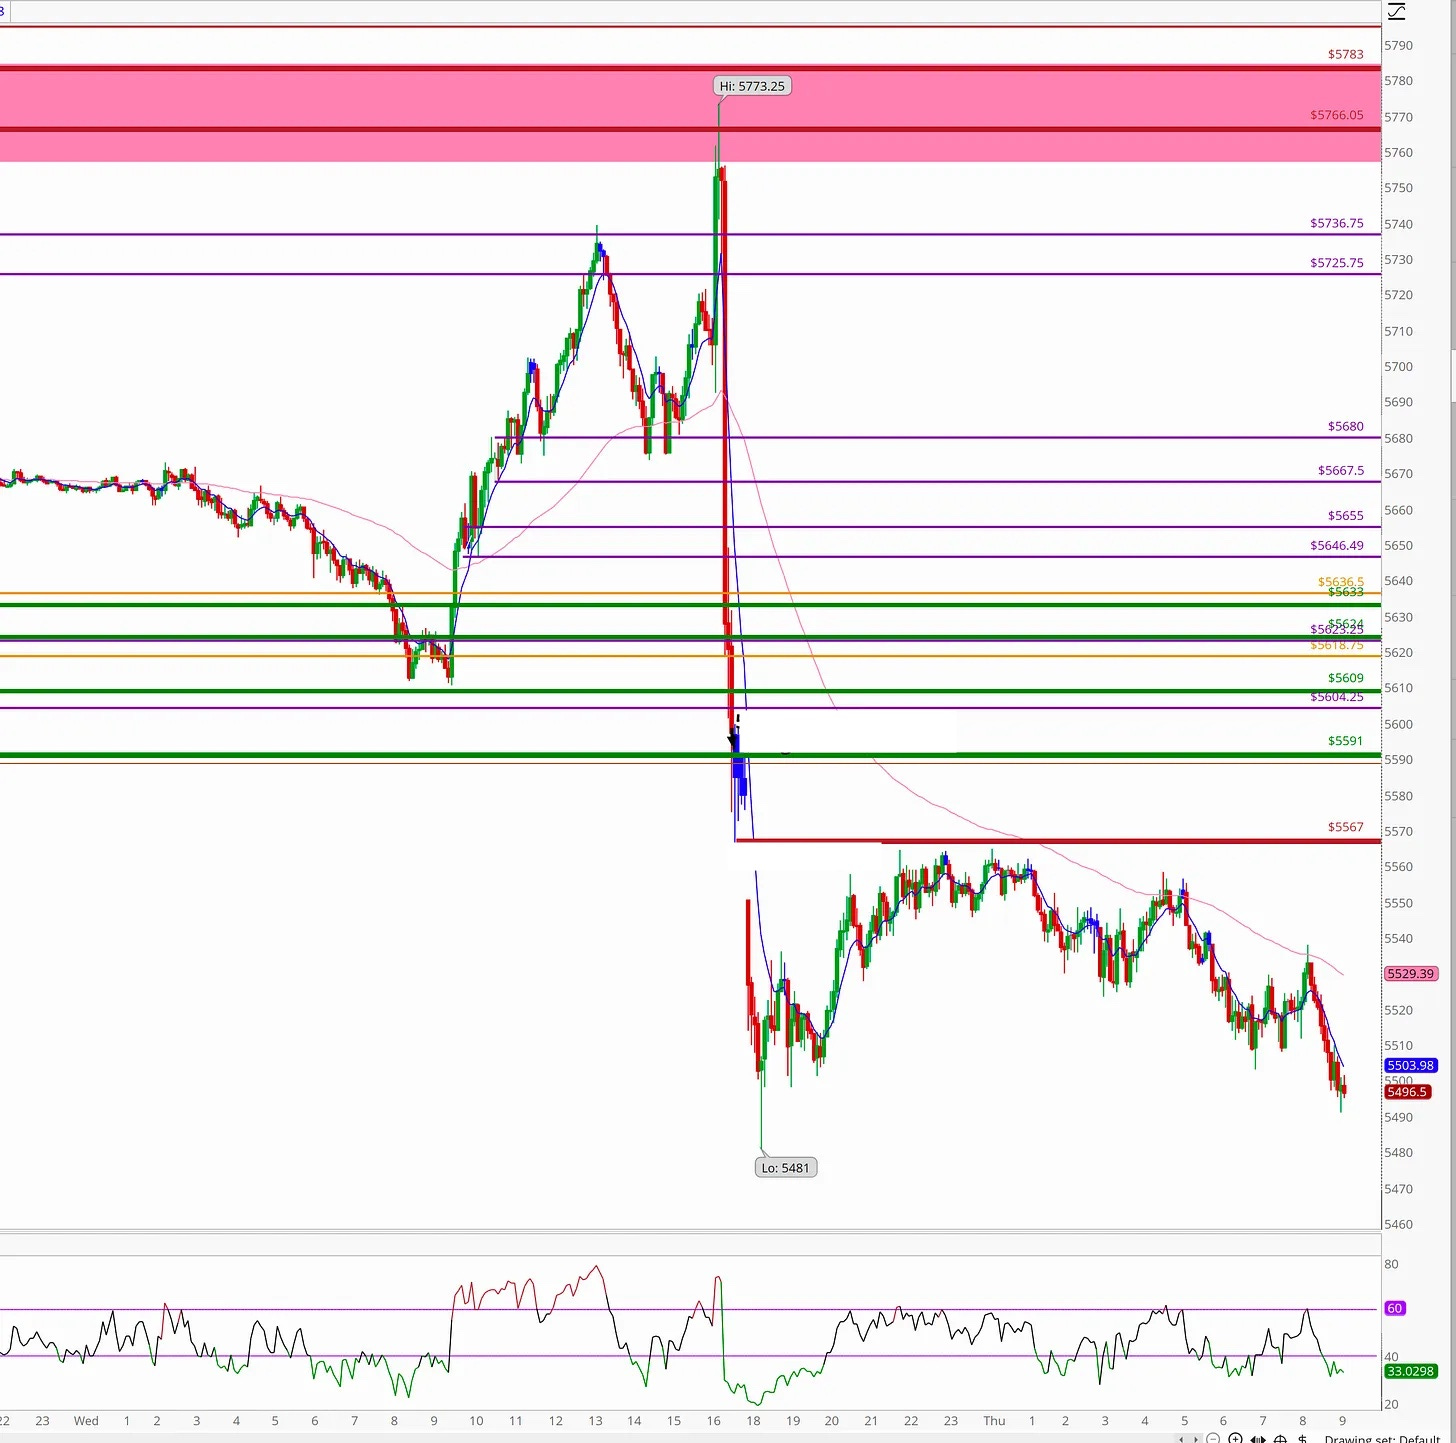
On Wednesday April 9, 2025 ES printed its biggest single-day gain ever. +9.5%, or 646.25 points off the bottom. Peak to trough. In one session. That’s not a typo.
This move broke records, erased resistance, and caught nearly everyone offside. Just 24 hours ago we were talking about fading momentum and a dying bounce. Yesterday? April 9 Gameplan was literally titled: The Dead Cat Is On Life Support. It turned into a jet-fueled vertical squeeze that melted through every ceiling in sight.
So what happened?
No rate cut. No Fed pivot. CPI didn’t drop (CPI print 8:30AM 4/10/25). There wasn’t some magical GDP print.
What changed was positioning.
Trump tariff’s caused the selloff started April 2nd that took price from (5773.25) to 4832 (low). He paused reciprocal Tariff’s for 90 days, except on China where he went full throttle, increasing to 125%. (They are going tit for tat here).
The market got too short, too fast, and it got lit up.
From a structural view, we’d already bounced off 4852 and spent a few sessions grinding higher. But this? This was a short unwind meets forced chase situation. Everyone who got short below 5200 thinking we’d revisit the lows? They got steamrolled. Then CTAs and algos flipped long. Then funds had to chase.
It was a chain reaction. And the result was a historic one.
Look at the chart. You’ll see how clean this rally was once it “reclaimed” the 5073 low from Friday, April 4 low and Tuesday Apr 8/Apr9 critical area.
No hesitation. No fakeouts.
Just one-way flow straight through 5528 and into the upper 3/4 Hr supply area from April 2. This is rare velocity. It’s what happens when everyone is wrong at once.
The precision, even during wild volatility, is the reason ES is the greatest financial instrument to trade.
Take a look at the chart with notes:
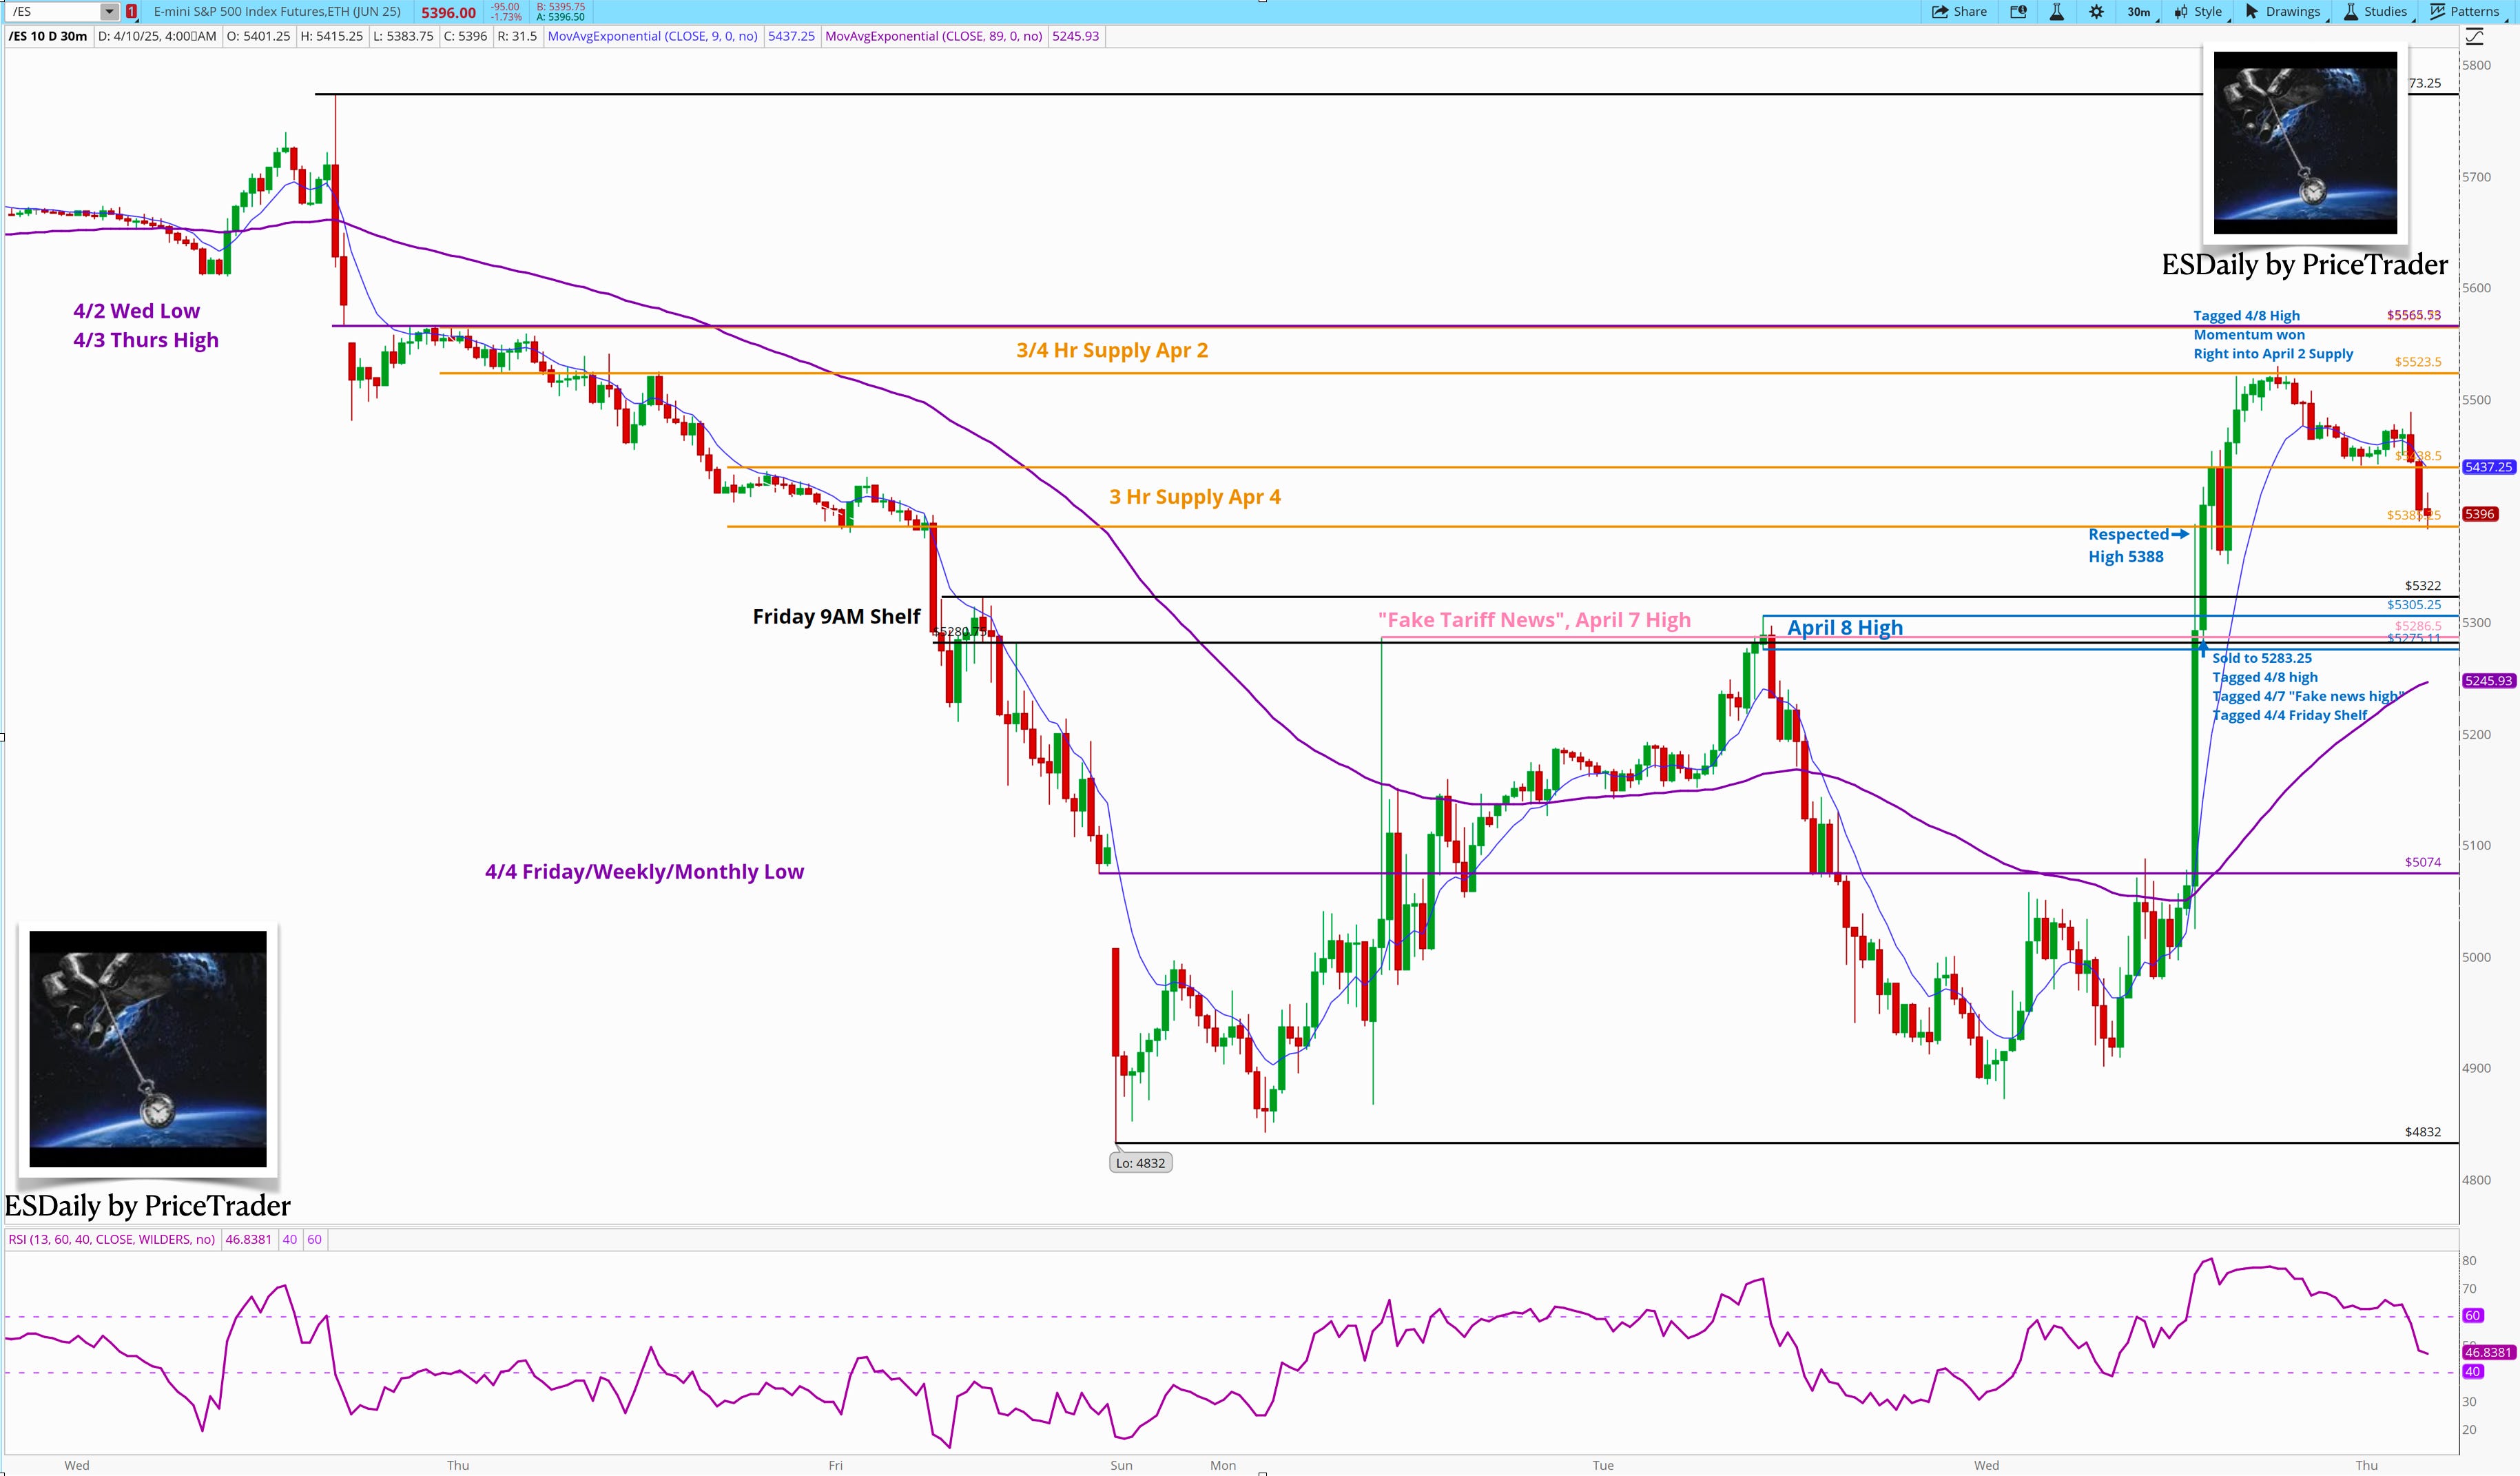
April 9 Newsletter Offered 4969 reclaim — We Rallied 559 points from there
Hard Rally - ES had fleet movements into 3 hr supply (5383-5438) from April 4th — Respected
First and Hardest Sell - Move down from there was a fast 105 decline, from 5388-5283 - Tagging April 8 High, Fake Tariff News High, and The Friday Shelf. Precise.
Resistance Flips To Support - April 8 High, Fake Tariff News High, and The Friday Shelf turned in support for the rally, carrying it to the next level —.
3/4 Hr Supply From April 2. Calculated.Momentum Faded Into April 2nd Supply - As RSI diverged into the level, sellers showed up. We’re off 150 points or so
I wrote this in the early hours Wednesday and posted in April 9 newsletter:
No direct bid/ask levels I’m willing to commit to until something cleaner forms. I may entertain failed breakdown of 4969 into 4940 if we get there and it’s a clean bounce.
At first attempt we didn’t have a clean acceptance, and I wrote:
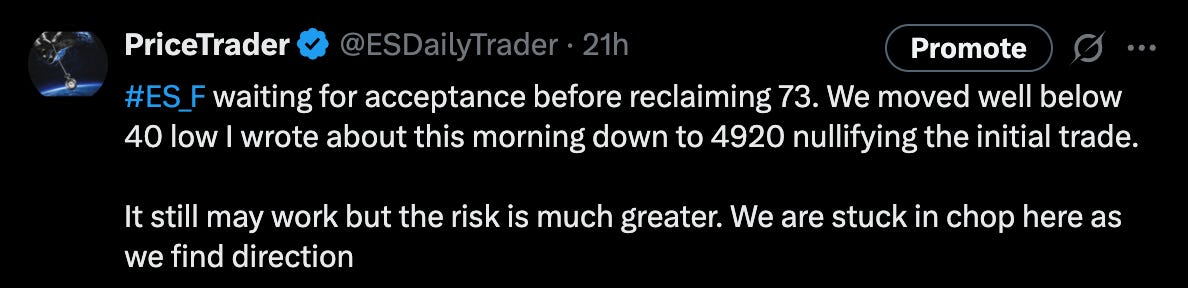
I then noted on a pullback to 4901.75:
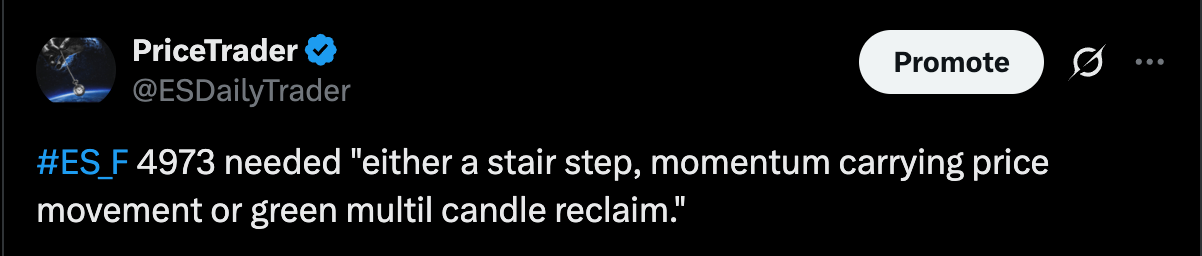
We got the stair step, price gave us a two head-fakes here, and finally pulled above the 4969-74 above 60 on RSI and Trade #1 was initiated on ES, filled at 4974.25 after some slippage.
Did we know a 550 point rally was coming?
No.
Did we catch the entire move?
Not even close.
And even though we noted:
No direct bid/ask …..failed breakdown of 4969 into 4940 …
The next area we can look to is 4903 before we see some bids.
At 7:44AM the low of the day was put in.
The price — 4901.75
Did we buy here?
No
But we figured it was a bouncing point that could catch a bid, ended up being the bounce needed to get into the Trade #1
We needed to wait for a setup that match our strategy and risk:reward. And even though there we’re more opportunities I’m sure we missed out on, there’s huge value in not playing roulette and gambling your account away by overtrading the rest of the day.
It did result in a fantastic trade, the only one of the day. Here’s a recap:
April 9th - 1 Trade
Trade #1- 4969 Reclaim. T1/T2/T3/T4 hit. Remaining stopped after move up and pullback

On this trade I noted targets of 5015/5029/5038/5054/5073:
The high was 5070 before it pulled back to 5012 and stopped us out on the runner.
In retrospect, turned out to be a huge “bummer” as we went parabolic after restesting 4980. However, we had no idea what happened would happen and we followed our plan, taking profits when their due, at the next level up. Here’s we scaled out as usual taking majority of profits at T1. The breakdown per targets was 60%/10%/10%/10%/10%
All these were posted inside the AM newsletter as resistance points.
In “The Dead Cat is On Life Support - April 9 Gameplan” I wrote:
Likely Resistances For 4/9 are: 5015, 5029, 5038, 5054, 5073…
Those resistances typically turn into targets on trades.
In profit protection mode, they always do.
Everything the rest of the day was a complete monkey trading zone.
When price has multi-hour, hundred point moves — the risk associated with hitting the buy/sell button multiplies 10X. I’ve said this many days in a row, and I feel like I keep repeating myself but:
We do not get paid for action.
We get paid for patience, discipline, and rule following.
The end result of an 80+ point trade is fantastic, even in a 646 point move.
Now, let’s not get drunk on those green candles yesterday.
This move needs digestion.
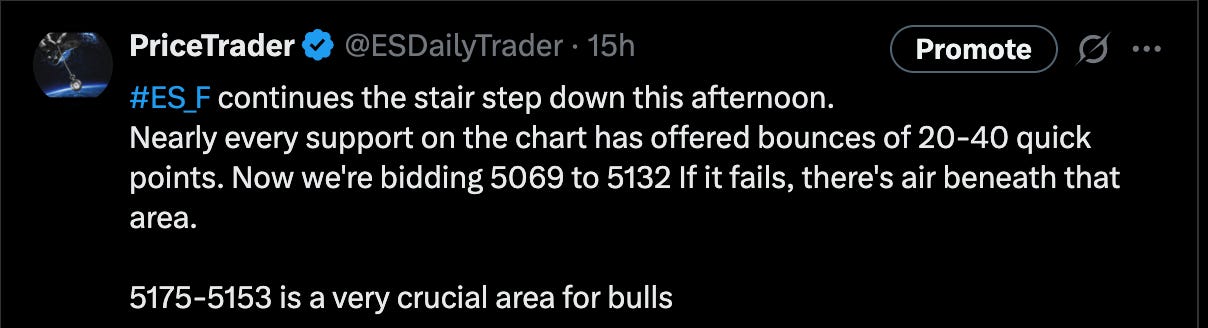
ES is now pressing into that 5523–5564 area, which is a known supply shelf, and it’s respecting it.
It wouldn’t be weird to see some fade or consolidation from here. That’s normal. Healthy, even.
So how do we trade it?
ESDaily Scoreboard
Note: The ESDaily Scoreboard was created to offer accountability for subscribers following the trade ideas shared here. All trades reflected in this scoreboard have been identified before they happen, documented in the newsletter, and often posted publicly on X at @ESDailyTrader. The Scoreboard operates on a 30-day rolling cycle and includes only trade ideas from the most recent 30 calendar days. The scoreboard assumes a scaling profit-taking method, where targets represent the percent of total contracts allocated per trade. Not all targets carry equal size. In the event of a full stop-out, the loss is applied across all contracts taken.
Disclaimer: ESDaily and its owners are not registered financial advisors or broker-dealers. The information provided is for educational and informational purposes only and should not be construed as investment advice or a recommendation to buy or sell any financial instrument. All trading involves risk. You are solely responsible for your own investment decisions. Past performance is not indicative of future results.
Let’s get to it in today’s April 9 AM premarket newsletter…
I cannot stress enough the importance of limiting your trades, and knowing where there are opportunities—and when there are not. This market doesn’t hand out trophies for participation. So many times, traders notch early wins, only to give them right back as Mr. Market slowly chips away at their stack throughout the day. One overtrade. One impulse entry. One “I’ll just try it” later in the session—and the edge is gone.
This environment rewards patience, not action. Sit on your hands until your spots come to you. Let the core setups develop. Let the market reveal its hand. If it’s not clean, skip it. Remember: your job isn’t to trade all day—it’s to extract high-quality risk from the tape and protect your capital like it’s your newborn baby.
Trade Recap Section:
Note: This Trade Recap section breaks down a few of the trades we’ve taken over the past several days. You’ll get insight into why I took the trade, how I approached the setup, and what I was looking for before pulling the trigger. These aren’t hindsight reviews — all setups are shared with readers in advance. Years ago, I began documenting every trade I took in a physical journal — printing charts, writing notes, and tracking my thought process before, during, and after each trade. That practice became a cornerstone of my growth. It helped me refine my edge, stay accountable to my rules, and improve faster than anything else I’ve done. Now, I share that process with you — so you can see real trades, real decisions, and real outcomes. The goal: shorten your learning curve by showing what it actually looks like to apply a strategy in live markets. Note: any targets and/or runners mentioned in the trade recap section may have been stopped out or moved. I include all position management of our trades inside future newsletters and on X.com.
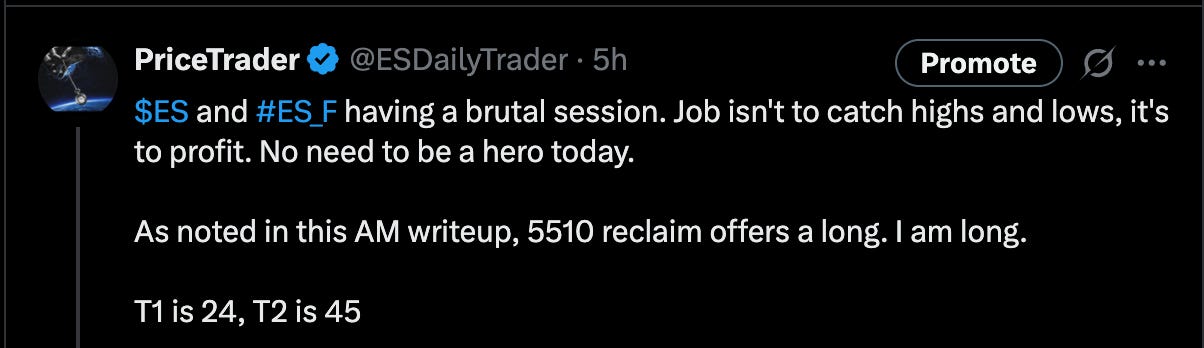
April 3rd - 2 Trades
Trade #1- 5010 Reclaim. T1 hit. Remaining stopped at breakeven
Trade #2 - 5479.50 Reclaim. T1-T2 hit. Runner stopped at breakeven
Trade #1 April 3, 5010 Reclaim
I started the day with the following chart:
Noting the following in this AM’s newsletter:
Likely Supports For 4/3 are: 5510 (reclaim), 5500(D), 5498, 5485 (D)
This idea of a reclaim, we’ve spelt out multiple times. As price attempted to find a bottom, the first opportunity that was given to us. Displaying a bottom was accepted, a new high was put in place, and we respected the existing rally at 5510 was the reclaim
Here’s a chart of the trade before the explanation below:
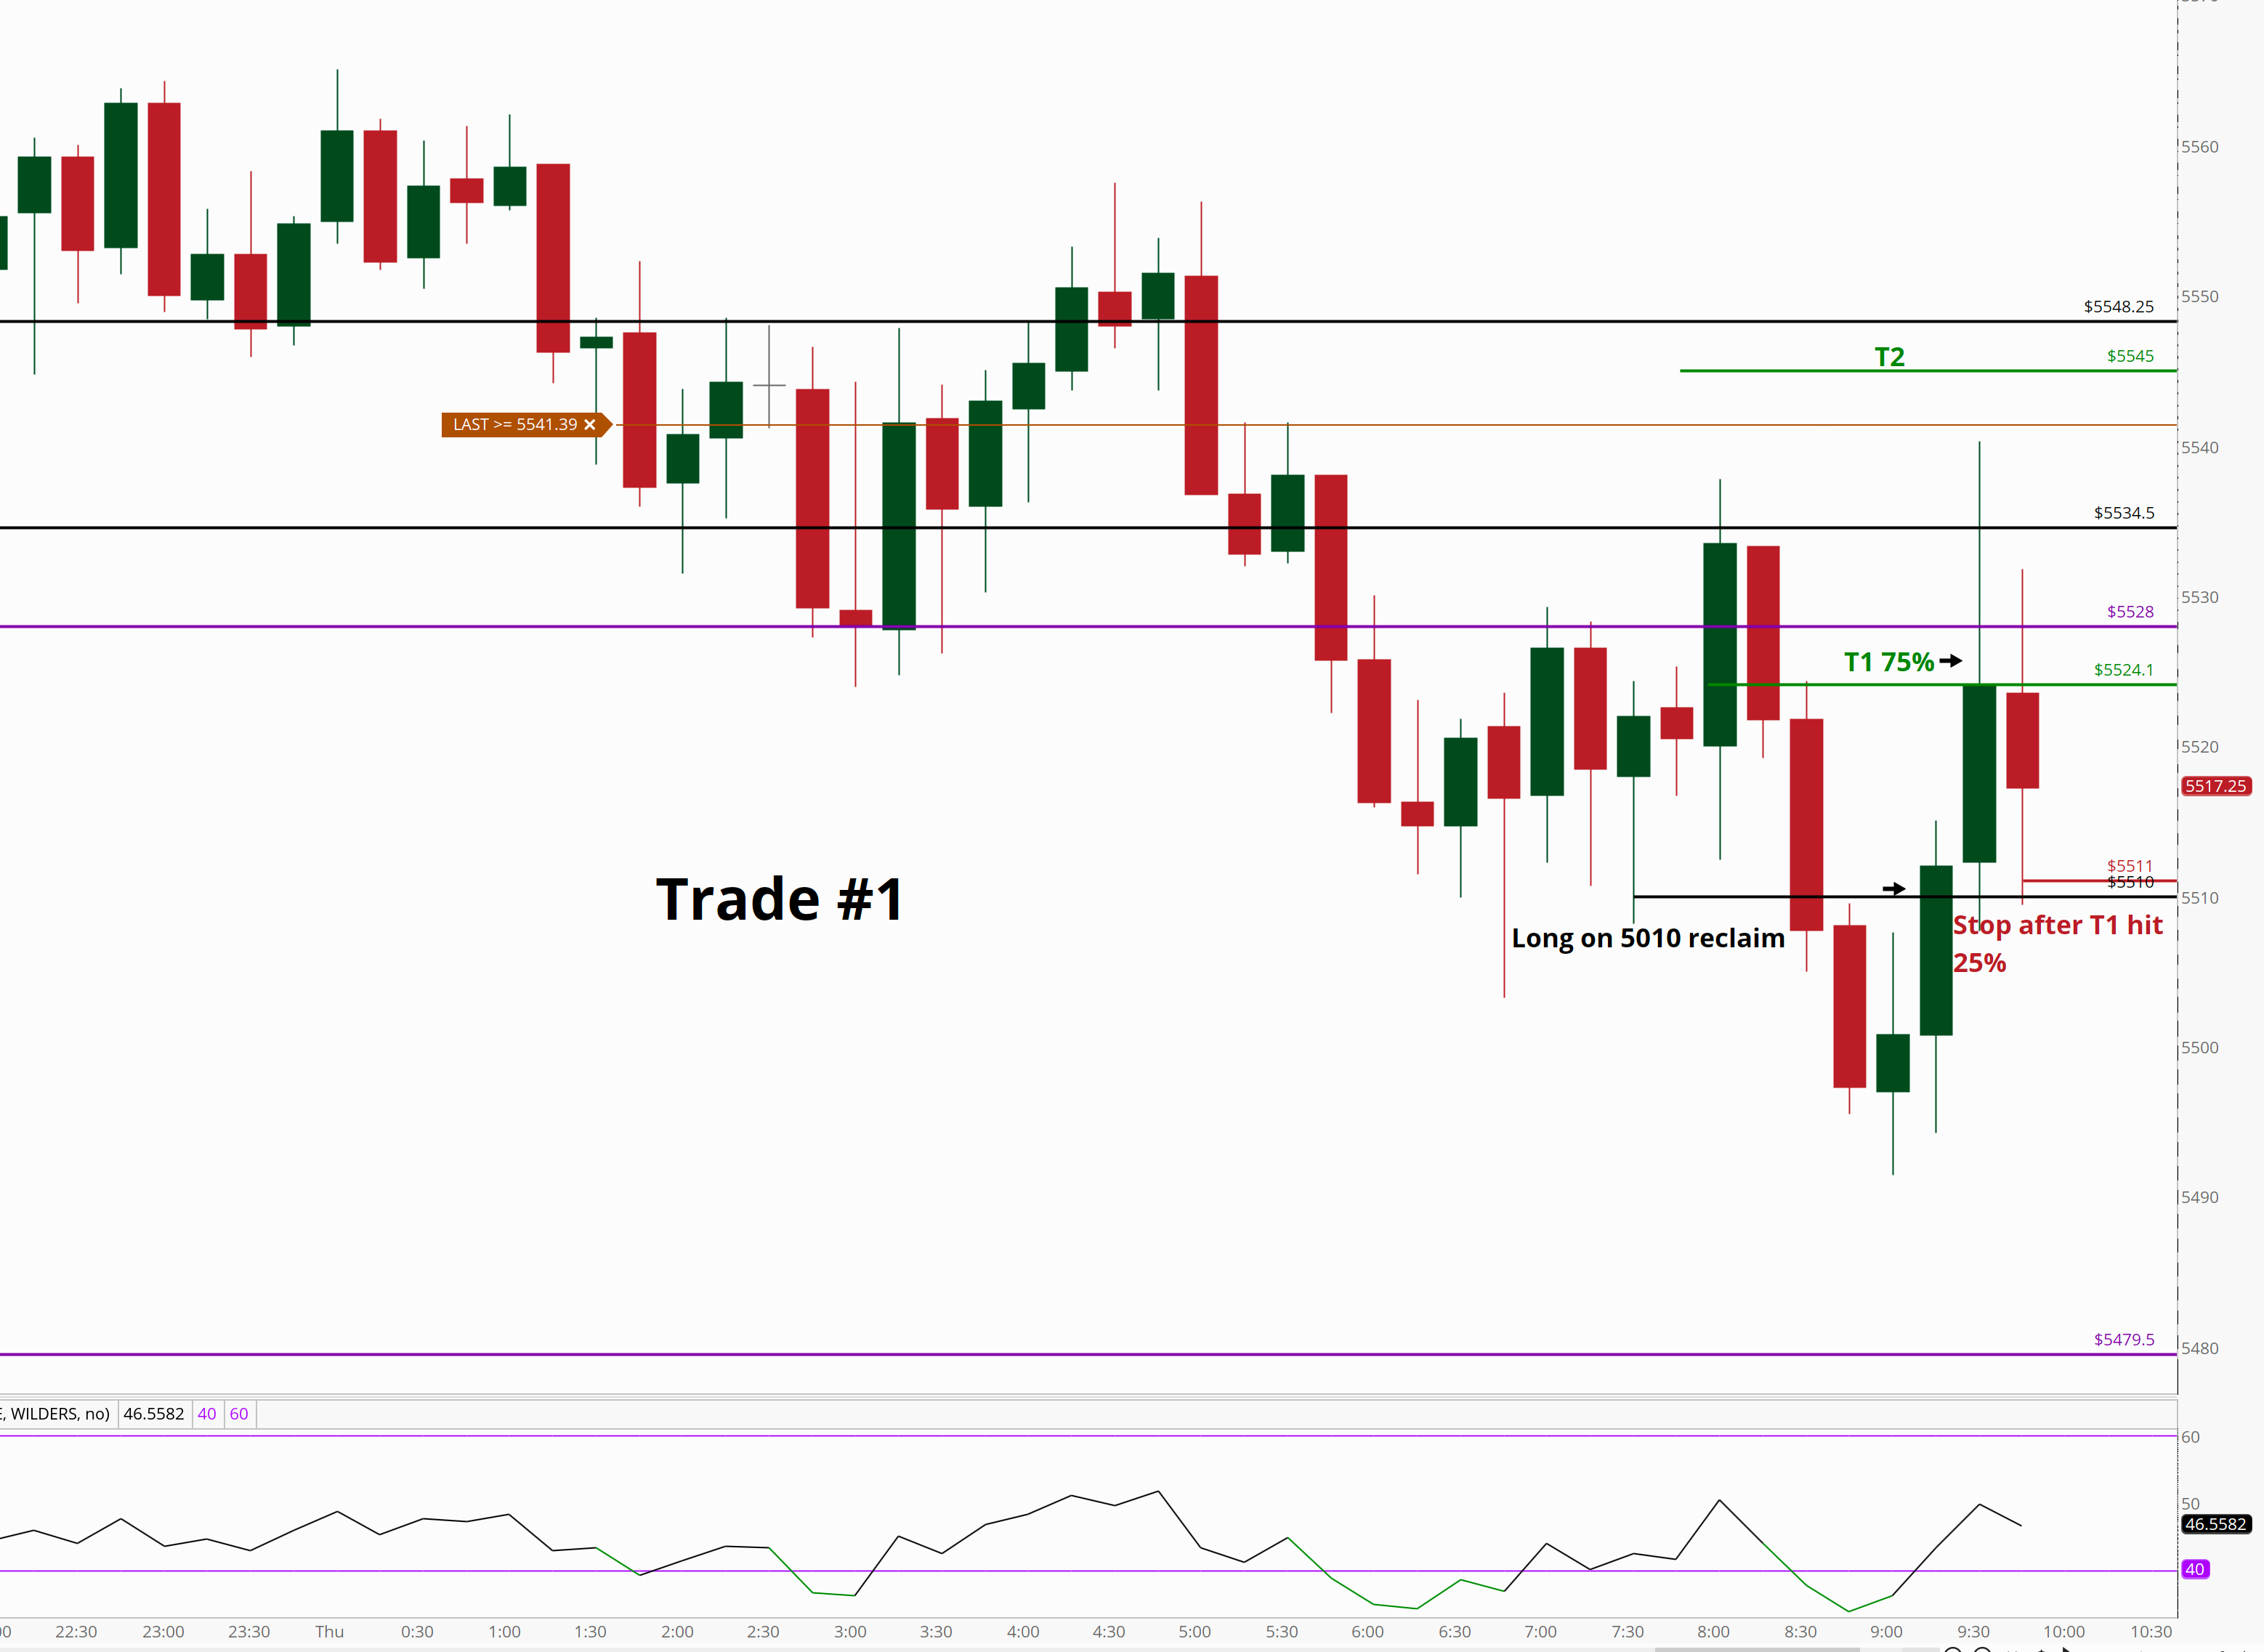
In the chart above we can see a 6:45AM EST low of 5503. We rallied from there back up inside the range the 5536 or so, before selling off premarket, finding a bottom at 5491. 5491 was the same area we got long yesterday after the initial collapse on Trade #1 post market. Interesting to see this area be the same bottom just 10 hours later.
As we accepted, and then recovered, we can see price reclaim the 6AM-7:40AM lows. Momentum shifted short term, and the simple trade was a 5510 reclaim long with T1, just at the 3AM low basically.
Because we hit this zone and entered the trade pre-market, I was inclined to respect overnight levels, especially on such a selloff. Within 1 minute of the regular trading hours 9:30AM EST open T1 was hit from 5510 to 5524.
I wrote:
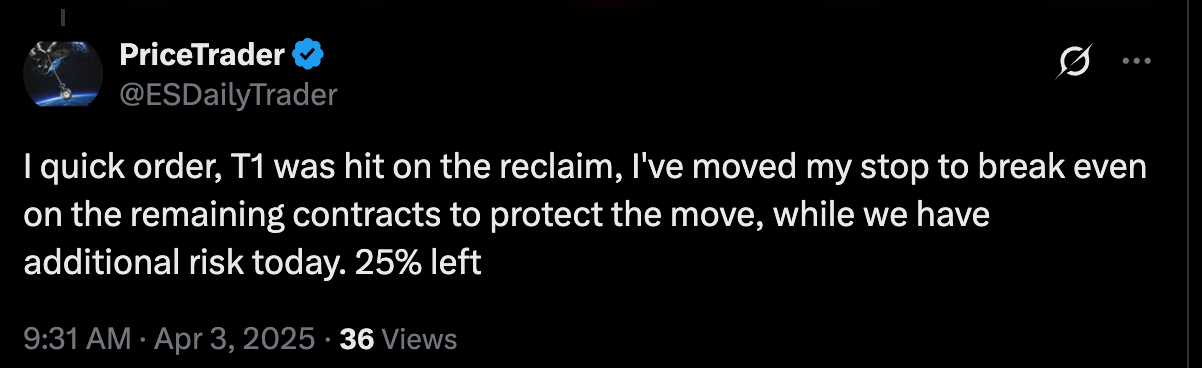
Upon entering the trade we took a full size position, hitting T1 within minutes, and simultaneously reducing the risk of the trade by dragging my stop to breakeven. This was just one tick above the entry, at 5511.
Price ultimately came within 5 points of our second target at 5540.25 (T2 was 5545) before turning around and stopping us out for a 14 point gain on 75% of the contracts taken.
At 9:50 I wrote:

Trade #2 April 3 - 5479.50 Reclaim long
Here’s what I wrote at 10:39AM:
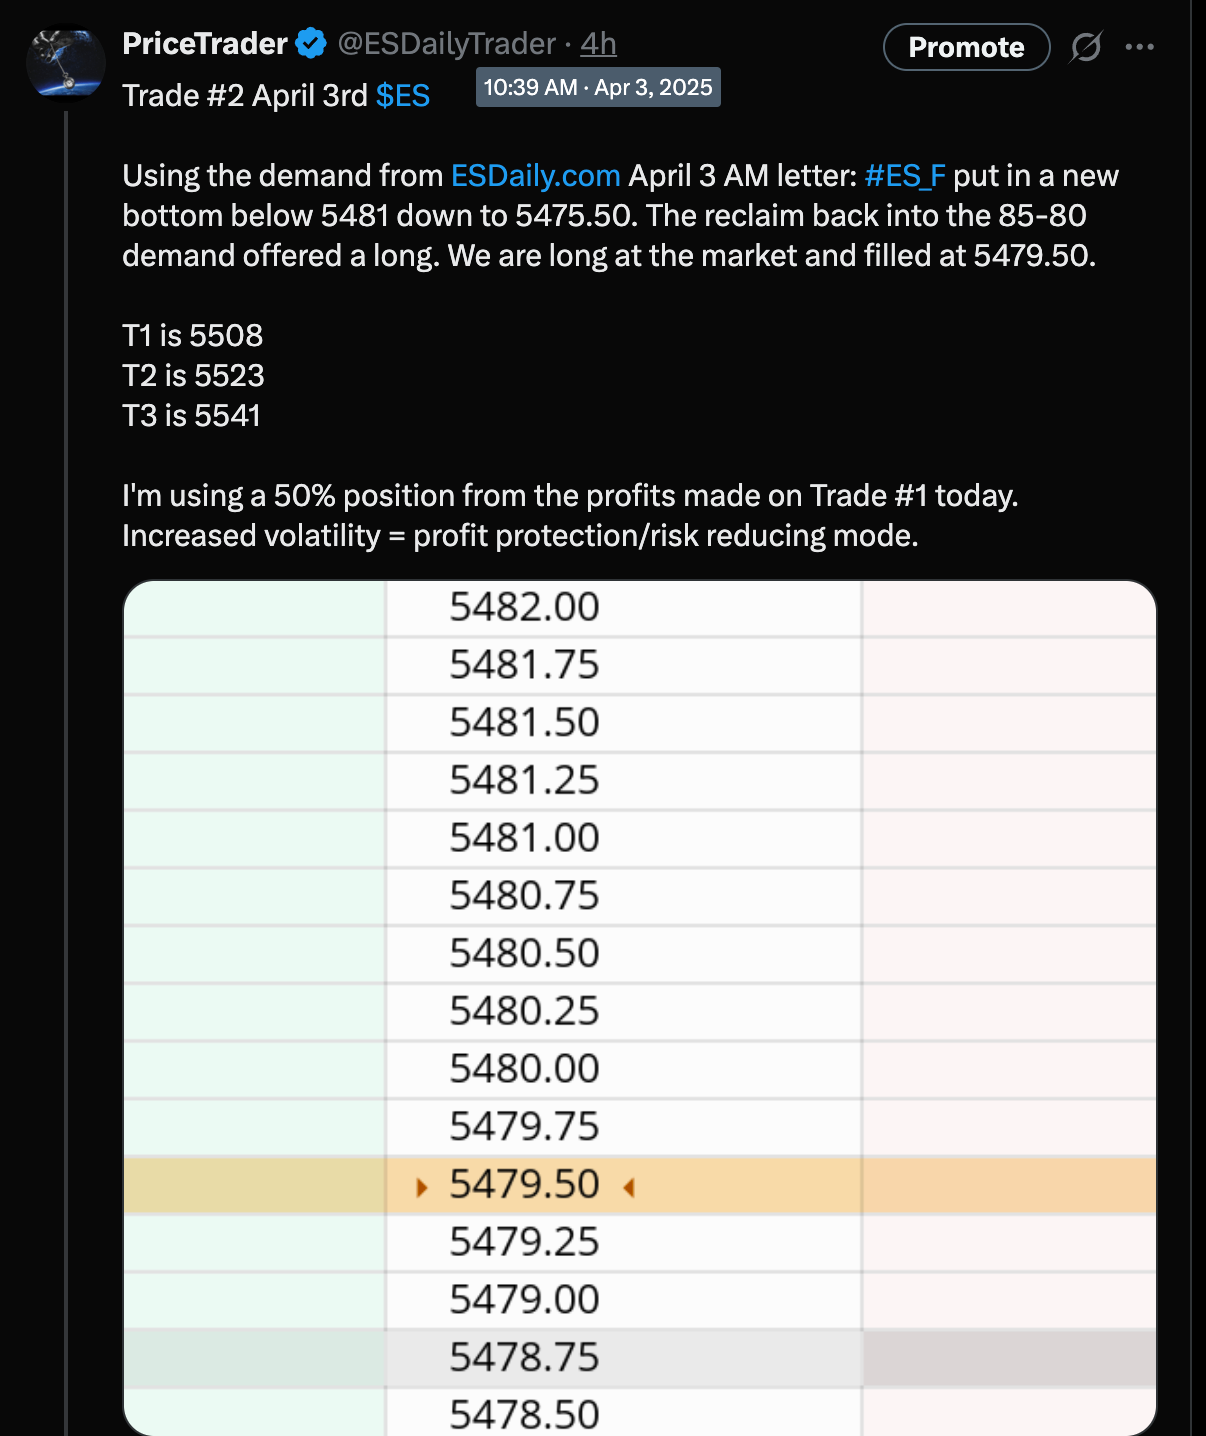
“The reclaim back into the 85-80 demand offered a long. We are long at the market and filled at 5479.50.”
Though it took longer than Trade #1, we hit T1, taking 70% by 12:04 PM.
I noted:
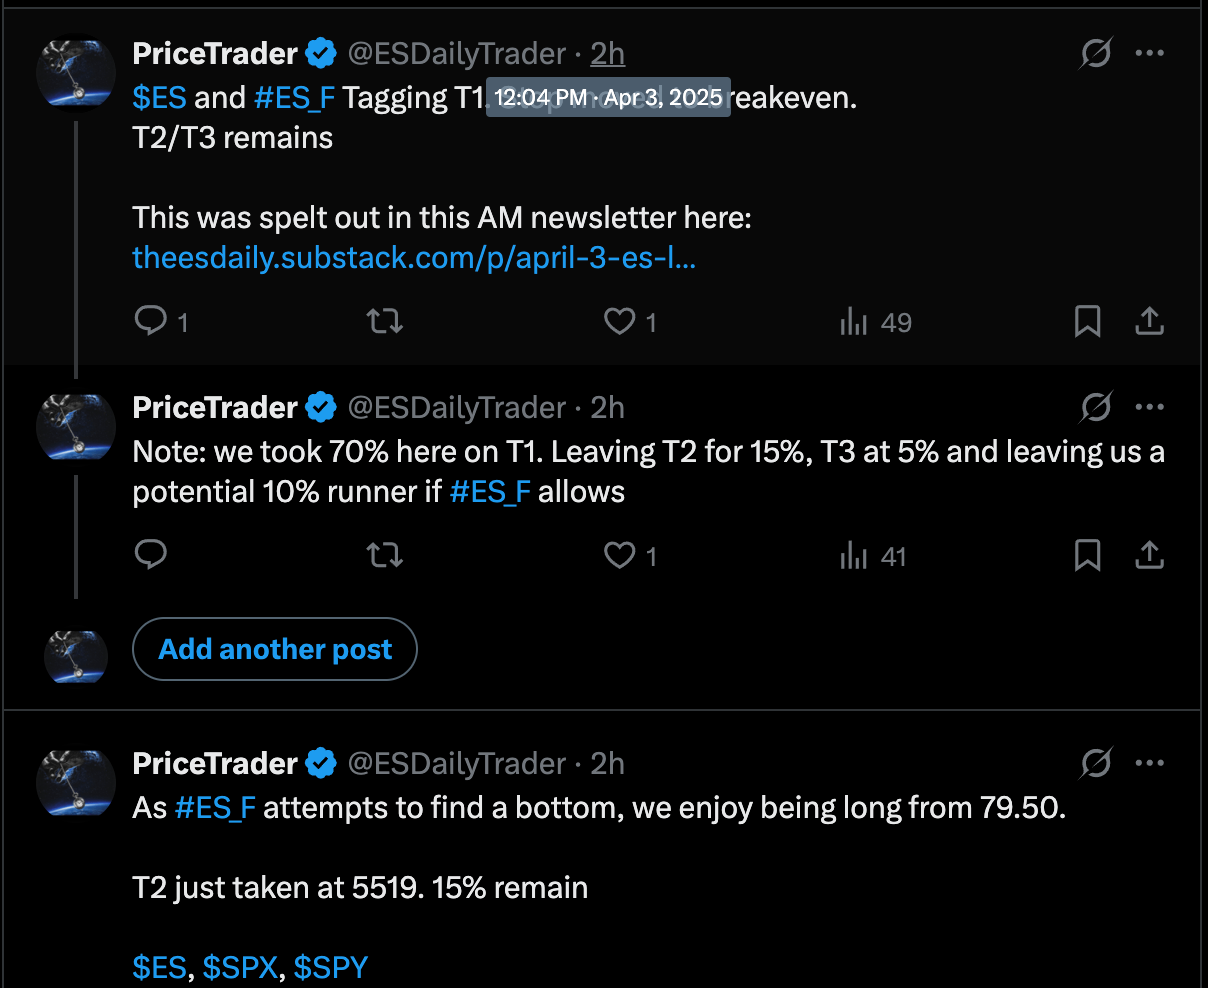
By 12:33 PM T2 was taken at 5519 (15%), and we ultimately came back and stopped out at 5480 on the remaining 15%.
By 1:30PM EST I was done trading for the day, and started piecing together this afternoon letter to give as much input as possible.
At 1:30PM, I wrote:

April 4th - 2 Trades
Trade#1 - 5230 LTB for T1, stopped at BE
Trade #2 - 5210 breakdown for T1&T2, stopped at BE
In the April 4 newsletter I wrote (after the selling commenced)
Every move is not an opportunity
People are fairly simple creatures when it comes to the following emotions:
Greed
Fear
Desire
Content
Hope
Despair
Anxiety
It is my purpose of ESDaily to eliminate all of those and trade using a system.
Our job isn’t to catch 300 points on the ES in a day like today.
Only take the Grade A+ setup ES offers a few times a day.
We need to take a PIECE of the action, not get all of it…
It is a system.
This preceded my opportunity section which said:
In terms of direct bid/asks
Above 5267/5327 offer a reclaim long. I’m not huge on knife catching, but we can look for price to find our support/demand areas, accept and buy on reclaims above the area.
A new low of 5210 offers a breakdown short. Remember, failed breakdowns make up a huge component of our trading strategy, but one could issue a sell direct on a breakdown from this area to the 5195 support.
Both worked.
April 7th - 2 Trades
Trade#1 - 4976 reclaim for T1, stopped out on remaining contracts
Trade #2 - 4875 LTB, T1 hit, T2 hit, 310 point runner stopped
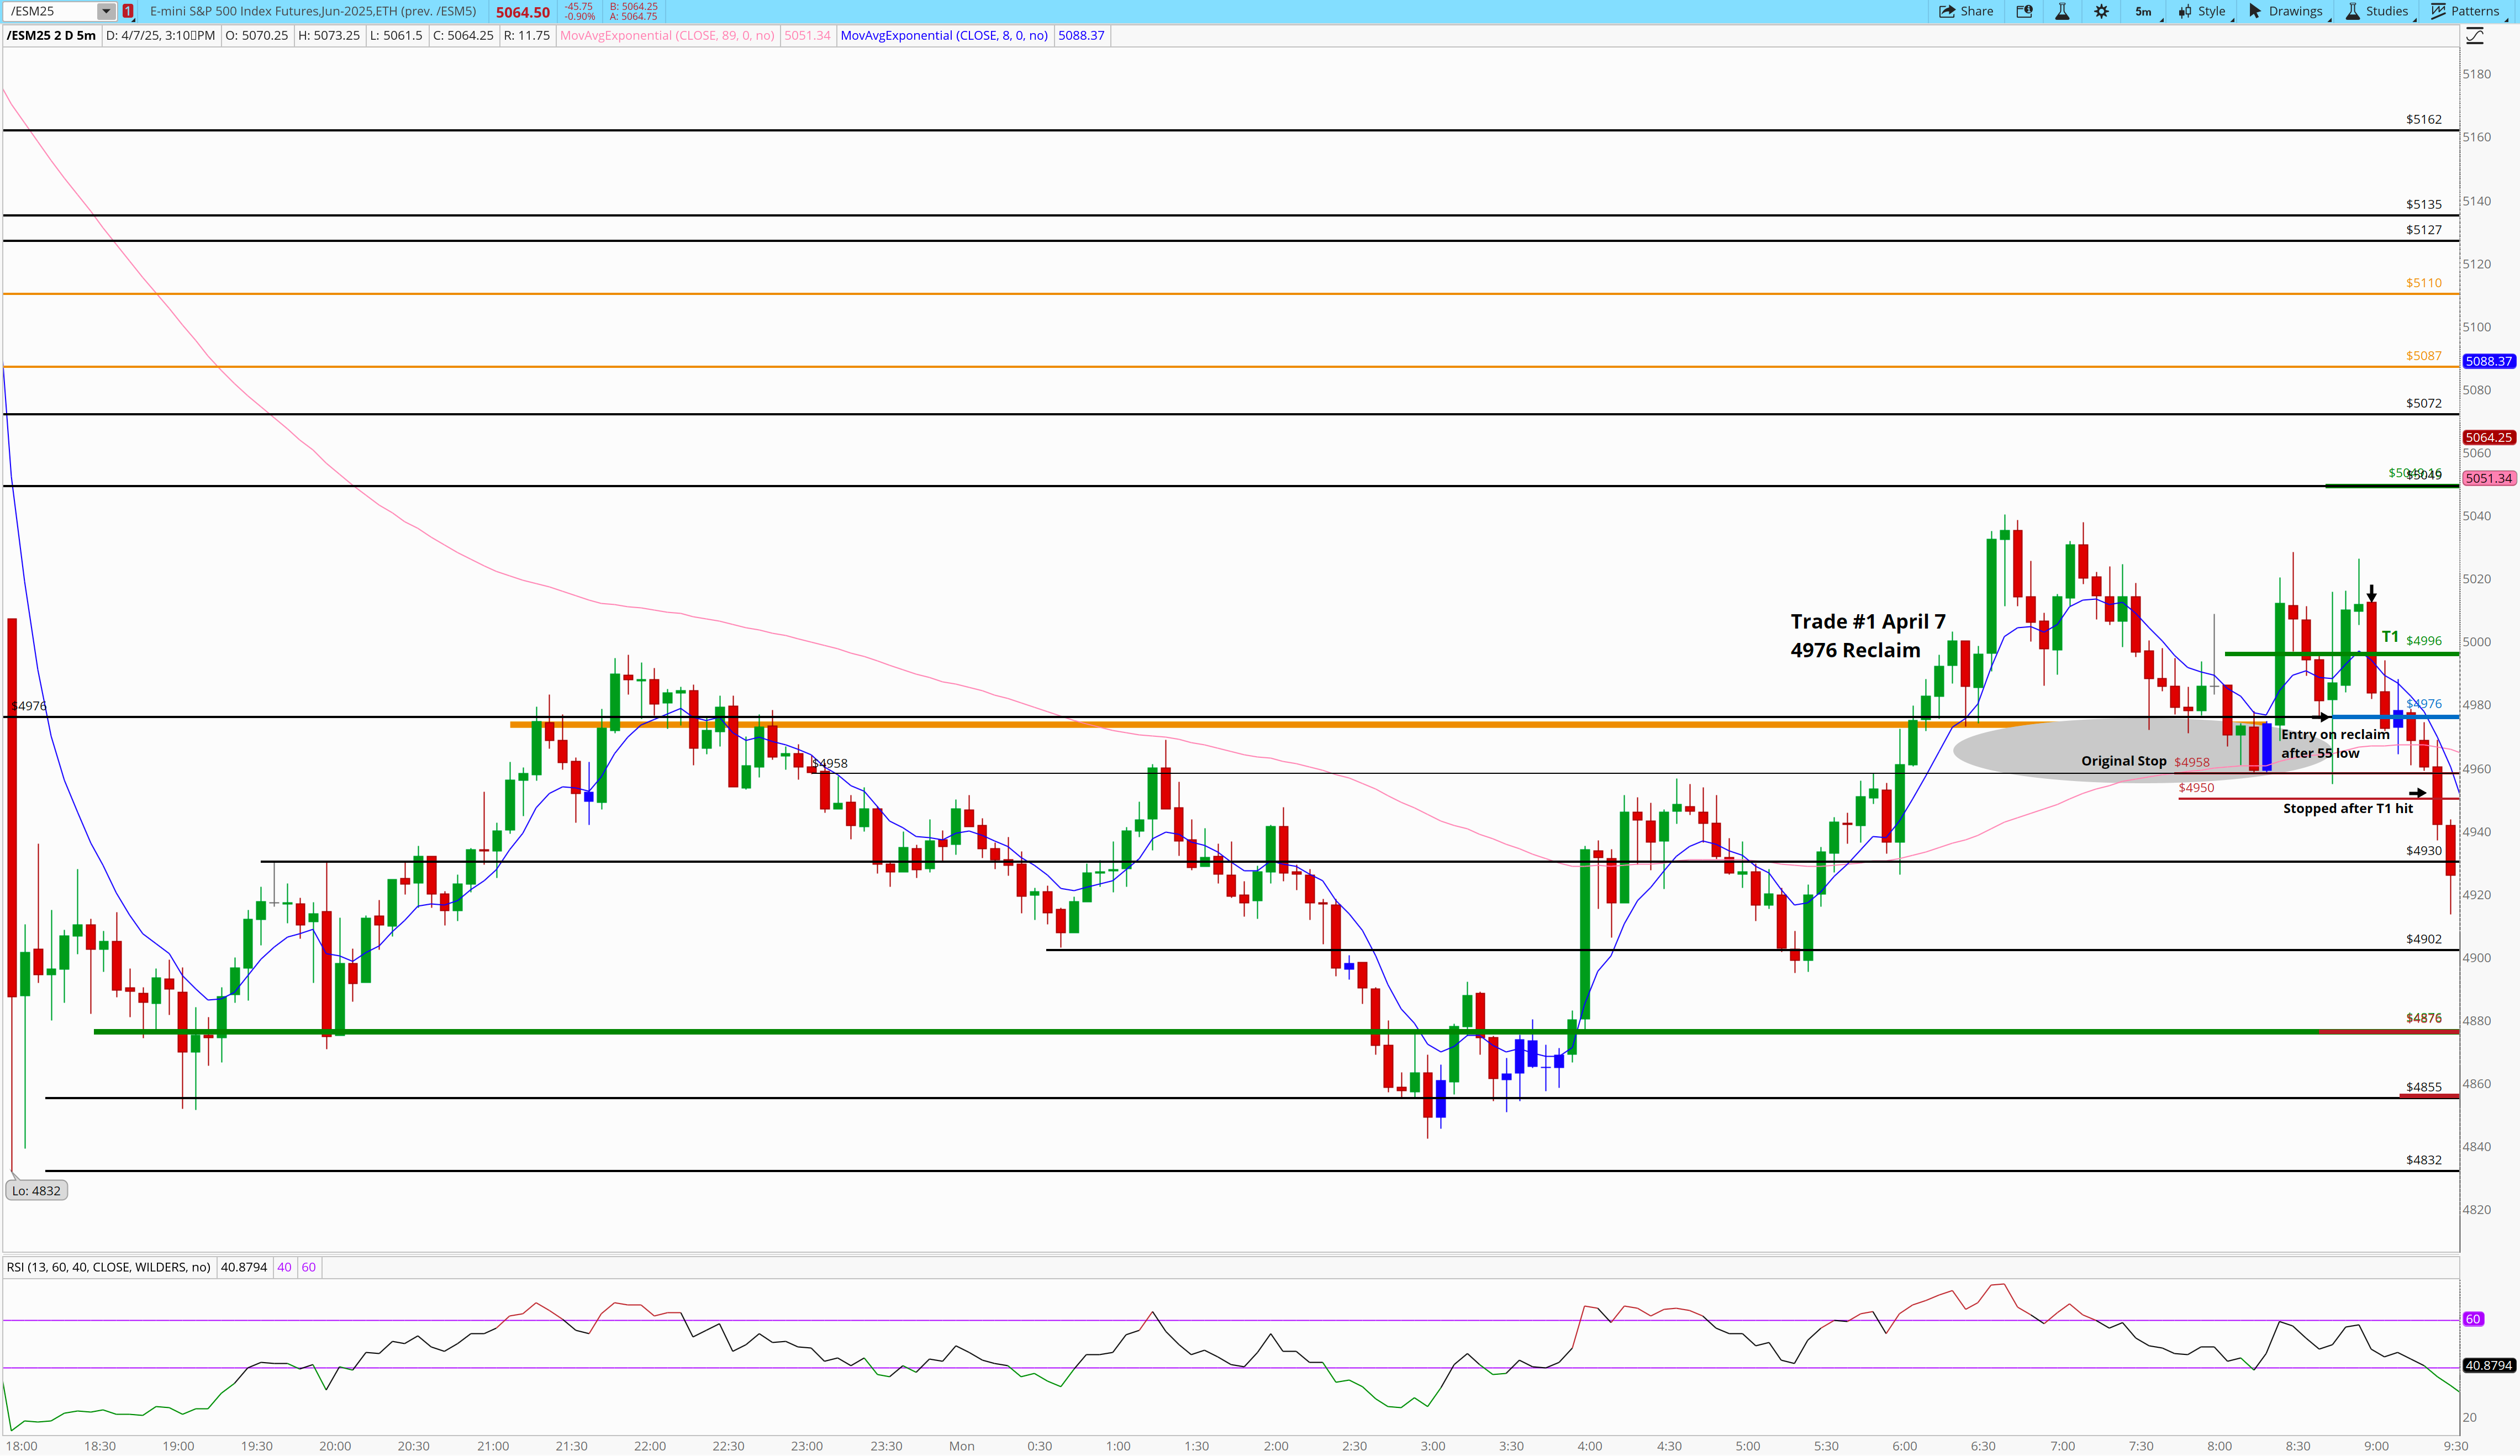
Trade#1 - 4976 reclaim for T1, stopped out on remaining contracts
Before the market did what it did yesterday on fake Tariff news, ES provided a great setup for a reclaim of the 4976 area.
You can see on the chart below price used 4976 as a bouncing point multiple times from the 6:30AM to 8AM time frame. Around 8:45 we flushed the support right to 4960 area marked on the 5:50AM high candle, turned and reclaimed the area. As we hit 4960 and reclaimed, I’d like to point out that momentum was on our side as we were above 40 on the RSI diverging from the 8:15 low. We had a small demand area, a previous high, a failed breakdown and very quickly, our T1 was hit 20 points above. We were already volatile before yesterday’s 9:30 move, so I decided to take 75% of the profits at T1. Price faded back on us, and ended up taking the loss on the remainder of the contracts. But the low risk opportunity gave us a great start to the day.
Here’s a picture of the trade for reference.
Trade #2 - 4875 LTB, T1 hit, T2 hit, 310 point runner stopped
Let’s start with the chart:
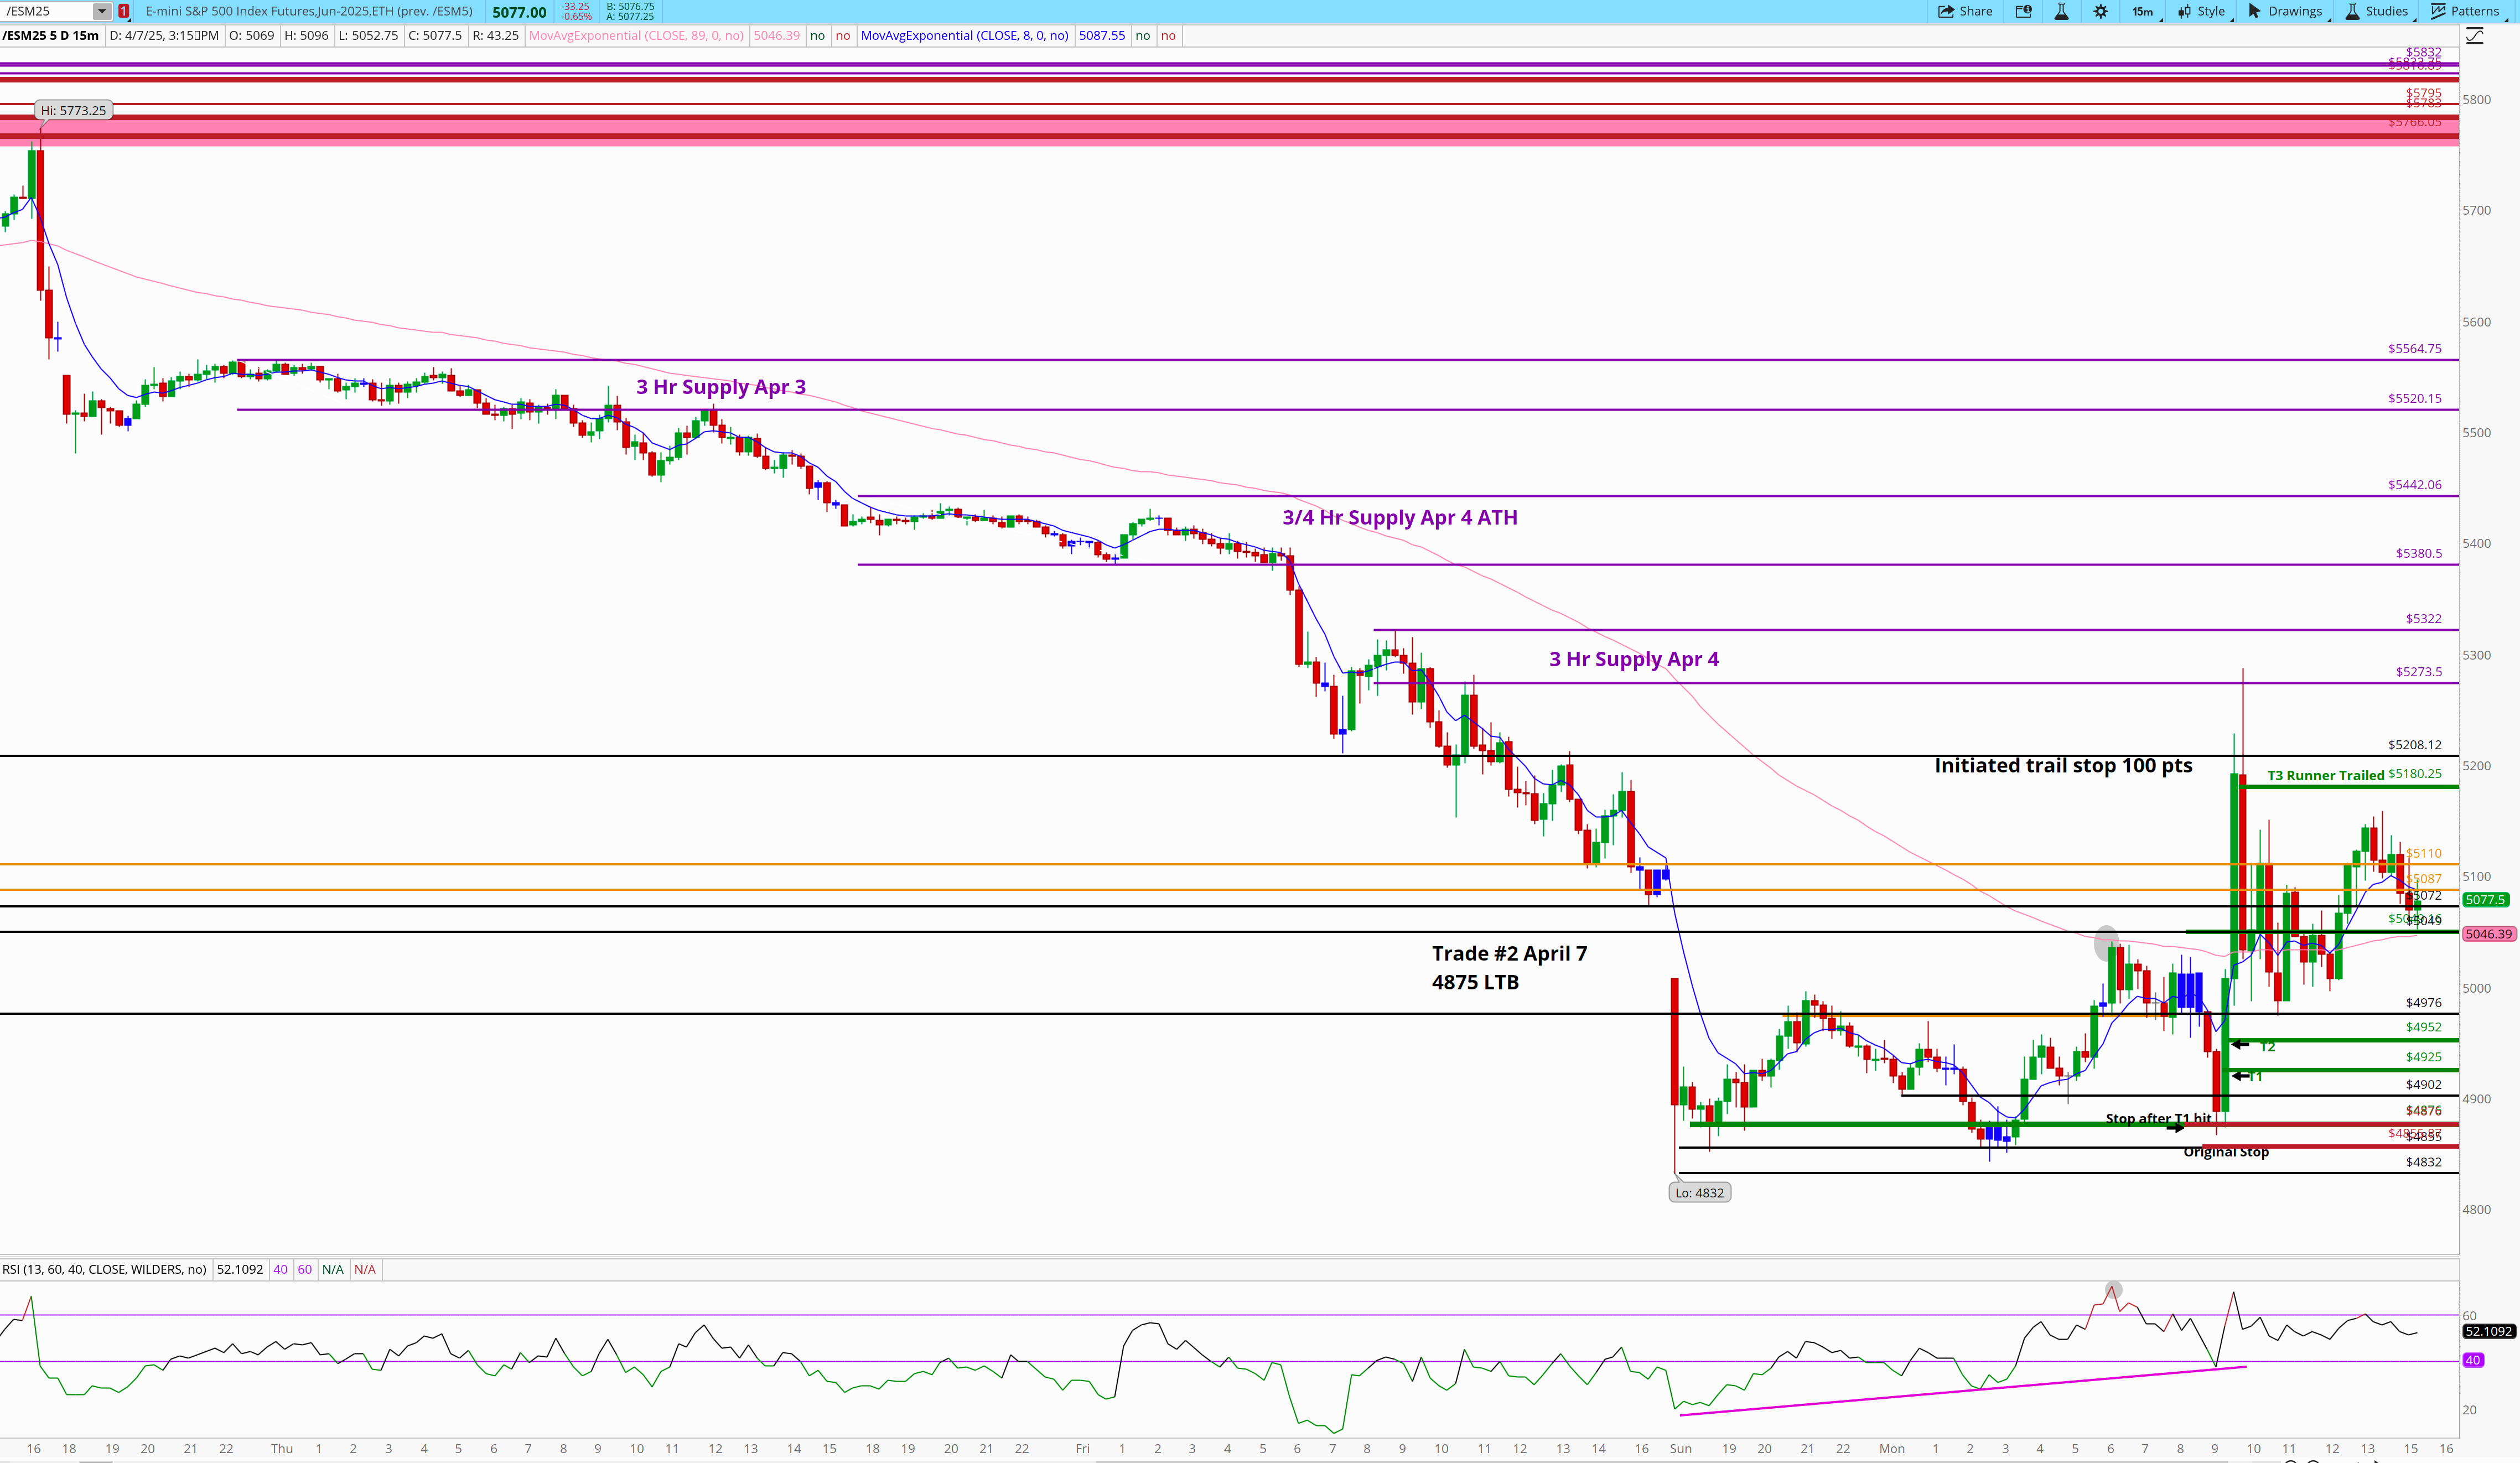
After Trade #1 was in the books I went to our newsletter from April 7th and found this:
Likely Supports For 4/7 are: 4875
This is the area from 2:30AM Monday morning that saw price attempt to fill the gap. It was the first time we saw higher lows, and higher highs. There was likely a second opportunity should we retrace back to that area.
I noted on X:
As we found those new lows, we ran right into this:
Likely Supports For 4/7 are: 4875
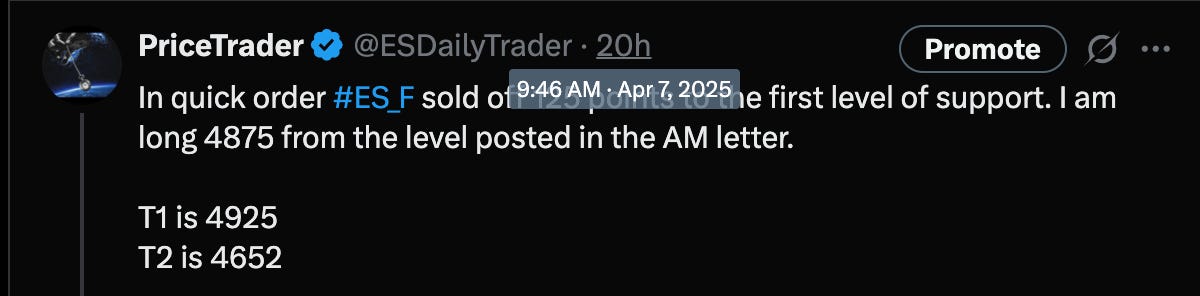
At 9:42 I entered into the trade and was filled at 4875.
T1 and T2 were hit within minutes and the rally of the year ensued. Within 45 minutes ES went from -4% territory to +3.5% territory. I took 75% off at the first target and in a risk reduction move, removed 20% off at T2. In anticipation of a violent move back, but not knowing how far, I placed a 100 point trail stop once we were up over 400 points. I was ultimately stopped on T3 100 points off the high.
Besides taking advantage of a level track-back (LTB), taking profits are pre-defined levels, and reducing risk… I’m not sure what else can be offered here.
We were on the right side of a crazy move.
Structure, rules, and luck came all together at once.
While Trade #1 and Trade #2 were done, I sat the rest of the day.
With so much volatility I didn’t want to give anything back. So I stopped trading.
I think there’s huge value in knowing when to walk away from the table. It’s not easy :) trust me. But I guess over the years, you learn going back in for more generally results in giving back some of your stake. I’m sure there were a few other great setups throughout the day. But, I was perfectly fine watching the crazy market swings, knowing I didn’t have that inherent risk to deal with.
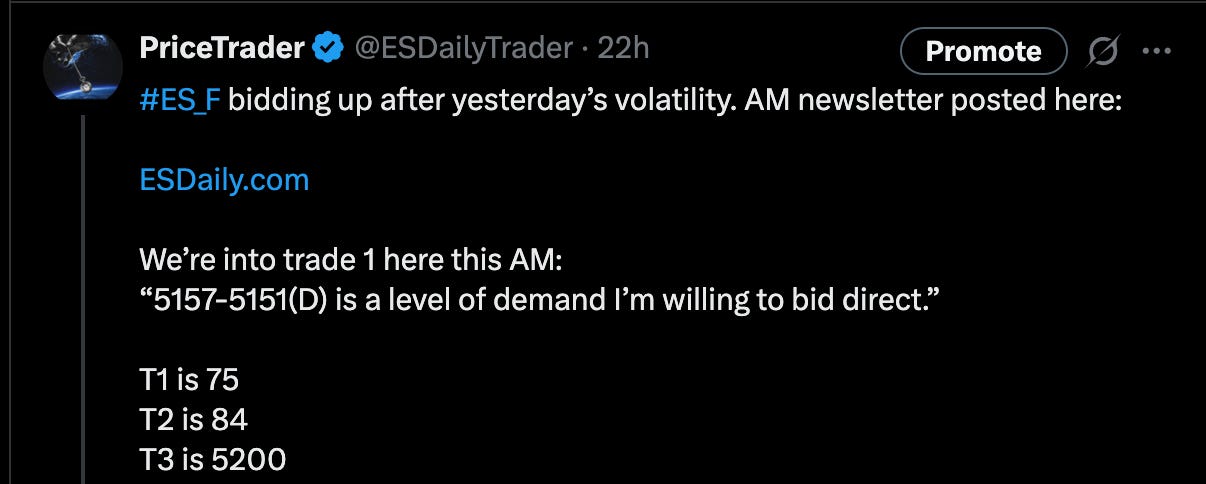
April 8th - 2 Trades
Trade#1 - 5155 LTB for T1, T2, T3 and runner stopped
Trade #2 - 4927.25 support +div, T1 hit, T2 hit, stopped at breakeven
Trade#1 - 5155 reclaim for T1, T2, T3 and runner stopped
In yesterday’s AM letter I wrote:
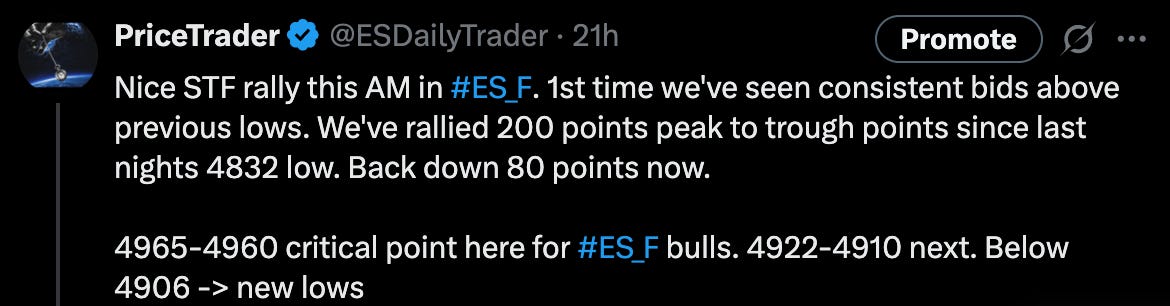
Likely Supports For 4/8 are: 5157-5151(D)…etc
In terms of direct bid/asks
5157-5151(D) is a level of demand I’m willing to bid direct. The level lines up nicely with the 6:45PM April 7th trend line as well giving us a bit on confluence.
Here’s a picture of the trade on a 5 minute chart for clarity:
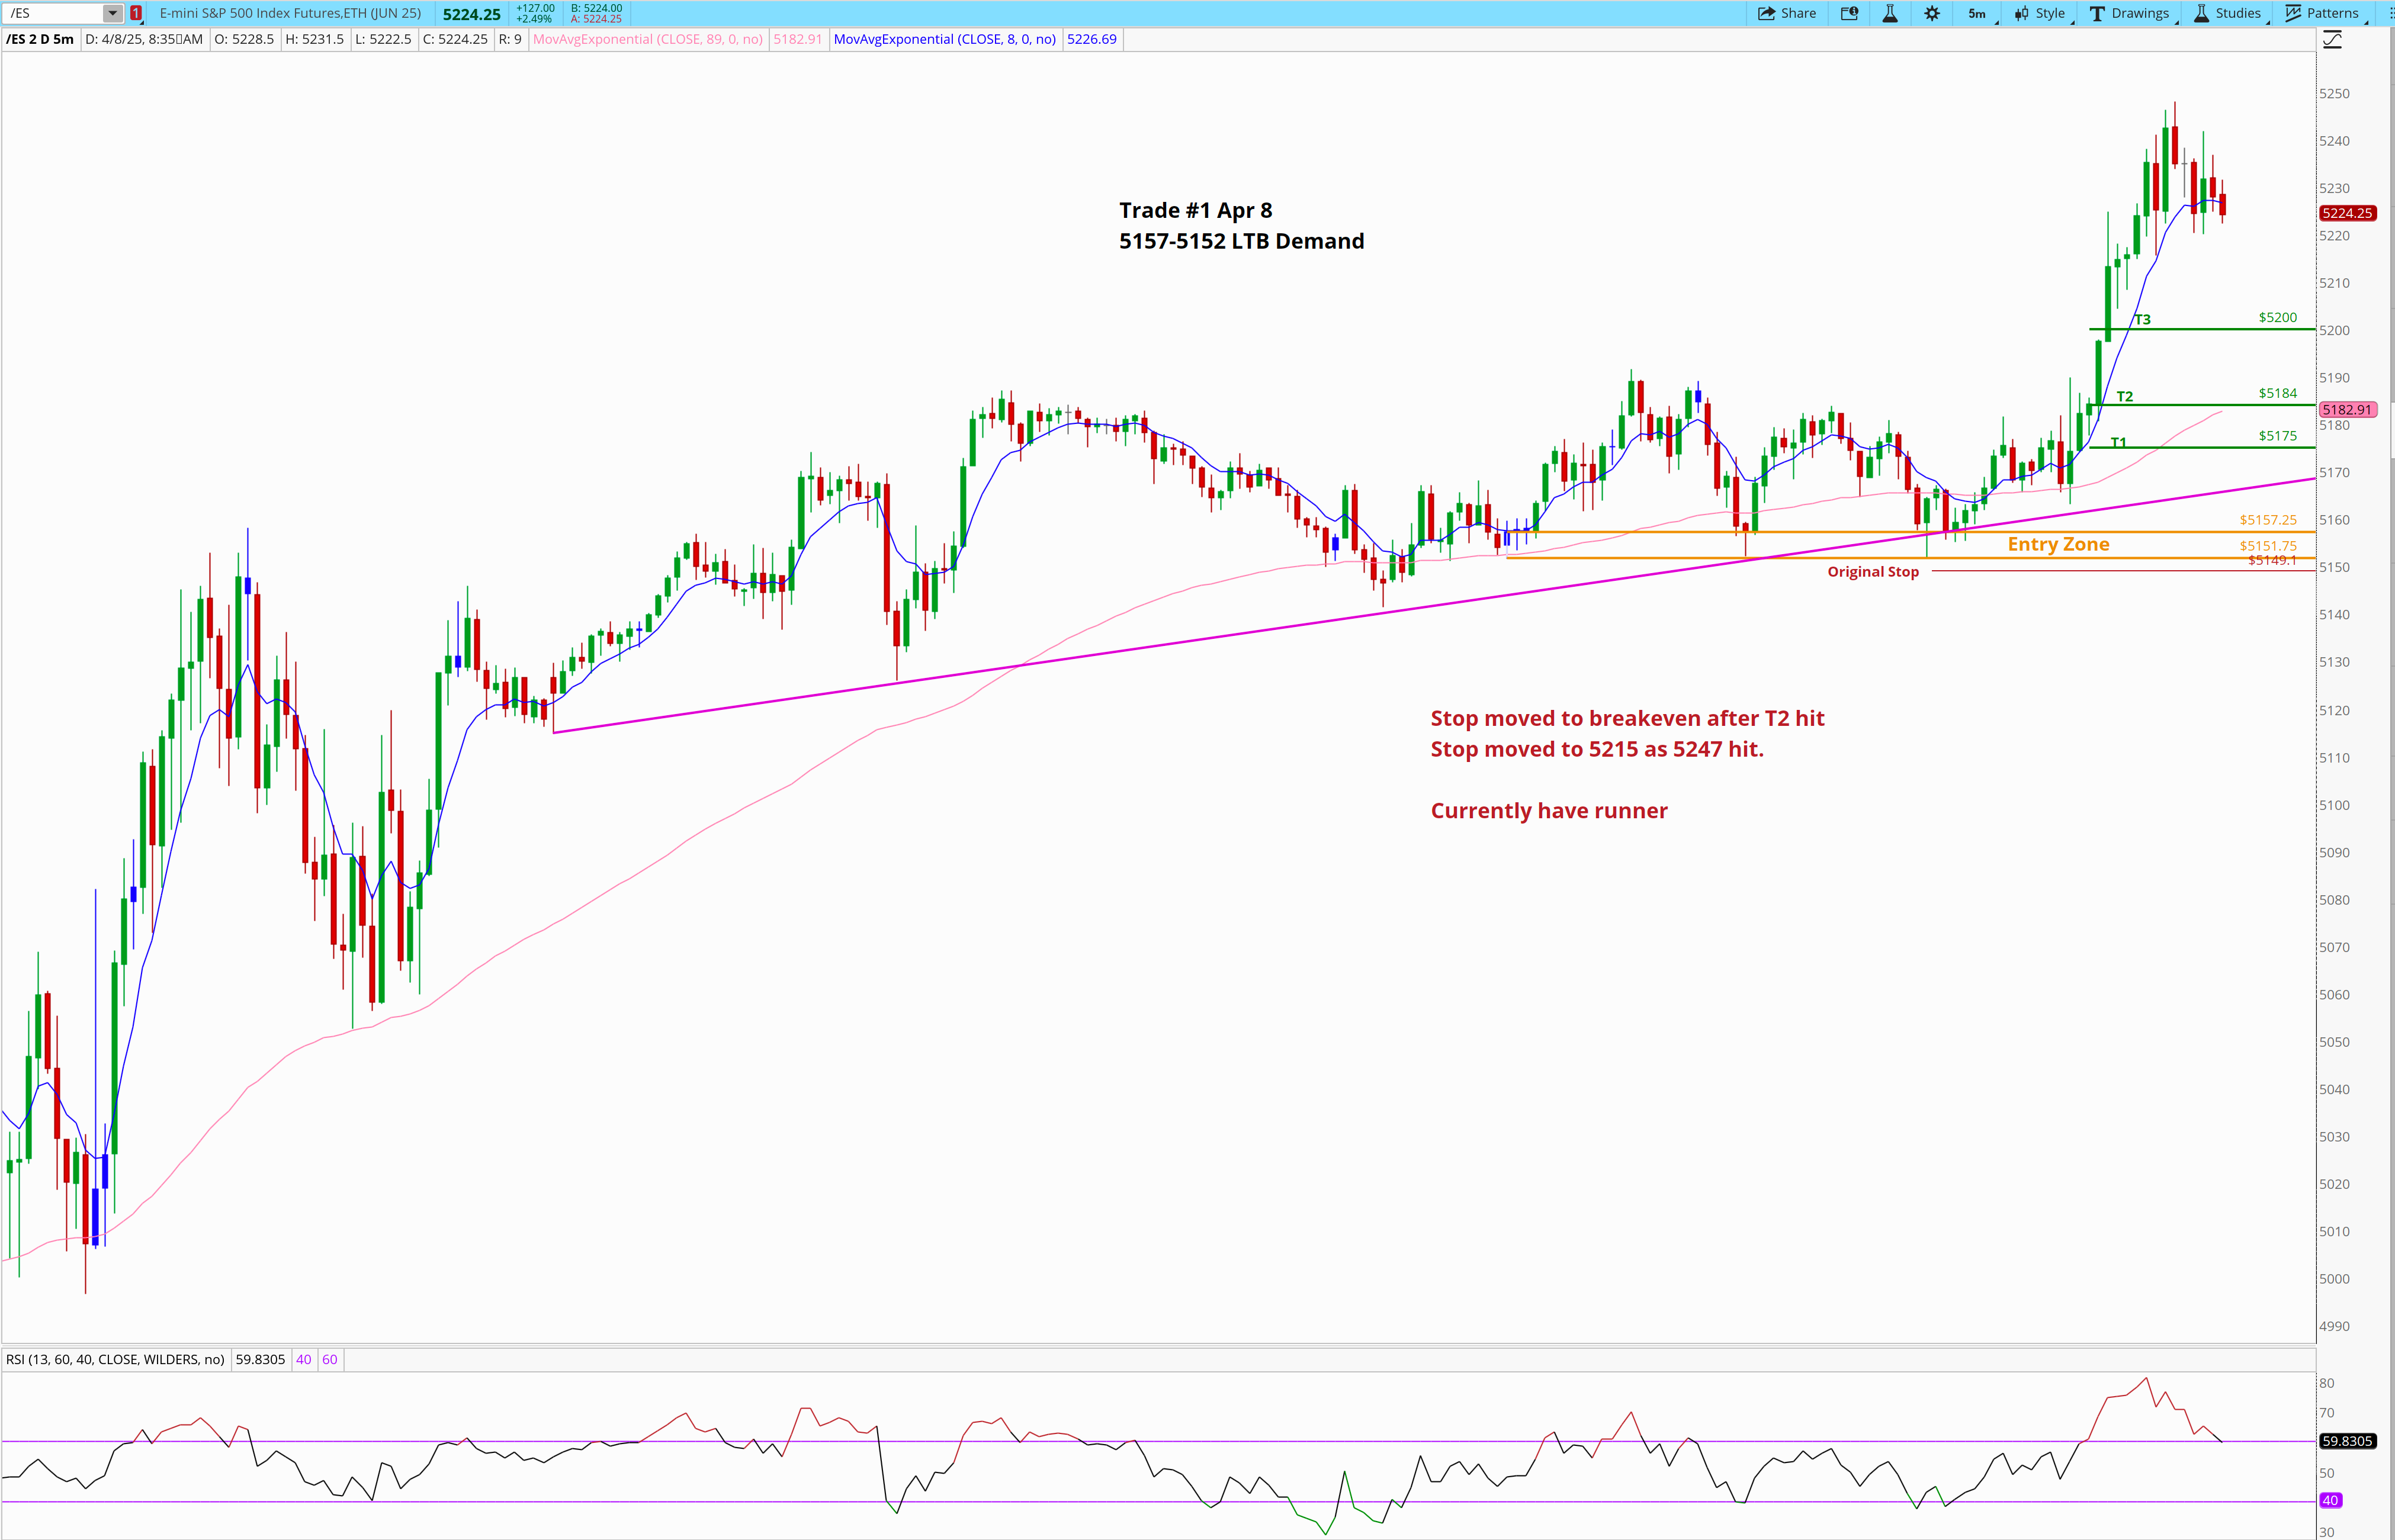
This was a clean, structured trade right out of the ESDaily core strategy. After the early session chop, we had a clear rising trendline holding from prior sessions, overlapping perfectly with a well-defined demand zone between 5157 and 5152.
I noted on X:
It was textbook LTB (level track back) behavior—price pulled into the zone, held, and began coiling for a move higher.
We were coming off heavy volatility, so I wanted to be patient and let price show its hand. Once we pushed into the entry zone and started defending that structure, I got long with the stop just below the zone. The risk was minimal here. No guesswork. Just levels and structure doing their job.
T1 at 5175 gave a quick partial, and T2 at 5184 gave us the greenlight to move stops to breakeven. That’s risk-off trading. After testing the upper range at 5190, we came back 15 points, before an 80 point rally took us into 8AM. T3 was hit at 5200 along the way. I trailed my stop up as we were in heavy profit protection mode.
You can see the notes here at 7:54AM I wrote:

At 8:04AM I wrote:

And finally I wrote this at 8:14AM:

The divergence pulled us back, stopping us out before the market rallied to 5305. Then sold off hard.
The best trades don’t chase. They wait. This one lined up with trend, structure, and momentum. All I had to do was trust the zone, manage the risk, and follow the plan.
The Rest Of The Day I Sat
There’s nothing soft about doing nothing.
After locking in the morning win before 8:30AM, I sat out the rest of the session—and I’m glad I did. ES ripped to 5305, then tanked all the way to 4940 by 4PM. That’s a 365-handle round trip that looked exciting on the surface but was chaotic under the hood. No structure. No clean risk. Just pure chop wrapped in volatility.
I wrote this yesterday during the downward move:
And that’s the point. The stairstep down never caught legs until the last 5 minutes of the day where it eaked a 97 point rally (that failed).
Plenty of traders got chewed up trying to “do something” in that noise. But one of the most powerful moves you can make in this game… is no move at all.
I didn’t see anything that met the criteria. No clean LTBs, no tight risk setups, and plenty of exhaustion signals flashing after the morning squeeze. So I protected the gains. I stayed flat. I waited.
That’s discipline. That’s a strategy. That’s how you keep your edge.
It’s not always about pressing. It’s about preserving. Let the market come to you. If your system says sit—sit.
You don't get paid for action, you get paid for execution.
Trade #2 - 4927.25 support +div, T1 hit, T2 hit, stopped at breakeven
This one came late in the evening as price finally drifted into the support zone I highlighted in yesterday’s newsletter. I had alerts set in advance, and as we hit 4926, the same level listed in the April 8 gameplan, the setup came into focus.
I highlighted this are in yesterday’s newsletter saying:
Likely Supports For 4/8 are: 5157-5151(D), …., 4926
All day long we had nothing but sell pressure. But into the overnight session, we finally got something different: RSI divergence and the first higher high that closed above 40 on the RSI. That was a key signal. Buyers hadn’t shown any life up to this point, but now there was a reason to engage—right into a level I had been watching for 24 hours..
I wrote on X:
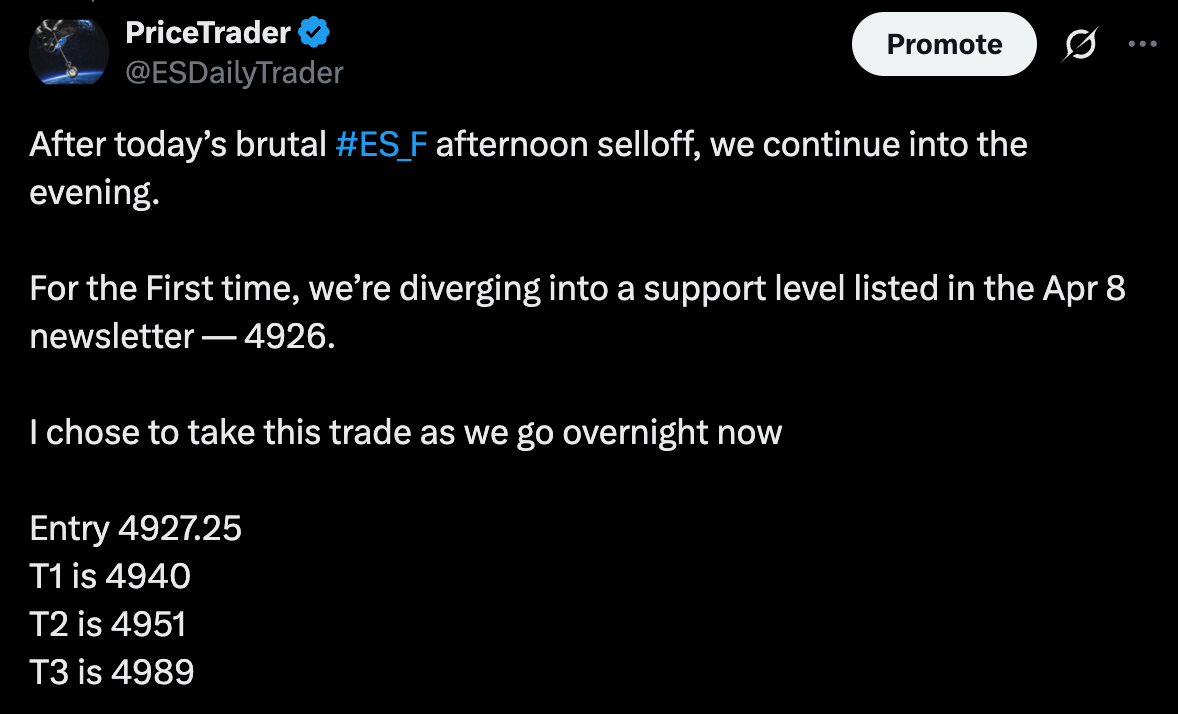
I also sized the trade intentionally small—risk was tight, and I wanted to be able to sleep through the night without staring at the screen. This was about structure and discipline, not hero trading.
T1 and T2 hit quickly, and with risk off the table, I moved the stop to breakeven and let the rest work. The runner didn’t make it to T3, but a clean 24 points to T2 was more than enough given the choppy, fast-moving backdrop we've been dealing with lately.
In a week full of 100+ point moves, this one might look small on paper—but it followed the plan, respected the level, and delivered exactly what I look for: defined risk, level-based entry, and scale-outs into strength.
April 9th - 1 Trades
Trade #1- 4969 Reclaim. T1/T2/T3/T4 hit. Remaining stopped after move up and pullback.
Detailed out above.
Let’s get into today’s levels and setups.
Don’t go seeking more action unless it fits the plan.
We need to take a PIECE of the action, not get all of it.
…Remember, we may just be provided 1 or 2 great opportunities a day. We don’t need multiple.
If we nail it, cool.
If we miss it, cool.
Our job is to identify opportunities before they happen, and then execute.
So where does the next "piece” come in as opportunity?
Critical Areas-
Below are ES levels I’m watching for Thursday April 10
Note: After yesterday’s record breaking moves these support/resistance and demand/supply areas need multiple confluences. They will be wider and fewer than normal to account for the (yes) additional volatility yesterday brought us. I will still likely not be direct bidding, not short selling, but waiting for Grade A+ failed breakdowns.
Support/Demand- Support is not the same this as demand. Demand is high quality institutional levels we can see on the chart. While we seek demand, we may find opportunities for longs using support/magnet levels. We can find “subprime” areas of opportunity that price may use as bouncing points. We always want to ensure momentum is on our side in this case. In the section below, you’ll see areas of interest. If I consider them Demand, you’ll see a (D) followed by price.
Likely Supports For 4/10 are: 5388, 5365, 5341, 5313, 5300-5296, 5275, 5248, 5232, 5222 -5211, 5196, 5189, 5167, 5143, 5130, 5101, 5093
Resistance/Supply- Supply is not the same this as resistance. Supply is high quality institutional levels we can see on the chart. While we seek supply, we may find opportunities for shorts using resistance/magnet levels. We can find “subprime” areas of opportunity that price may use as bouncing points. We always want to ensure momentum is on our side in this case. In the section below, you’ll see areas of interest. If I consider them Supply, you’ll see a (S) followed by price.
Likely Resistances For 4/10 are: 5417, 5422, 5442, 5450, 5461, 5496, 5507, 5523, 5533, 5548, 5571, 5588, 5599, 5612, 5647, 5673
In terms of direct bid/asks
After yesterday’s record breaking moves these support/resistance and demand/supply areas need multiple confluences. They will be wider and fewer than normal to account for the (yes) additional volatility yesterday brought us. I will still likely not be direct bidding, not short selling, but waiting for Grade A+ failed breakdowns. 5358 looks like the first available failed breakdown potential. But on a day like yesterday, it wouldn’t be “abnormal” to see a big sell day. We would want to wait for acceptance before we real breakdown turns into a failed one. 5305 also offers a failed breakdown potential is selling gets going, as Tuesday’s high is a level bears would target. Same thing. Wait for structure to finalize. No knife catching here.
More so than ever: follow our rules, protect our capital, size risk accordingly, take profits when they’re due, and only take Grade A+ setups
We’ll have to wait and see what price delivers today
As always, stick to the plan.
Trade like a Robot, let’s make it a great Thursday
-PT
How do I get access to your moves during the day? On here or twitter?