
ES Daily's Core Strategy
This is how we do what we do and a "must read" for new subscribers.

How I Trade, Why It Works, and Why I Stick to It
Welcome to the foundation of ES Daily. If you’re new, read this first. If you’re seasoned, read it again. This is how we find high-probability trades, protect our capital, and stay consistent.
This is not a motivational pep talk. It’s the mechanical engine that runs my trading—and it should run yours too.
We don't chase. We wait.
We don't predict. We react.
We don’t overtrade. We position for Grade A setups.
This entire strategy revolves around three core drivers as price is inside structure:
Trend
Levels (LTBs and FBDs)
Momentum (via RSI and divergence)
Make It Boring
Trading works when it’s systematic. This strategy is built to function like a machine:
Input: Levels, trend, momentum
Output: Executed trades, clear targets, defined stops
No guessing. No gut feels.
If we follow it mechanically, it works. If we deviate, it doesn’t. Simple.
Why Most Traders Fail
Because they don’t have a plan—and if they do, they abandon it the moment emotions show up.
Our mission is to become robotic. Emotionless. Process-driven. It’s the only edge that lasts.
Understanding Structure & Liquidity
The ES doesn’t move randomly. It moves with purpose—even if that purpose is to trap traders and seek liquidity.
Most major moves begin from areas of imbalance, where buyers or sellers overwhelmed the other side. These areas become our key zones of structure—defined visually by:
Bases (consolidation or “rest” zones)
Impulses (strong directional moves away)
Breakouts or breakdowns (clear level violations)
These structure zones are where institutions leave footprints. Price often returns to these levels—not out of kindness, but to fill unfilled orders or seek liquidity.
Liquidity-seeking behavior shows up in:
Sharp flushes through multi-tested levels (stop hunts)
Sudden reclaims of those levels (failed breakdowns)
Price grinding toward an obvious high or low before reversal
We’re not trying to predict it—we’re waiting for it to show itself on the chart.
Structure tells us where. Liquidity behavior tells us when.
1. Trend – Our Context Anchor
"The trend is your friend" still holds up—if you understand timeframe context.
I define an uptrend as a general series of higher highs and higher lows. I define a downtrend as the opposite - and I use the 15 min/ 45 min/ and 4 hour charts as reference.
I do not use RSI like most, to look at 70/30 and fade. I use it as an odds enhancer and to confirm.
RSI helps confirm strength:
Uptrend may be weakening if:
Price fails to make a new high
There’s divergence into supply
RSI prints a high under 60
Downtrend may be weakening if:
Price fails to make a new low
There’s divergence into demand
RSI prints a low above 40
Trend is always relative to timeframe. A 15-minute trader should use a 45 or 60-minute chart for trend. A 5-minute chart doesn’t matter to an hourly swing.
2. Price Structure: Repeating Patterns = Opportunity
Markets are messy, but human behavior isn’t. Fear, greed, and liquidity-seeking create repeating structures in ES that we can trade mechanically.
In all my years as as a trader, I’ve found humans are simple creatures, and make the same mistakes over and over.
These mistakes lead to repeated behavior.
Candles are simply human emotion printed on the chart.
ES moves wildly, taking the most complex path to its destination. But, along the way to price’s destination, it continuously offers traders several “repeating patterns”. These repeated patterns are the outcome of human behavior, and institutional bidding or offering that takes place. Our objective is to identify these patterns, stack the odds in our favor, make the trade, then do nothing except adhere to our profit taking procedures.
Core Setups – The Only Two That Matter
Every trade comes from one of these:
A. Level Trackbacks (LTBs)
LTBs are institutional footprints. A level trackback (LTB for short) is our core strategy and one where we look for areas of institutional buying or selling that has already displayed itself on the chart.
Often times price consolidates for a period of time and then moves away from the consolidation phase.
We want to be buyers or sellers when price re-approaches and shows respect of this consolidation phase so long as the consolidation and subsequent impulse is in the same direction as the trading trend.
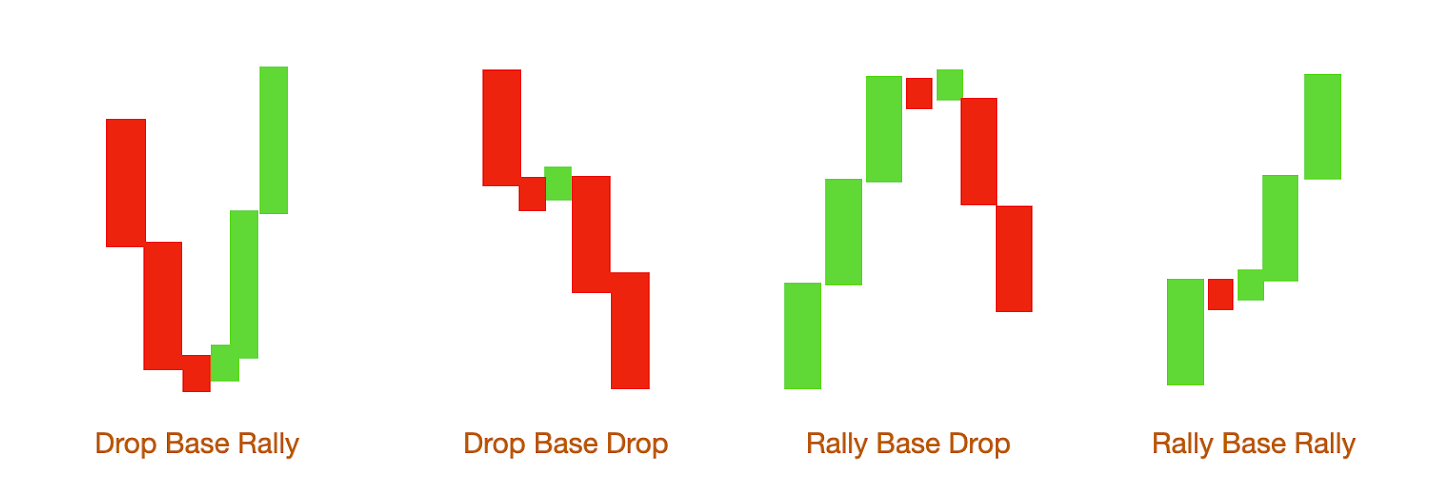
The consolidation phase used in LTB’s displays itself via 4 main patterns
Price pulls back to a previously established rally-base-rally, drop-base-drop, or other impulse zone and respects it—in the direction of trend.
When they work:
The level is fresh (untested)
The impulse away was strong
The level broke a prior high or low
The current move aligns with higher timeframe trend
These patterns represent imbalances in buyers and sellers.
The levels are clearly laid out for us, an obvious point of breakout or breakdown, with large moves in the direction of trend that follow thru.
If you look at a chart it’s very easy to see hundreds of patterns like this. But it’s critical to note, not all levels are created equally.
Inside the daily Gameplans and resources we discuss quality of levels and which ones matter and which ones don’t.
B. Failed Breakdowns (FBDs)
Failed breakdowns are a core component of ES. ES is the most widely used financial instrument used by professionals and by nature, it seeks liquidity.
Failed breakdowns happen when price flushes below a well-tested support, finds fresh demand, then reclaims the breakdown zone and reverses sharply, this preferrably near the lower bounds of structure.
It’s a trap. A fakeout. And a gift—if you’re patient.
It does this by breaching a previously multi-tested support area, running into a second level support, and reclaiming the original area.
It may be best to show you a trade I took Thursday, February 13th to explain a failed breakdown.
Checklist:
Multiple prior touches at the level
Flush below the level
Clear reclaim
Ideally, divergence or reversal off second-level demand
FBDs are about timing the reclaim—not the flush.
They aren’t about buying knives, they’re about buying once price has accepted a low.
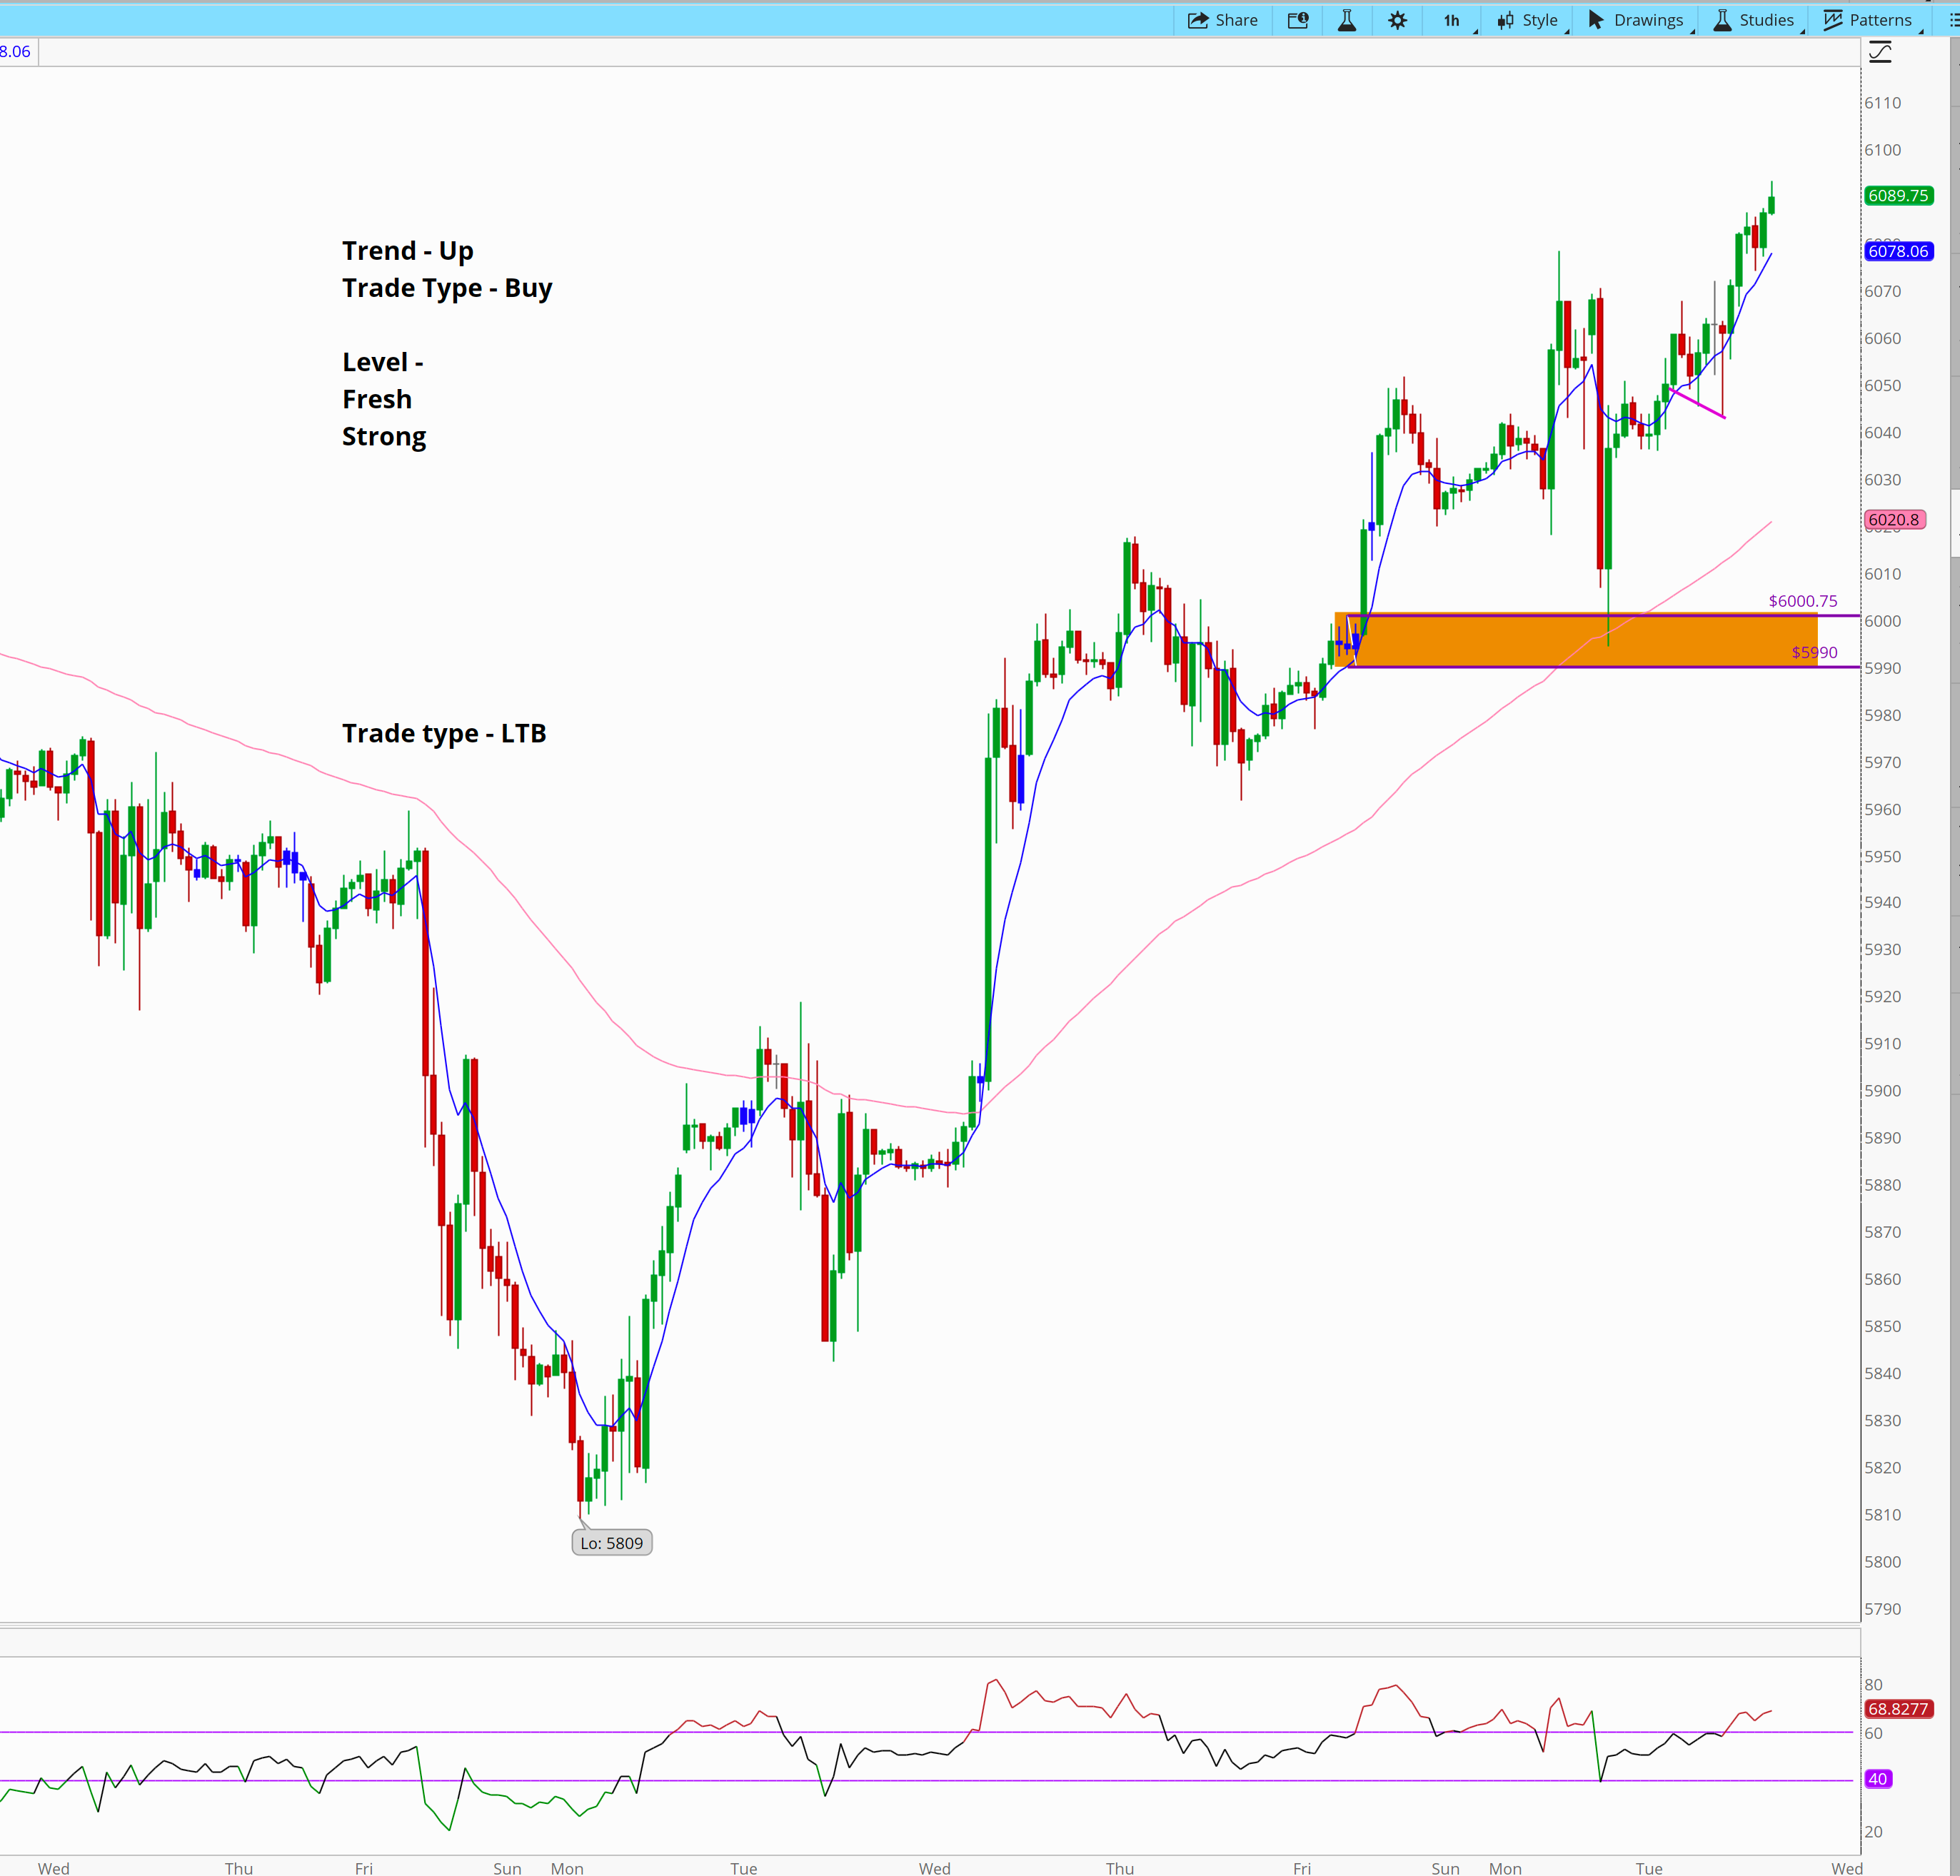
Here’s the chart:
Observations from the Chart:
Critical Support/Resistance Area – 6066:
This level has acted as both support and resistance multiple times.
A flush below 6066 occurred around 4AM, likely triggering stop losses (of all 6066 traders)
Rally-Base-Rally (RBR) Formation:
Around the 6056-6060 zone, a demand area formed Wednesday February 12th at 10AM where price rallied paused and broke to 6087.
This indicates buying interest in this range.
Reclaim of 6066 and Strong Uptrend:
After price flushed 6066 we ran in 6056, went just below, stabilized, and buyers stepped in aggressively, leading to a strong breakout.
This reclaim and bounce suggest institutional buying or strong demand.
The reclaim is indicative of a failed breakdown and we buy upon the reclaim.
I could write more words to describe failed breakdowns but this picture is worth 1000 words.
Failed breakdowns represent ES seeking liquidity, flushing support, wiping out retail, running into demand, reclaiming initial support, and getting retail chasing back in.
In the newsletter we’ll discuss these opportunities as I’ve found ES offers just a few of these trades day.
3. Momentum – The Confirmation Tool
Momentum is measured with RSI, but not how retail traders use it. Typical traders use an overbought measurement of 70 and oversold measurement of 30 as a reading on the RSI
We use 60/40—not 70/30. That means:
In strong uptrends, RSI pullbacks rarely go below 40
In strong downtrends, RSI rallies rarely go above 60
If RSI breaks those zones, the trend may be fading.
Rules:
If you’re buying and RSI is under 40, your level probably won’t break out
If you’re selling and RSI is above 60, your level probably won’t break down
RSI is never a standalone entry—only confirmation
4. Divergence – The Odds Multiplier
Divergence boosts the setup, but doesn’t replace the setup.
Positive divergence: Price makes lower lows, RSI makes higher lows → bullish shift
Negative divergence: Price makes higher highs, RSI makes lower highs → bearish shift
Combine this with a good level and trend, and you’ve got something worth taking.
Rule #1
When buying
If RSI approaches a “level” that we’ve determine price is likely to turn and the reading on the indicator is less than 40, the likelihood of the level working falls dramatically
In general, price is likely to fall through or breach areas when the RSI is below 40
When selling
If RSI approaches a “level” that we’ve determine price is likely to turn and the reading on the indicator is more than 60, the likelihood of the level working falls dramatically
In general, price is likely to exceed current levels at areas when the RSI is above 60
Rule #2
RSI is not a good indicator of where price is going all by itself. Never make a trade with RSI alone.
Rule #3
RSI is only to be used at quality demand and supply zones as entrances or critical areas for exits.
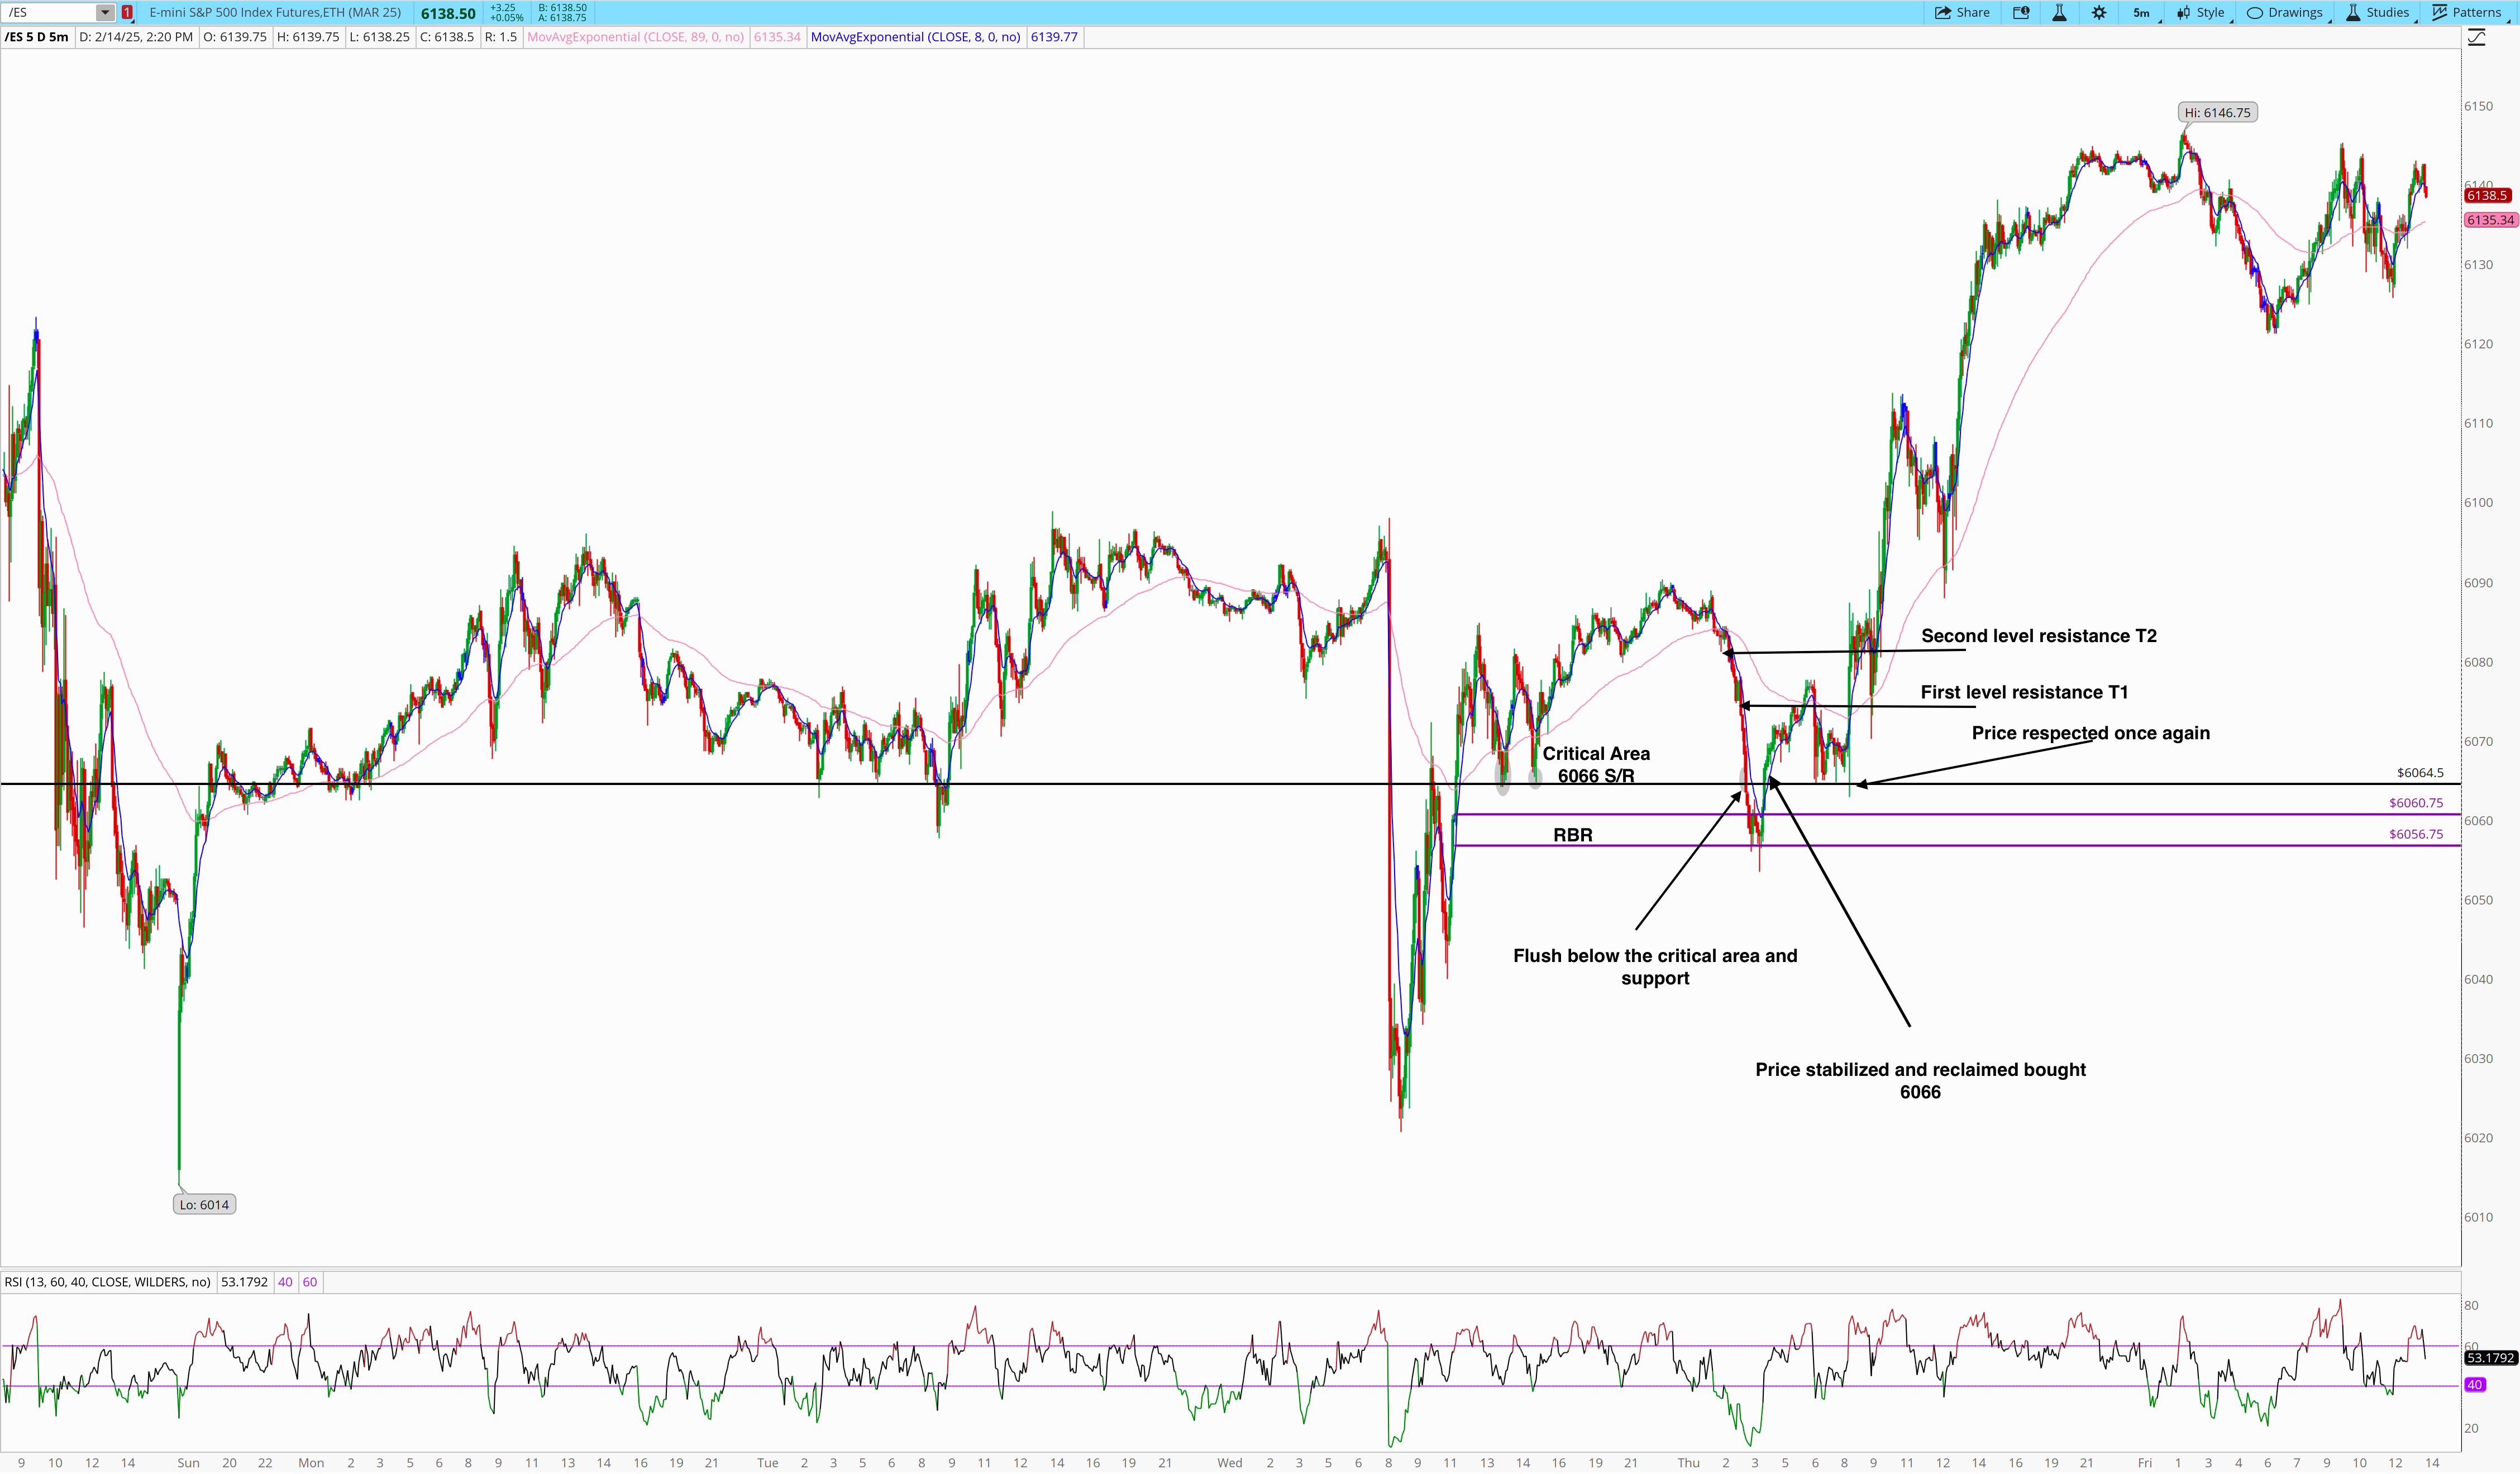
Positive Divergence
Positive divergence is defined as lower lows in price across a certain time frame and higher highs in the RSI indicator.
It looks something like this:
Below, reference the right side of the chart:
Here you can see lower lows in price and the RSI indicator raising in value.
This means that the downward momentum is losing its strength to the downside and a reversal is likely. If we couple that with a good level, with the trend, and with a reversal signal in the level our odds of a profitable trade increase.
Negative Divergence
Negative divergence is defined as higher highs in price across a certain time frame and lower lows in the RSI indicator.
It looks something like this:
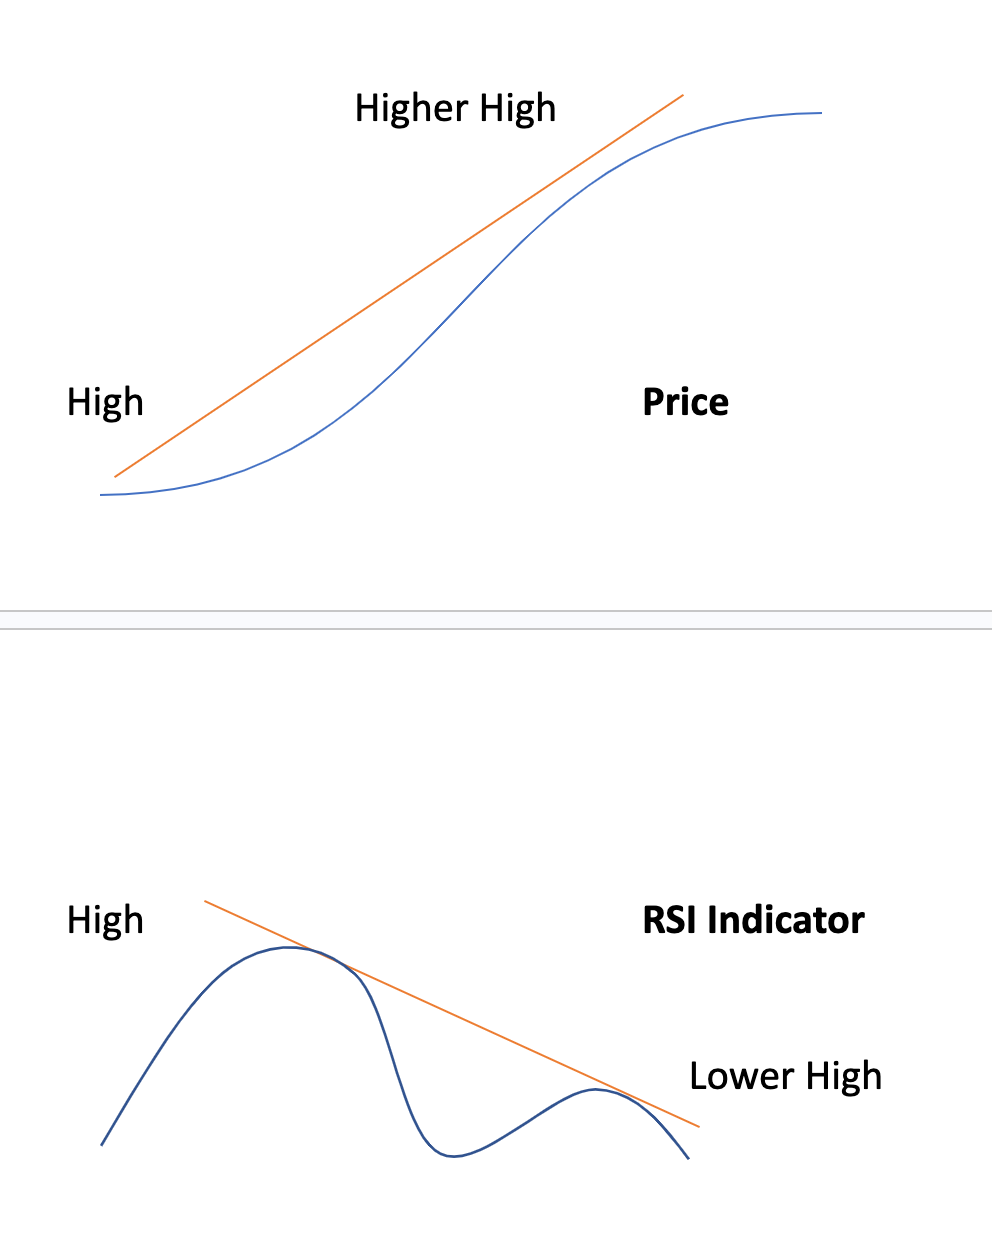
Here you can see higher highs in price and the RSI indicator lessening in value.
This means that the upward momentum is losing its strength to the upside and a reversal is likely. If we couple that with a good level, with the trend, and with a reversal signal in the level — our odds of a profitable trade increase.
Divergence is a sign that the trend may be failing.
It can offer good trade enhancers for us when coupled with the overall strategy.
If RSI is between 60 and 40 in your zone or level your clear to trade.
However, there are exceptions to this rule.
With a good level/reclaim with trend-
If you’re buying and the RSI is below 40, assume price will not make a new high out of the level. It may bounce, and you may be able to make a profitable trade to T1 but breaching new highs is less probable without a first pullback.
If you’re selling and the RSI is above 60, assume price will not make a new low from the level. It may fall, and you may be able to make a profitable trade to T1, but breaching new lows is less probable without a pullback first.
Risk Management and Profit Taking
I like simple.
So I group risk management and profit taking into one. They are part of the same theme here at ES and I find it difficult to differentiate the two when it comes to trading the core strategy.
While what I’m about to share with you is simple…. it’s incredible important.
These rules are absolutely, positively, under no circumstance whatsoever, to be violated. Ever.
These rules keep me profitable.
They protect me from emotion.
They ensure I have a position in most trend legs.
#1 No more than 5% risked on any single position. Non negotiable.
If you have a wider zone or stop…. make the contract size smaller. Smaller zone? You can add some size. But always give ES enough room to stabilize before you a proven wrong. The worst feeling in the world is getting wicked out only to see price go your way.
#2 Nothing less than a 1/1 reward to risk for T1. Non negotiable
This means if my risk is 10 points, I cannot take the trade unless my first target is 10 points. The levels decide whether I am able to accomplish this or not. Not my feelings. Which leads me to…
#3 I do not get to decide where Targets are. It’s just shy of next level resistance
This means, I never set an arbitrary target. I must use my support and resistance, critical areas and key supply and demand levels to identify and set targets. I usually set them just a few ticks below the level.
#4 60-75% of contracts are to be taken at T1
The majority of my position is sold once I hit the first target. This ensures I maintain a winning trade percentage and stay green. If I abide my rule #2, in theory I can be a 50/50 trader and still make money.
#5 10-30% of contracts are to be taken at T2
Again, abiding by rule #2 and now rule #4….Once I’ve sold the majority of the contracts at T1, my job to maintain and continue the profitability of the trade. I do so by taking a second target at a pre-determined support/resistance area which is simply the nest level up/down from the T1.
Our objective is to create….a runner.
#6 Always leave a runner if permitted
If T1 and T2 are hit, I move the stop to break even. That leaves me a minimum gain of the sum of profits in T1 and T2 and with a 10-30% position of the original position position to be left as a runner. I typically have a T3 if 30% is left and I’ll take 20% off at T3. But I always want to leave atleast a 10% runner.
#7 Limiting number of trades
Overtrading is the easiest way to blow your account.
So we have rules around that.
If you’re in a winning trade, there’s literally nothing to do.
So don’t.
Don’t go seeking more action.
If you’ve taken a trade and for example purposes say you’ve hit T1 and stopped out at breakeven. That’s great you hit your first T1 of the day. You’re green. You’ve made money. Remember that……. Now, let’s say price moves up/down into the next area we find available as an opportunity….The next trade should only have the risk of less than 35% of your profits from your first trade.
For example, let’s say you bought ES at 5700 and T1 was 5710, that’s a 10 point profit on 75% of you original position. You got stopped at breakeven to the entire total position you made….Let’s say it’s $5,000.
If you wanted to take a 2nd trade, you’re only allowed to risk $1750 on your next trade
This ensures you stay green most days.
If you lose on that 2nd trade, you’re up $5000, down $1750.
Just stop.
If you’ve lost on more than 2 trades, just stop.
If you’ve reached T1 and T2 and have a runner, just stop.
Let me explain these rules.
My job as a trader is to make money, not predict the future.
That said, we simply do not know where price is going. We use our core strategy to give us an edge and find likely turning points.
Considering the fact we can never know which way the market is going, it’s only prudent to take profit when profit is due, and give ourselves a high probability of turning that trade into an overall winner. By taking the majority of contracts off at the first target, we simply are adhereing the fact levels are respected. We’re positioning to profit from the level(s) move.
Depending on trend, I may move stop to breakeven earlier than T2 being hit. For instance, in a counter trend trade, it may make since to move stop to break even after T1 is hit, or even even we’re 1/2 to T1 depending on the risk and several factors.
If price hits T1 and turns great.. we guarantee a “free trade.” The majority of times we guarantee a winner by taking 75% off.
If T1 is hit and it turns, comes back and then rallies again… great we have T2.
If T1 is hit and follows thru… great we have T2 and on.
If T2 is hit, great. We now have a solid profit and the rest of the trade at break even.
If T2 is hit, great we have a runner.
If we stop out, great, we used the 1st rule to limit our risk.
Trading Psychology
I’ll be honest.
The mental part of trading…this takes time to get used to….
And it’s the hardest part of trading.
I think the most important thing to know is we need to remember what our job is.
Our job… It’s NOT to be right… It’s to make money.
If you can wrap you’re head around that fact, and embrace it, you’ve got a chance at being a good trader.
—————
You’re going to lose money, get used to it
You’re going to make money, get used to it
—————
You’re going to make great decisions that pay, don’t get an ego.
You’re going to make bad decisions that pay…. don’t get an ago.
—————
You’re going to make great decisions that don’t pay, don’t beat yourself up.
You’re going to make dumb decisions that don’t pay, don’t beat yourself up.
The following things are critical to your success as trader
-Discipline
……
Yup…..
That’s it.
Wait for your setups, take them inside the scope of the risk rules, take profit when it’s due, leave a runner, don’t over-trade, know when to stop, let your winners run…. All the things you’ve heard of since the beginning of time….
The goal here… is to eliminate emotion and make it mechanical/monotonous/boring/mundane….
—————We’re to be a robot once we turn on the platform and enter a trade.
—————
There’s no thinking after that.
Master that, and you’ll do great.
I’ve coached well over 1000 traders who actively trade in the markets. Again, the ones who succeed
#1 Follow their rules by turning into a robot, eliminating emotion
#2 Position size correctly
#3 Know when money is due and take it
We’re going to enter into each day with all this information in mind, and find Grade A setups, follow our rules, position size accordingly, and attempt to profit from every Grade A move in the ES market.
That’s it guys.
Simple
Level trackbacks, failed breakdowns, and confirming price with momentum.
I thank you so much for reading this, joining me, and I can’t wait to see what we can do together.
As a side note, I’m always here for a DM or question or even just want to banter about the markets… Message me.
Trade well
This is great, thanks. When you say no more than 5% risked, does that mean you are risking to lose 5%, or allocating 5% of your capital on a trade? If it’s the former, you get 4 bad trades and you are down 20% of your capital. Probability theory says a string of bad trades WILL happen, 4 in a row is on the low end of bad strings.
I wish you could explain further on how to get into the trade, once price touched or crossed our areas of interest. When would it be too late to get in? The longer i wait for confirmation, the more my risk will be.