
ES Extends Breakdown Sunday April 6: Perpetuating the Worst 3-Day Drop Since the COVID Crash. April 7 Plan
"Fear Reigns: ES Plunges in a Move Echoing the Pandemic Panic"

April 7, 2025
Market Recap: April 2–4, 2025
Over the past three trading days, financial markets have been gripped by heightened volatility and pervasive selling, triggered by Trump's announcement of sweeping tariffs on April 2. This policy shift has intensified fears of a global recession and led to significant market dislocations.
Wall Street's "fear gauge (VIX)," surged to 45.56 on April 4, its highest level since August, indicating elevated market anxiety.
Over the past week, zero-day-to-expiration (0DTE) options have dominated the S&P 500 Index market, accounting for approximately 57% of total SPX options volume. This surge reflects a significant increase in short-term trading activity, with traders aiming to capitalize on intraday market movements.
This heightened activity in 0DTE options coincided with increased market volatility, as indicated by the Cboe Volatility Index (VIX) surpassing 40. The combination of elevated VIX levels and the surge in 0DTE options trading suggests that market participants are actively seeking to hedge positions or speculate on short-term market movements amid heightened uncertainty.
ES: The benchmark index declined by over 16% Wednesday, April second, erasing approximately $10 trillion in market value.
More to come?
J.P. Morgan said on Friday
Volatility targeting portfolios had between $25 billion and $30 billion in equities to sell in the coming days, as they unwind positions to reduce risk. Levered exchange-traded funds (ETFs) had an additional $23 billion to sell to rebalance into Friday's close, mostly tech stocks, it had said.
Goldman Sachs noted:
That global long/short hedge funds experienced their largest net selling in nearly 15 years on April 3, turning the most bearish since 2011.
Bloomberg’s Market Selloff:
The S&P 500 experienced a severe decline last week. This decline pushed the index back into correction territory, down 16% from its all-time high. Peter Tchir, Head of Macro Strategy at Academy Securities, commented that the market's reaction to the tariffs might be "under done," indicating that the full impact may not yet be reflected in market prices.
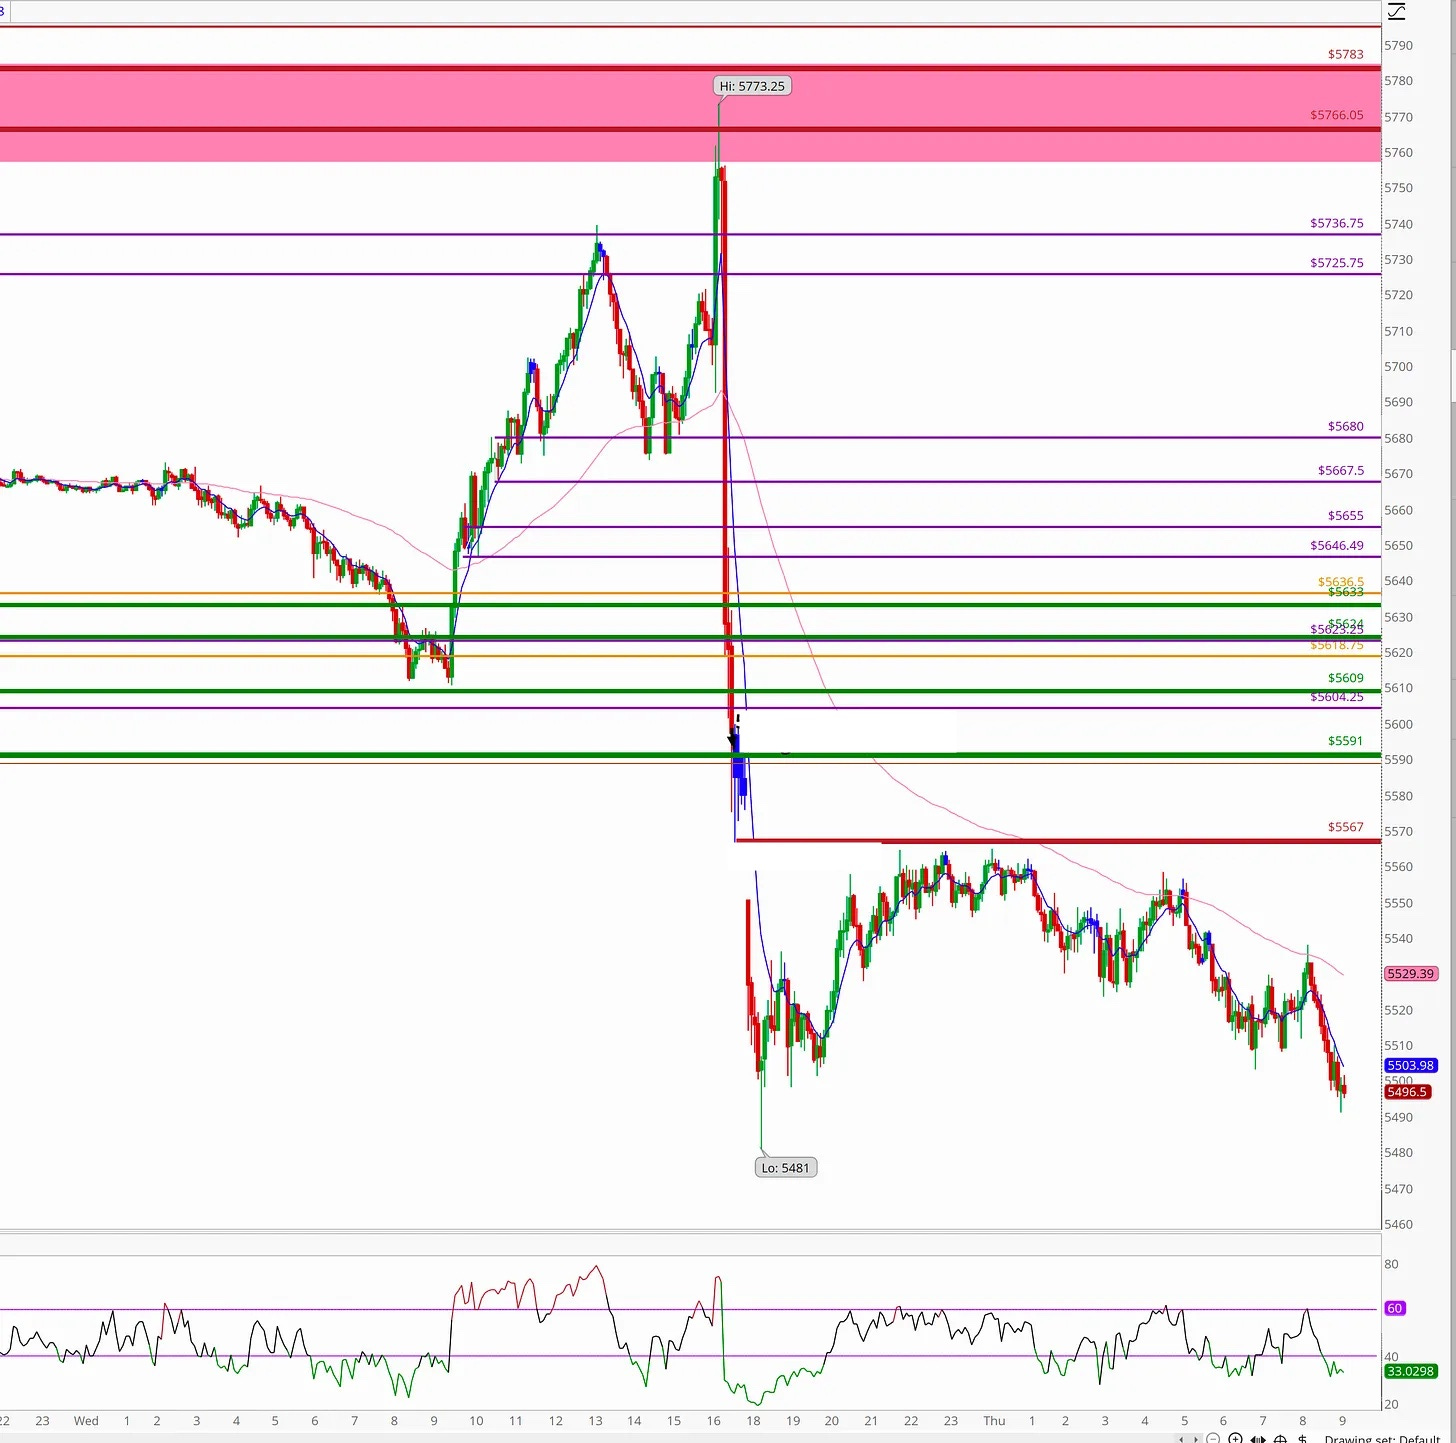
Look at just how crazy the last few trading sessions has been in comparison to other high volatility and selling times.

Remarkable to see just how close we are to the worst times in market history, and yet how much further we could go…
Here’s some of the takeaways I got studying this chart over the weekend:
1. April 2025 is firmly in crash territory
With a 13% drop in 5 trading days, the current selloff is now worse than the Feb 2020 COVID slide, and almost neck-and-neck with the 1929 crash pace.
It’s also steeper than the start of 1987, which was the lead-in to Black Monday.
2. Market velocity is the real story
The speed of this decline puts it in rare company. Most major crashes build momentum over a week or more — this one wasted no time.
ES moved from 5712 to 4951 in just 4 sessions — a massive unwind that suggests forced selling, vol triggers, and margin calls in play.
3. No relief bounce (yet)
Unlike the Mar 2020 panic, which saw intraday whipsaws and a dead-cat bounce by Day 5, the April 2025 move has stayed heavy.
That signals fear is still driving decisions, not positioning or recovery.
4. We’re in the early innings or the eye of the storm
In 1929, 1987, and 2020 — Day 5 wasn’t the bottom. It was just part one.
If history holds, there’s a high probability of either a brutal follow-through or a sharp, temporary rally as volatility peaks.
5. Institutional flows may still be unwinding
We know from JPMorgan and Goldman that volatility targeting funds and leveraged ETFs still had tens of billions left to rebalance.
This chart visualizes the impact of “forced rotation” — and it may not be done.
So We Have:
—> VIX soaring to levels not seen since June 2020.
—> 0DTE options reaching record level of volume
—> Record setting market velocity with no bounce
—> Headlines across the board (literally everywhere) invoking fear, saying more is coming.
Will this selloff continue?
If we bounce will it be a “dead-cat” bounce?
How do we know when bottom is in?
Let’s get to it in today’s April 7 AM premarket newsletter…
Through the market chaos that has been the last several trading days, it’s important to note: I spent most of the last few days doing nothing.
We’ve taken 5 trades since April 2nd when the selloff started and we’ve taken 1 loss.
I always say that:
Liquidity brings Volatility
Volatility brings Opportunity
While we’ve had incredible volatility, the Grade A+ opportunities we seek to take advantage of haven’t been numerous.
We’ve hit initial targets and 2nd targets ensuring we’re profitable but the heavy volatility also brings snapbacks, stopping us out earlier than preferred to carry any runners.
With no positions entering the April 7 trading day here’s where we stand.
ES Scoreboard:
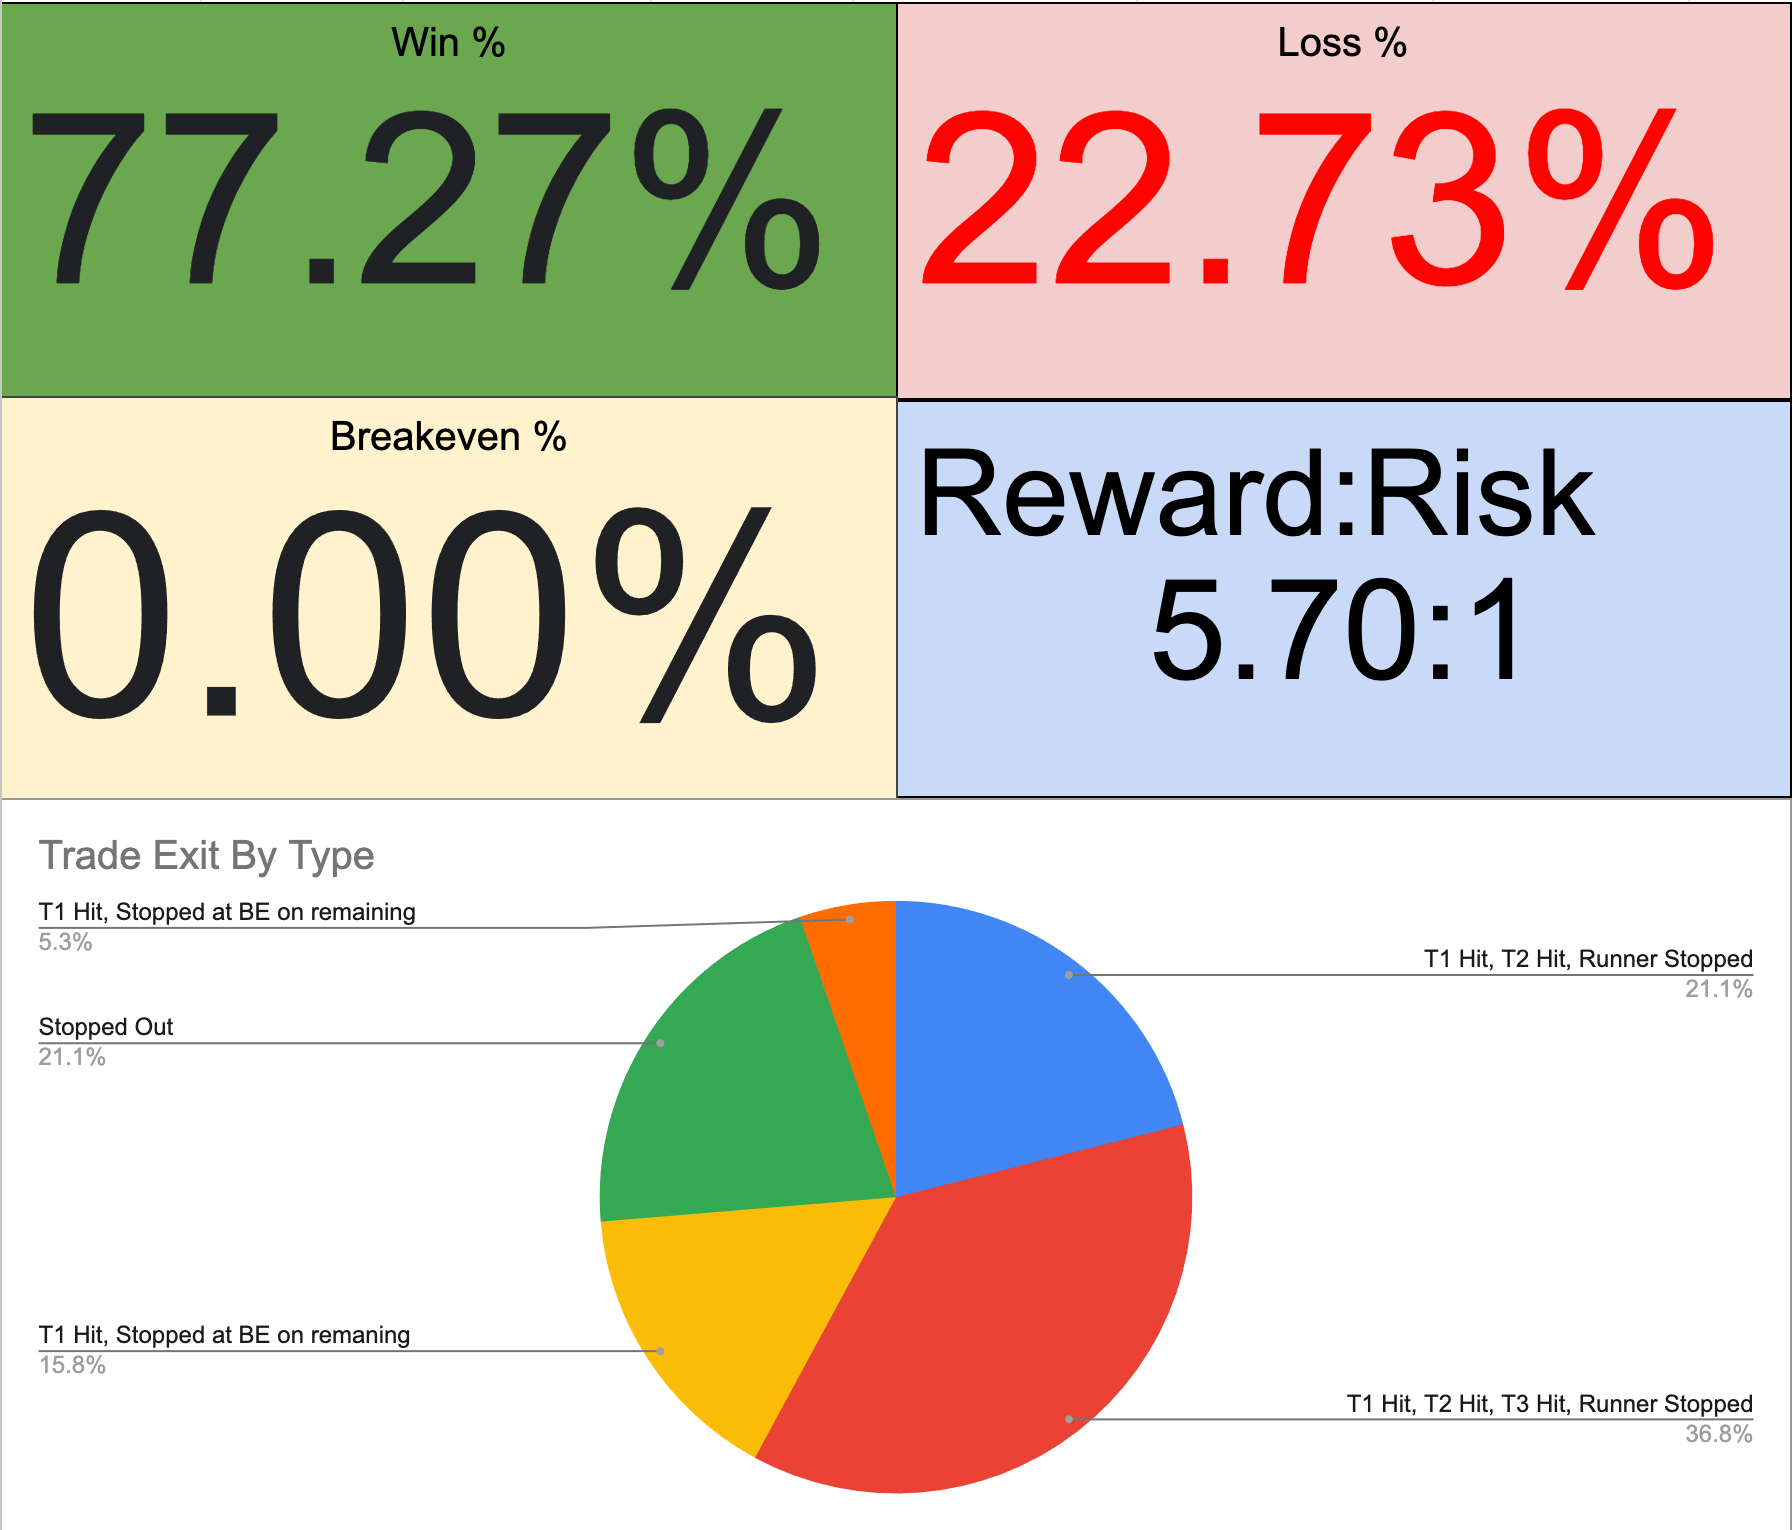
Trade Recap Section:
Note: This Trade Recap section breaks down a few of the trades we’ve taken over the past several days. You’ll get insight into why I took the trade, how I approached the setup, and what I was looking for before pulling the trigger. These aren’t hindsight reviews — all setups are shared with readers in advance. Years ago, I began documenting every trade I took in a physical journal — printing charts, writing notes, and tracking my thought process before, during, and after each trade. That practice became a cornerstone of my growth. It helped me refine my edge, stay accountable to my rules, and improve faster than anything else I’ve done. Now, I share that process with you — so you can see real trades, real decisions, and real outcomes. The goal: shorten your learning curve by showing what it actually looks like to apply a strategy in live markets. Note: any targets and/or runners mentioned in the trade recap section may have been stopped out or moved. I include all position management of our trades inside future newsletters and on X.com.
April 1st - 3 Trades
Trade #1- Failed breakdown of 5618. Stopped after 10 points
Trade #2 - Level trackback long from 5606. T1-T3 hit. Runner runs
Trade #3 - 2nd attempt at Failed breakdown of 5618. T1-T3 hit. Runner runs
In the AM letter I wrote:
Likely Supports For 4/1 are: 5618
5600 to 5592 offers a great level trackback trade opportunity and as long as we’re above 40 on the 1 hr RSI, I’ll likely bid that level direct if we get there.
Both came into play today.
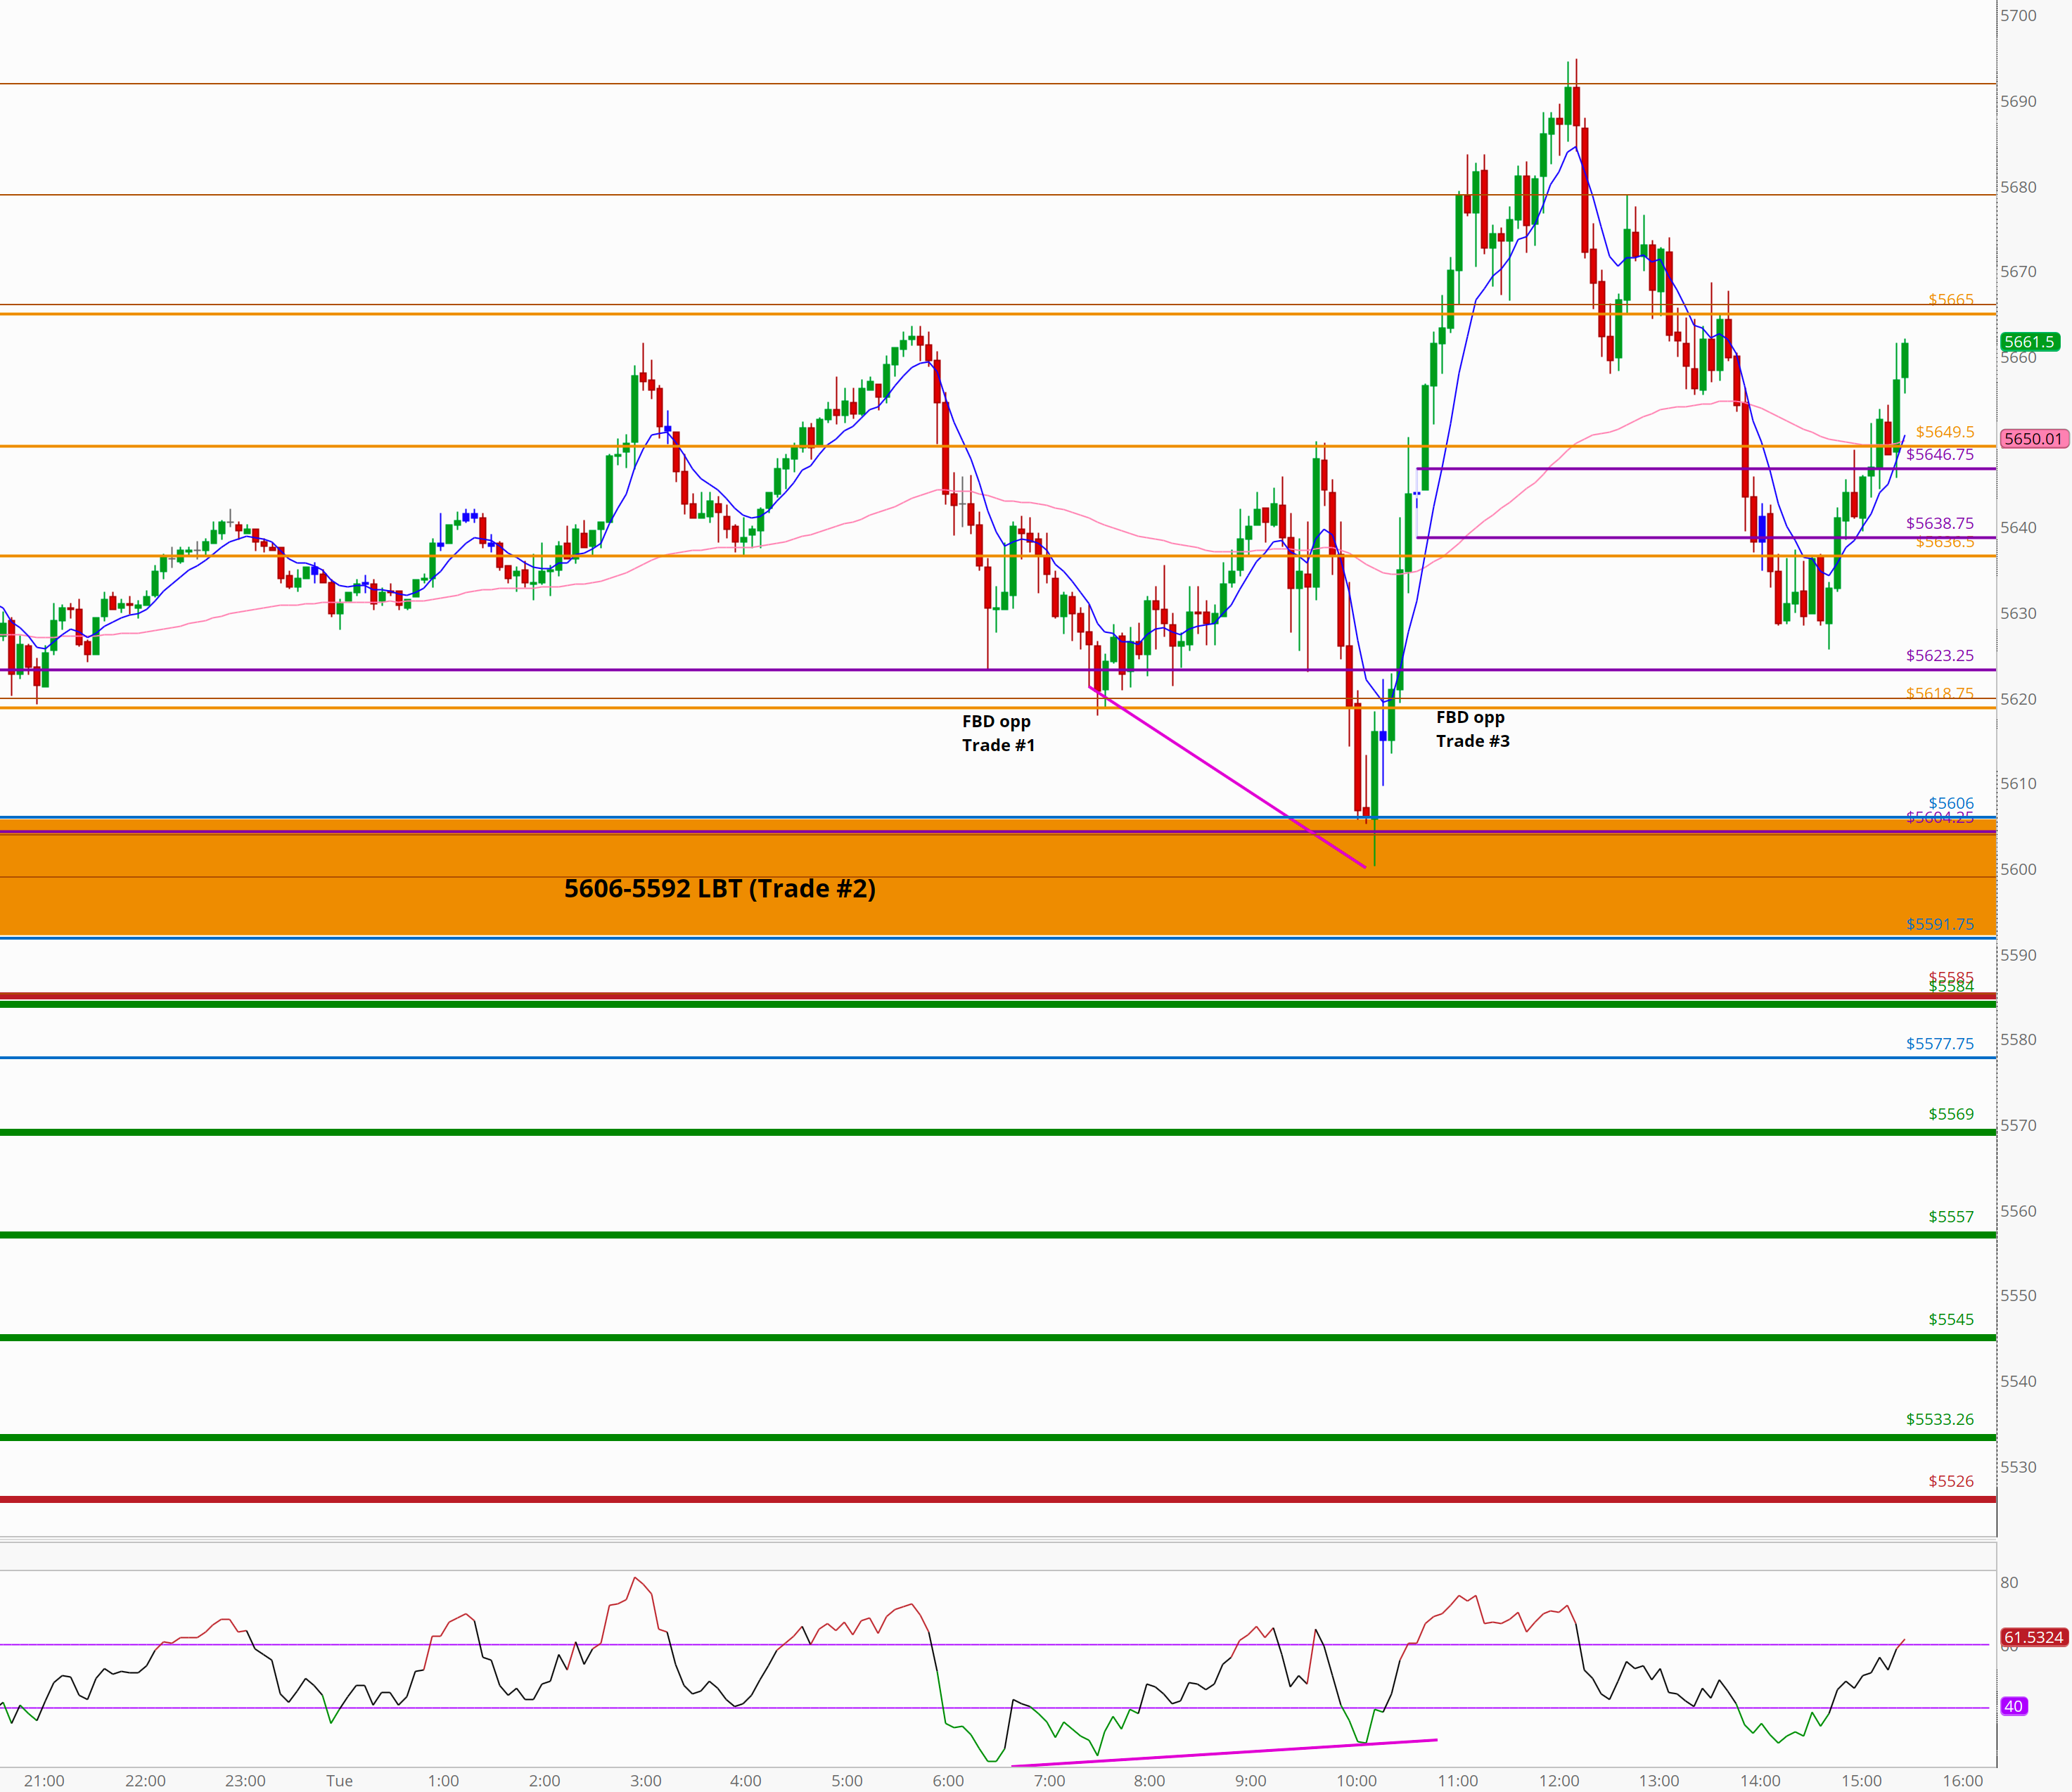
Here’s what price did April 1, on a 5 min chart:
Let’s remember our rules and profit strategy before we get into these trades, because if you held and waited for the fences, you may have been upset with yourself.
These come from our Core Strategy here:
#3 I do not get to decide where Targets are. It’s just shy of next level resistance
#4 60-75% of contracts are to be taken at T1
#5 10-15% of contracts are to be taken at T2
#6 Always leave a runner if permitted
#7 Limiting number of trades
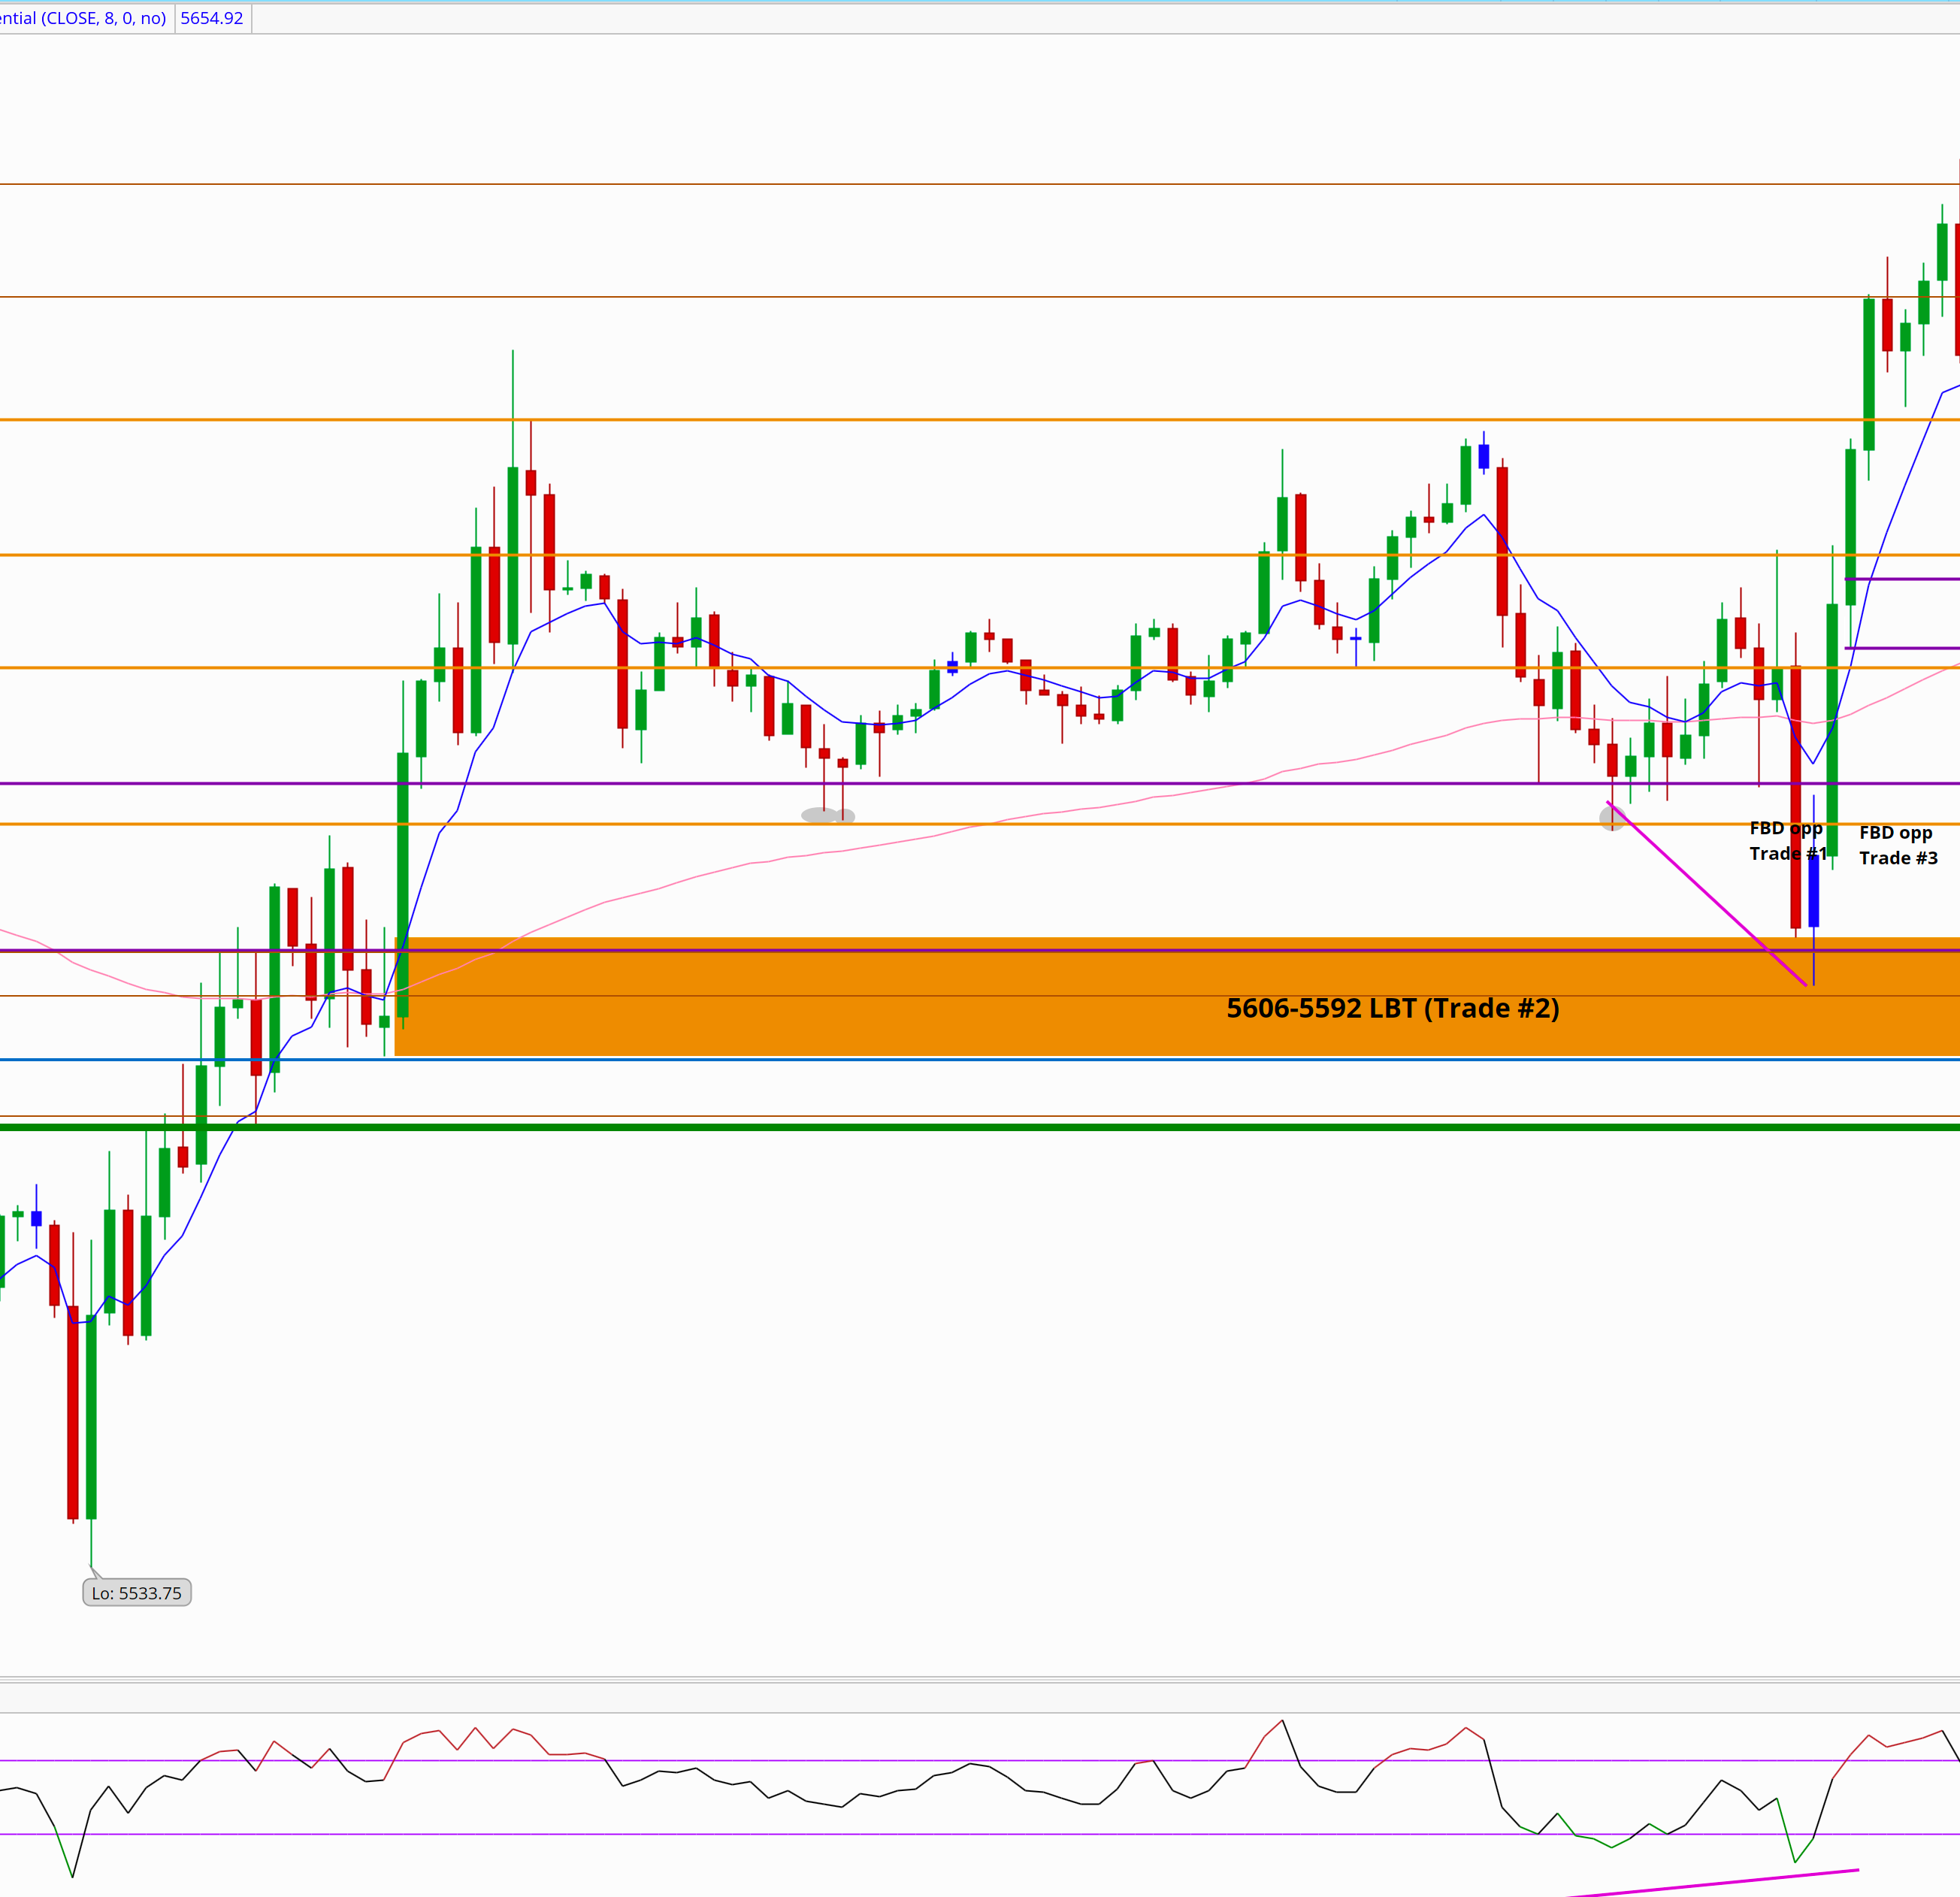
April 1 Trade #1 - 5618 FBD - Result - Loss of 10 points on a 25% position
While there’s a lot in the chart below, focus on the grey circles and blue lines.
Above you can see price used the 3/31 high of 5617 as bouncing point, bouncing a few points above this area 3 separate times. A failed breakdown consists of ES using a specific price several times as a bouncing point, flushing it 8-12 points and reclaiming the level, ideally in the same direction as the trend. We wait for acceptance a couple minutes typically, before a rally ensues bouncing off a support level.
This is exactly what we were provided with at ~10:02 EST this AM.
Price did manage to rally 4 points or so before giving way and stopped us out. Remember though, we had the runner from 5545 and because we had the demand just below at 5606-5592, we took a partial position on the 1st FBD opp.
The failure led to:
April 1 Trade #2 - 5606 LTB - Result - T1, T2, T3 hit. Runner in place.
Note: Trade 2 and Trade 3 happened very quickly. I do my best to explain these in detail but the happened literally minutes apart from each other. Moving the stops, adjusting the targets, and monitoring the trade to reduce risk and maximize profits are spelled out as clearly as possible
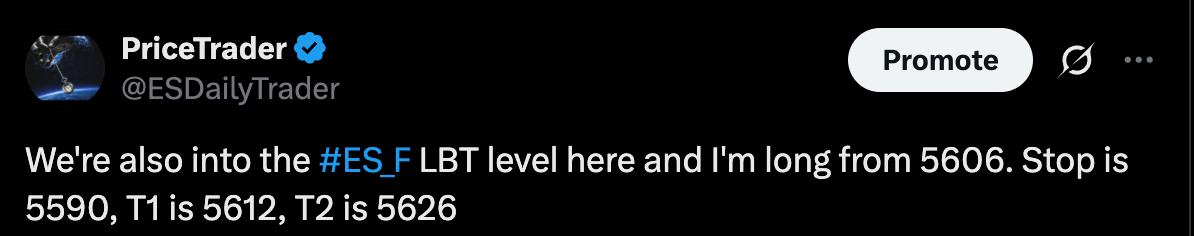
As posted in this AM writeup:
5600 to 5592 offers a great level trackback trade opportunity and as long as we’re above 40 on the 1 hr RSI, I’ll likely bid that level direct if we get there.
After Trade #1 failing and leading us directly into the LTB area I bought, at the market, while price was printing 5603, I was filled at 5606.
I posted on X:
Though, targets were initiated when price was 5603 I stuck to the plan.
In quick order T1-T3 were hit.
Here’s a 15 min chart for ease:
We were diverging on the 15 minute chart into the LBT area and on the hourly we held strong at a 46+ RSI. This allowed me to take a 50% position long, quickly recouping the 10 point loss on a 25% position just minutes prior in Trade 1.
ES had a monster rally from 10AM-12PM EST.
After hitting T1 at 5612, I took T2 just shy of the original target getting us solidly green on the day.

The rally above 5618 offered another shot at the 5618 failed breakdown and I took it:
April 1 Trade #3 - 5618 2nd Attempt FBD - Result - T1, T2, T3 hit with runner in place
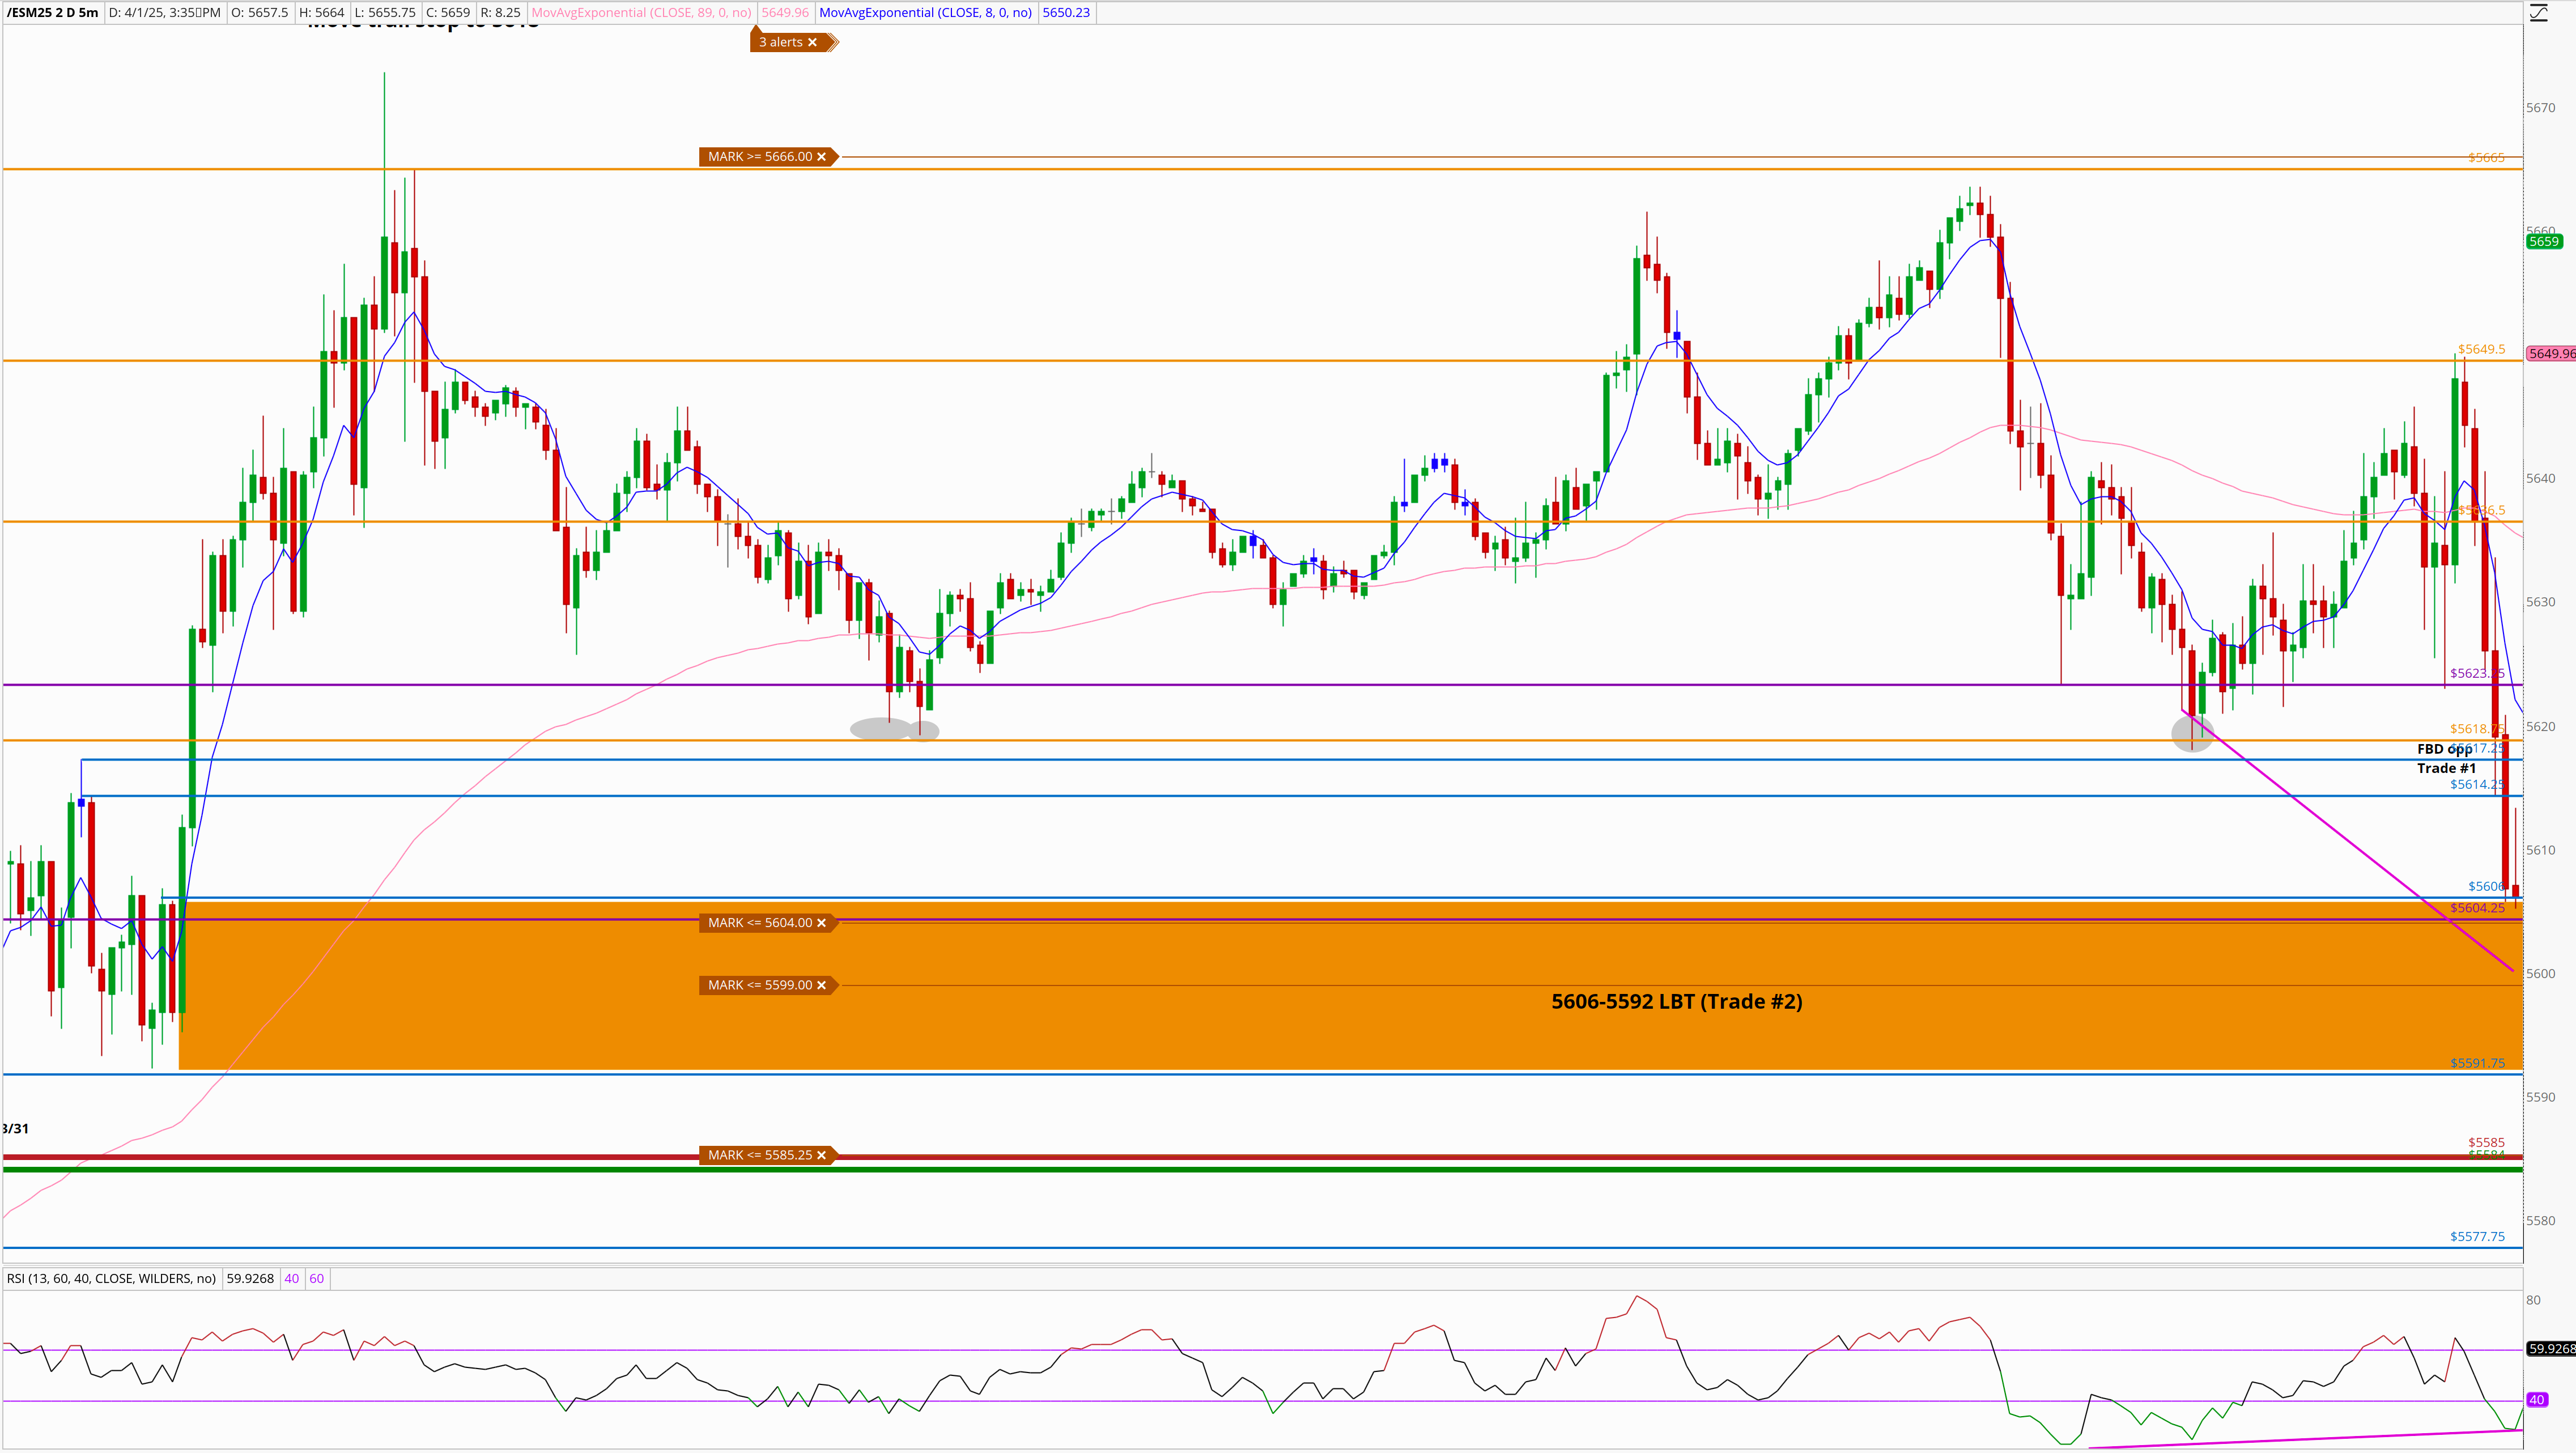
Here’s a picture of it:
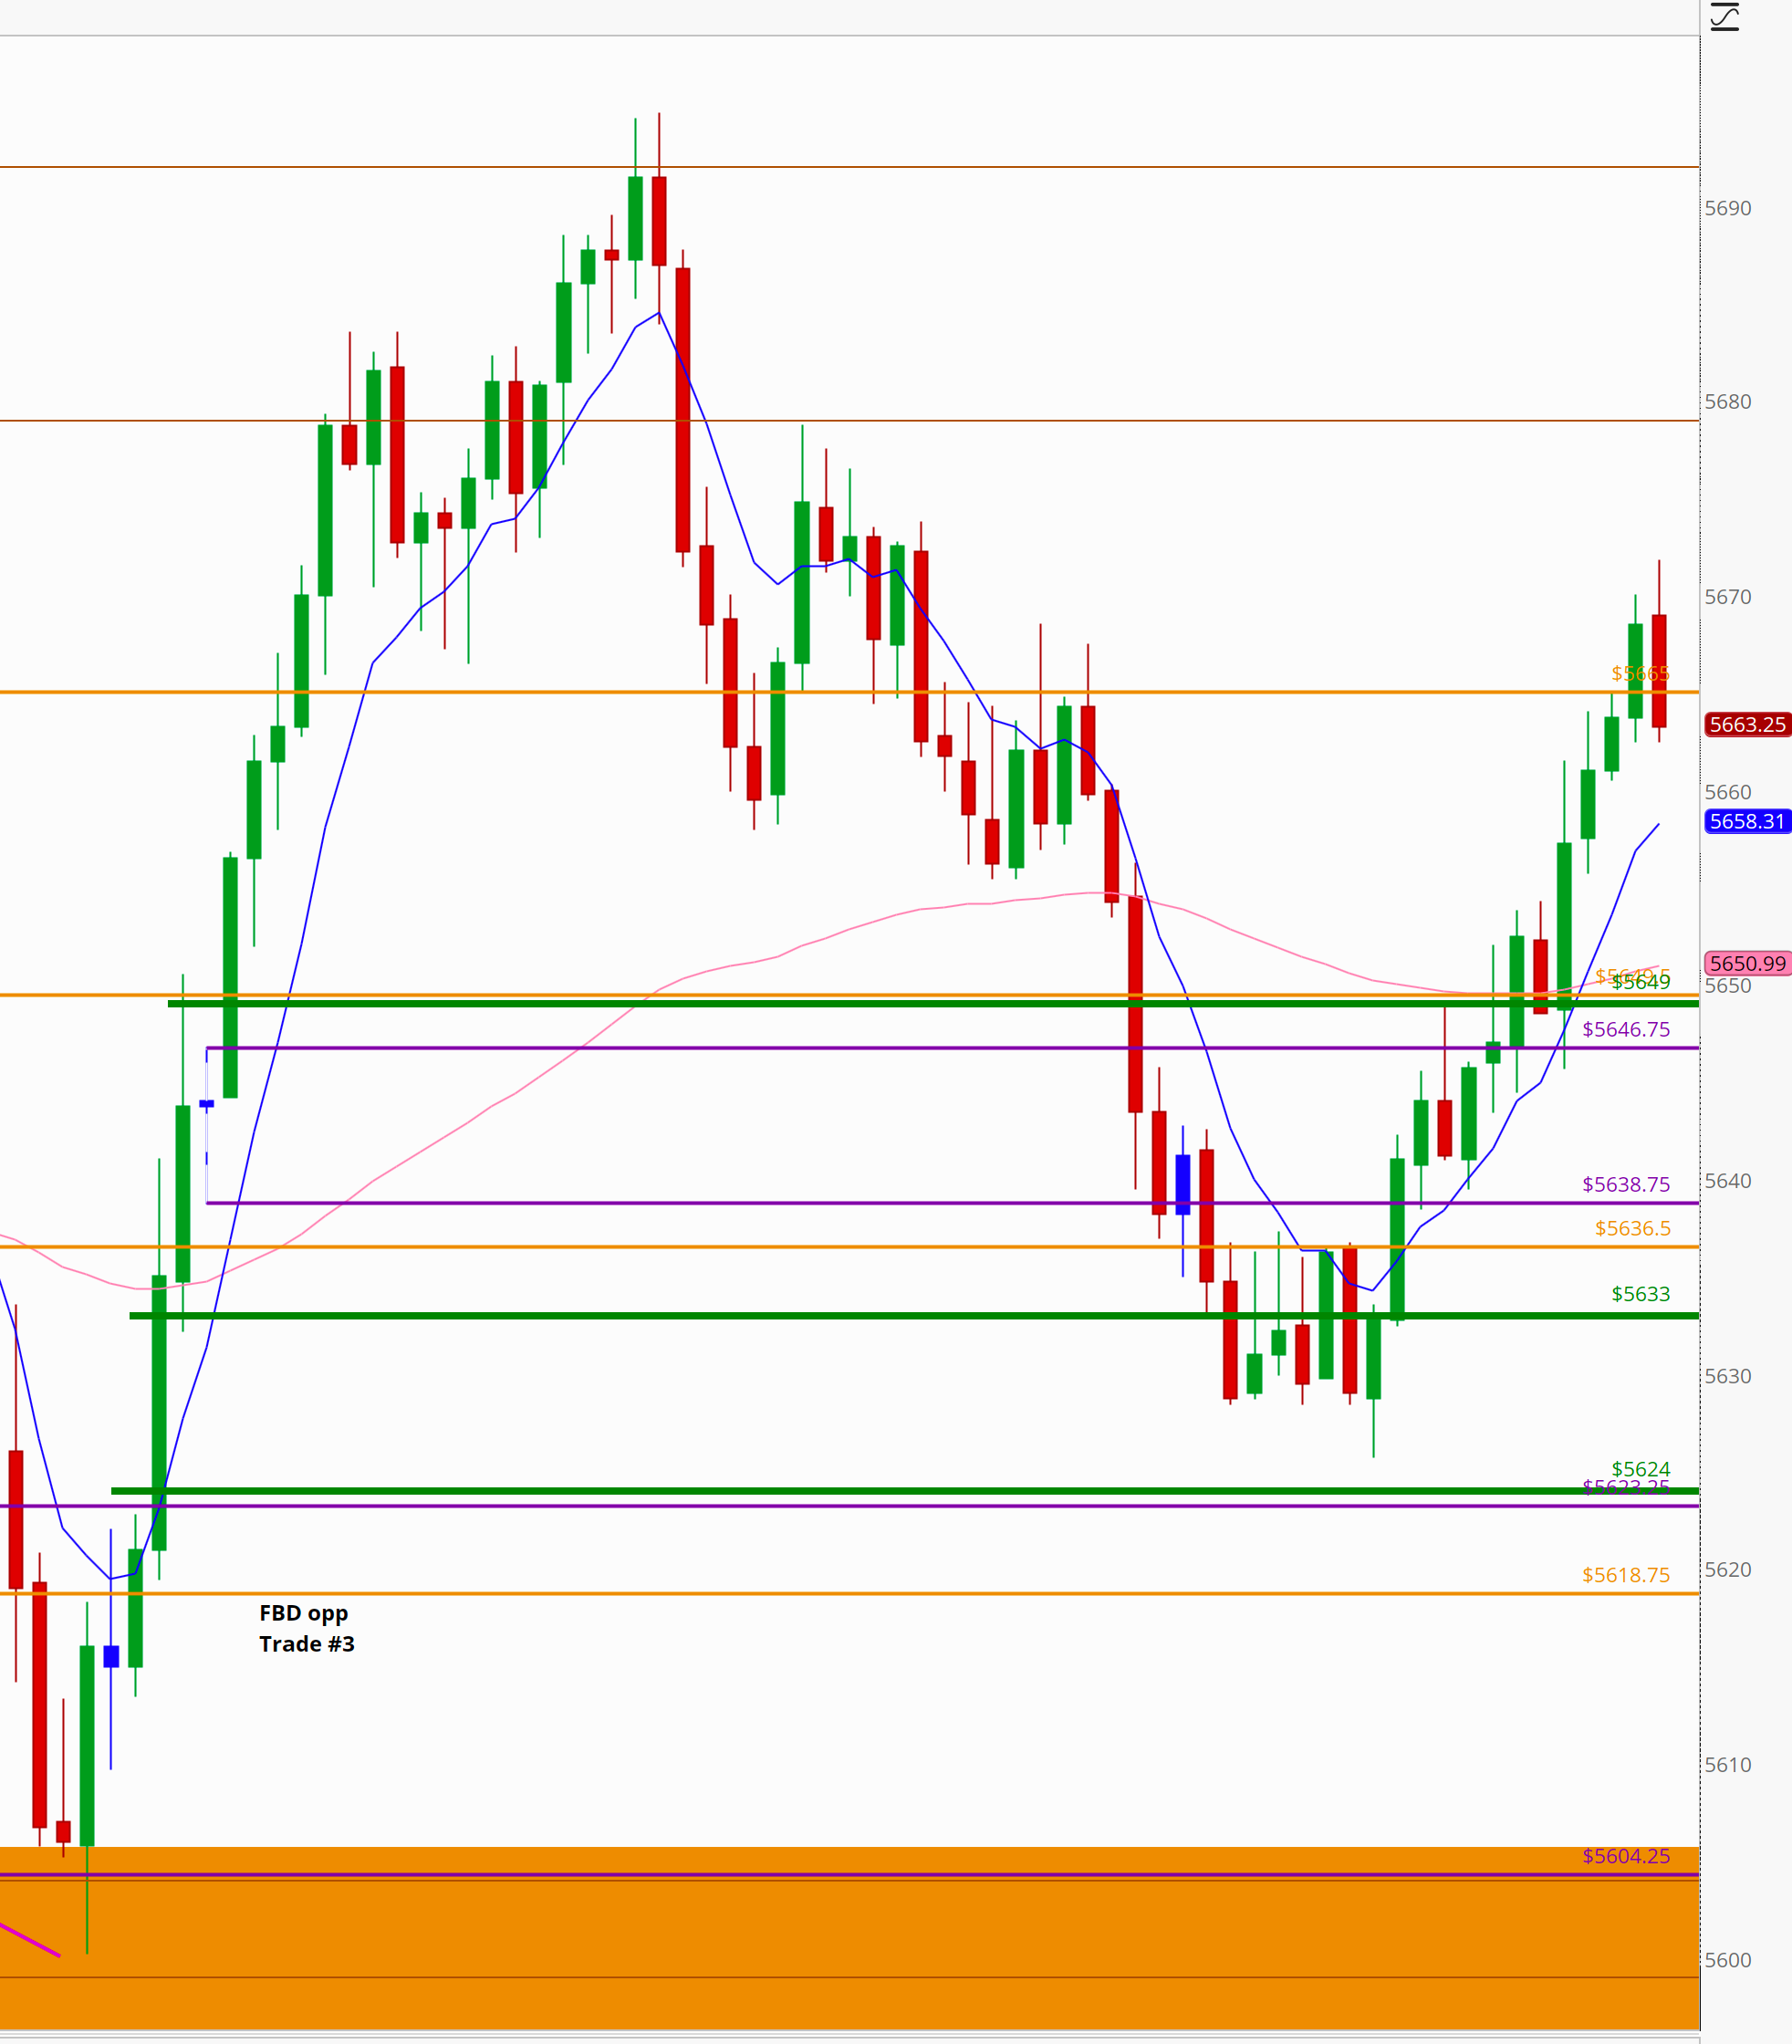
The area in yellow is our 5606 LTB trade, and the green lines you see on the chart are the targets for our 3rd trade of the day, the second attempt at the 5618 FBD.
As price bounced from our demand zone, we were offered a second chance at 5618 reclaiming. And reclaim it did.
Very quickly we hit T1, and stop was pulled up to 5559 on Trade 2 and the orginal stop on the 5618 2nd attempt was 5604.
I noted on X again:
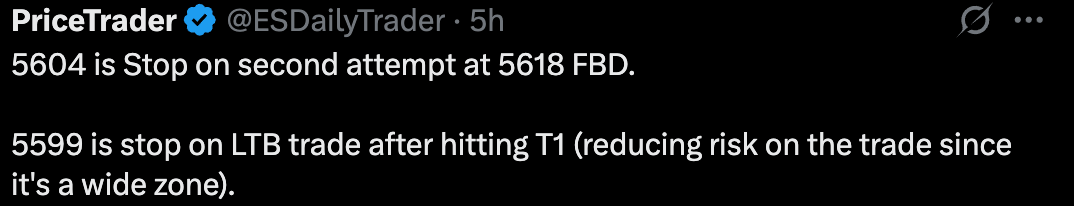
Literally minutes later our targets were hit and I pulled the stops up even further on both trades saying:

April 2nd - No Trades
April 3rd - 2 Trades
Trade #1- 5010 Reclaim. T1 hit. Remaining stopped at breakeven
Trade #2 - 5479.50 Reclaim. T1-T2 hit. Runner stopped at breakeven
Trade #1 April 3, 5010 Reclaim
I started the day with the following chart:
Noting the following in this AM’s newsletter:
Likely Supports For 4/3 are: 5510 (reclaim), 5500(D), 5498, 5485 (D)
This idea of a reclaim, we’ve spelt out multiple times. As price attempted to find a bottom, the first opportunity that was given to us. Displaying a bottom was accepted, a new high was put in place, and we respected the existing rally at 5510 was the reclaim
Here’s a chart of the trade before the explanation below:
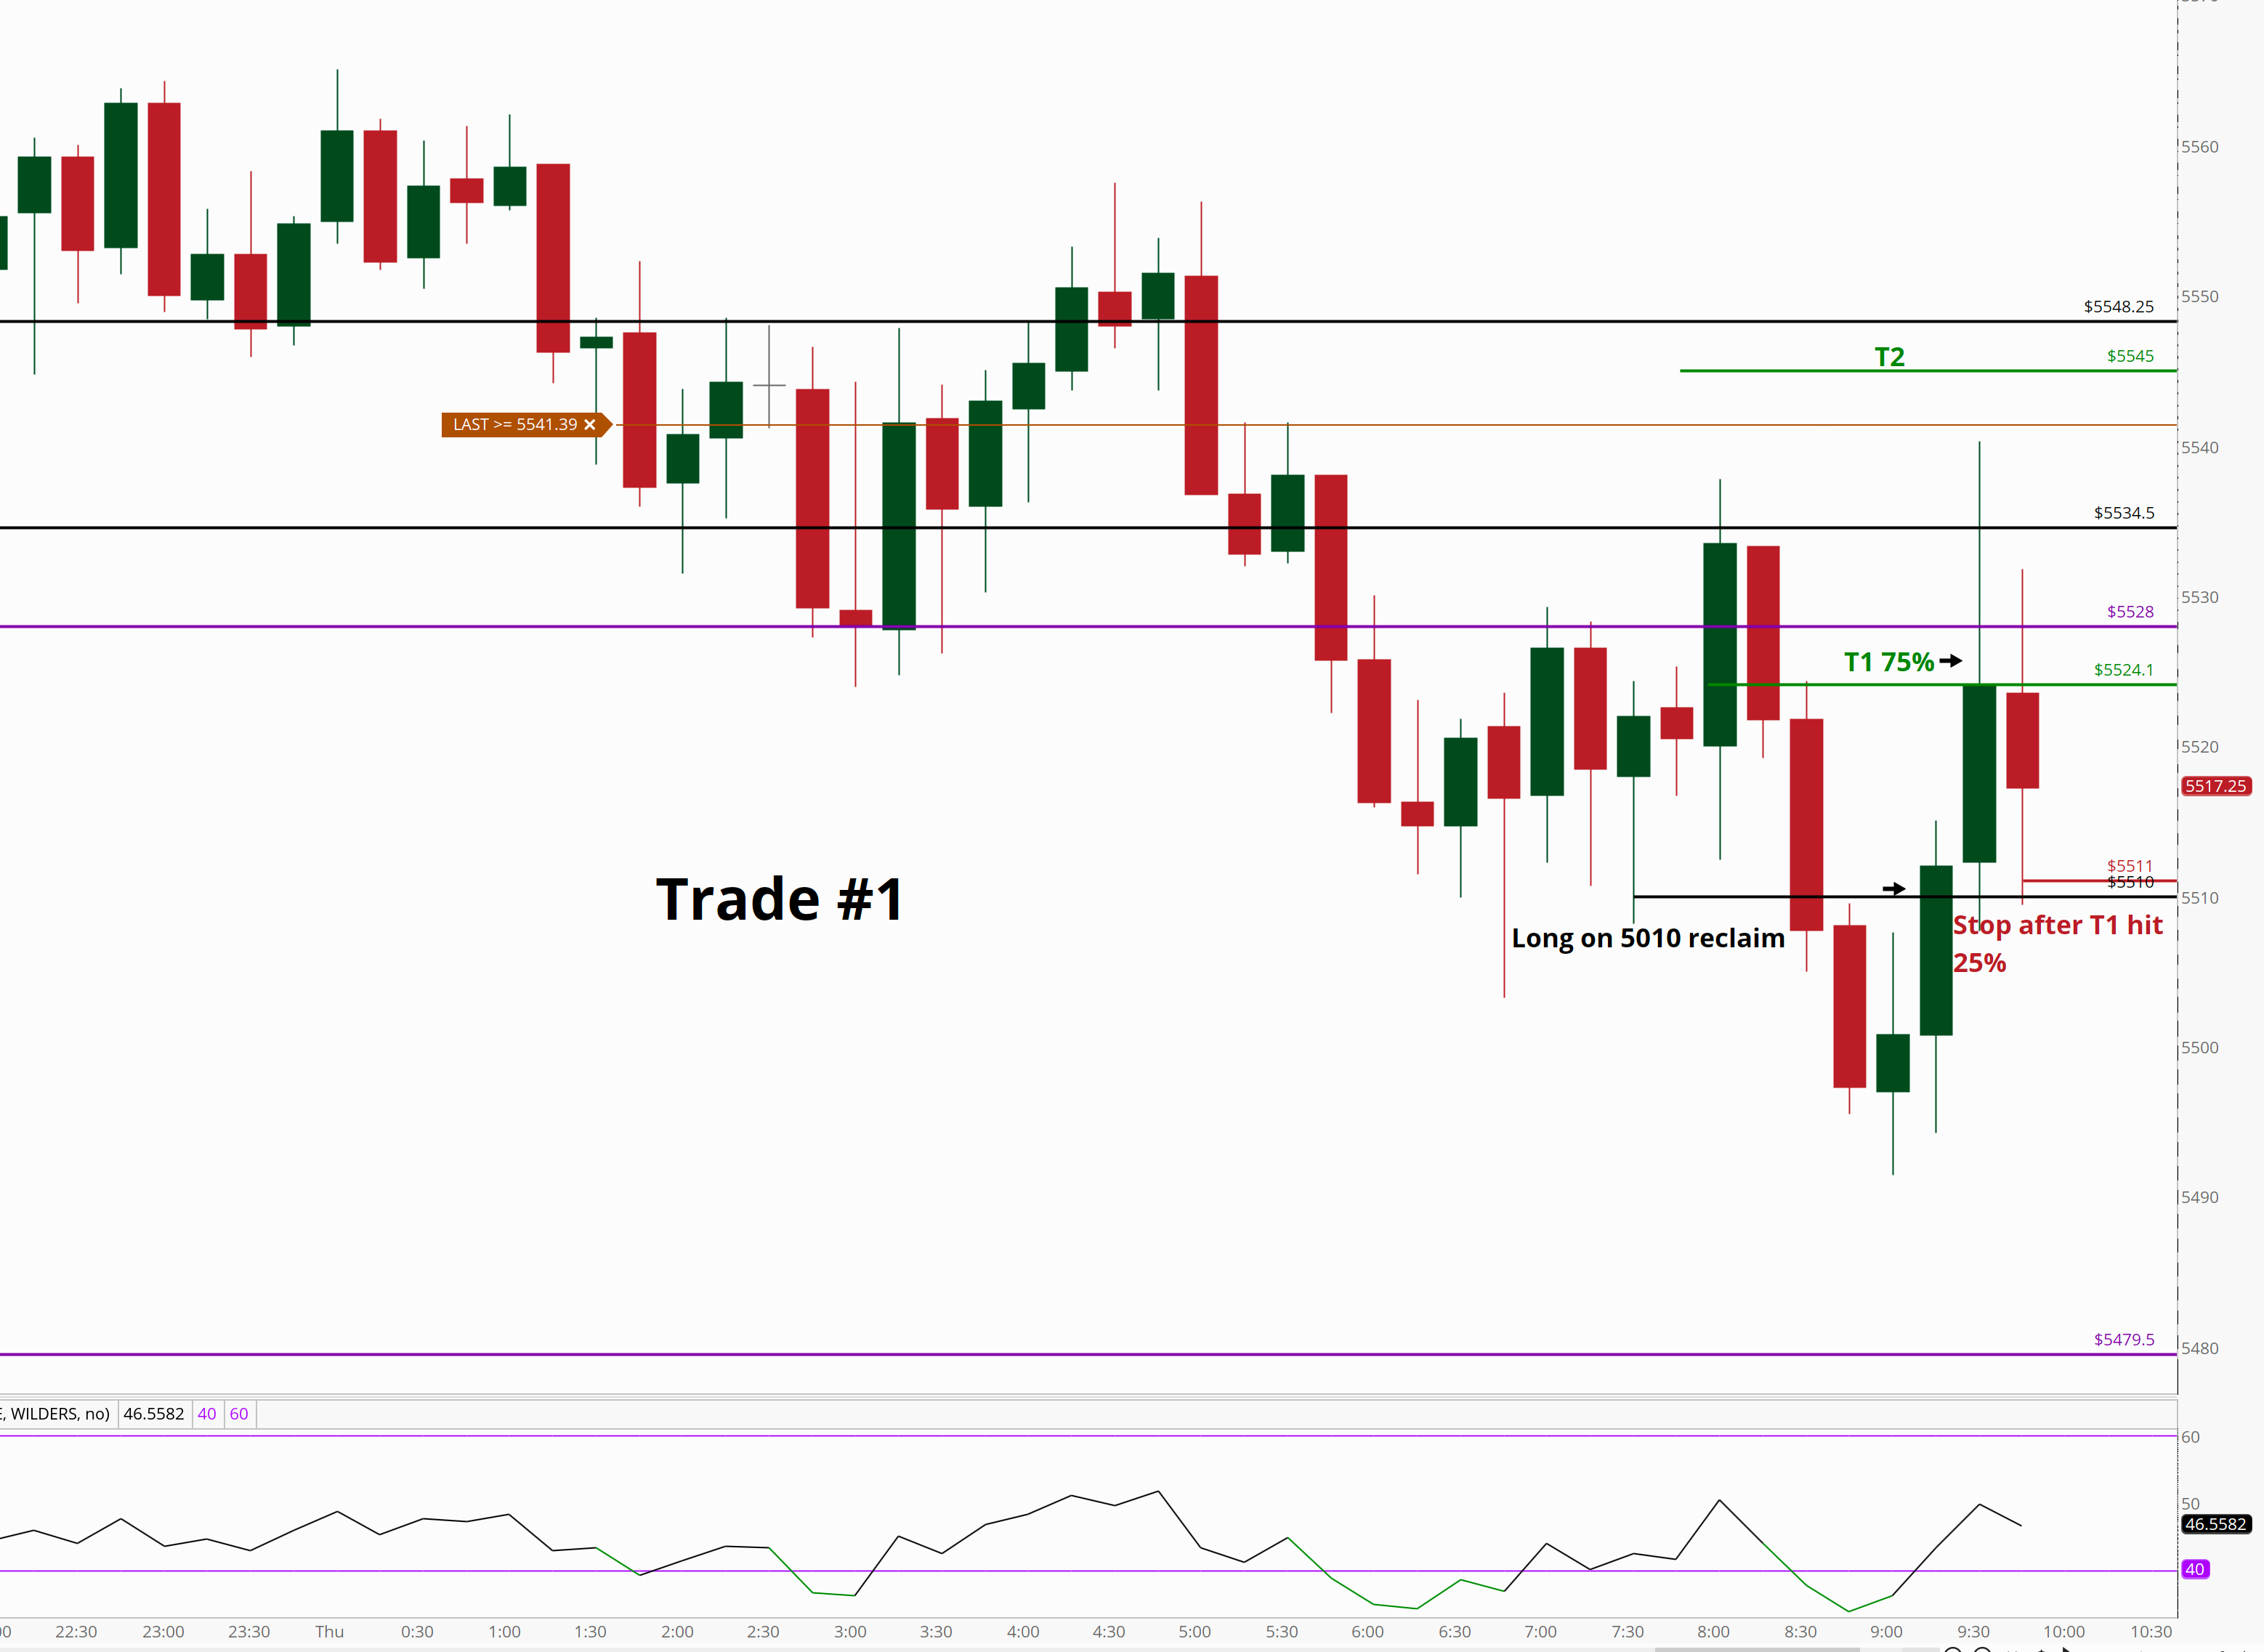
In the chart above we can see a 6:45AM EST low of 5503. We rallied from there back up inside the range the 5536 or so, before selling off premarket, finding a bottom at 5491. 5491 was the same area we got long yesterday after the initial collapse on Trade #1 post market. Interesting to see this area be the same bottom just 10 hours later.
As we accepted, and then recovered, we can see price reclaim the 6AM-7:40AM lows. Momentum shifted short term, and the simple trade was a 5510 reclaim long with T1, just at the 3AM low basically.
Because we hit this zone and entered the trade pre-market, I was inclined to respect overnight levels, especially on such a selloff. Within 1 minute of the regular trading hours 9:30AM EST open T1 was hit from 5510 to 5524.
I wrote:
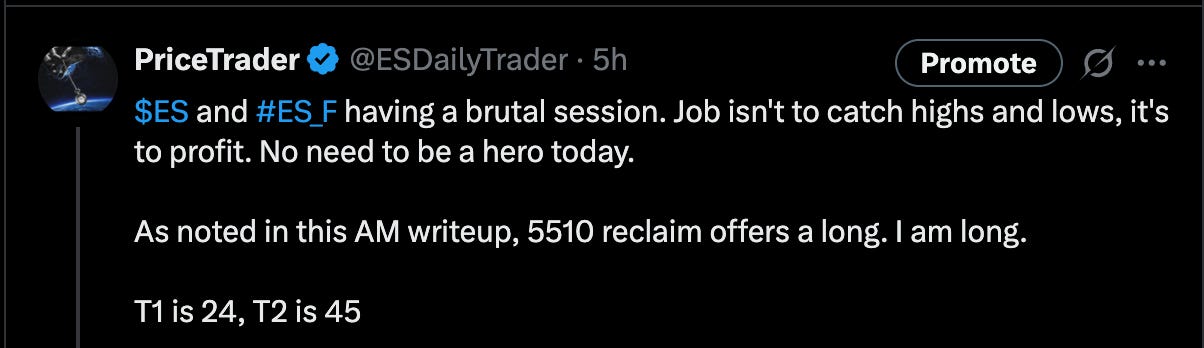
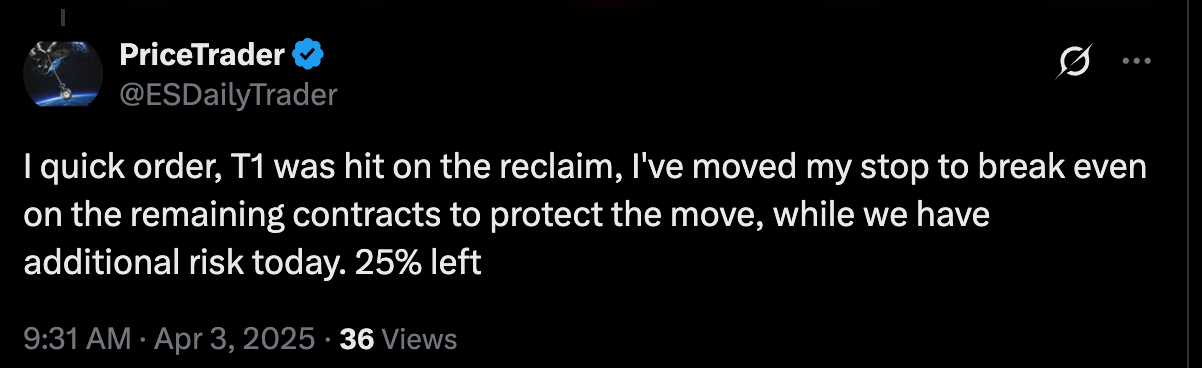
Upon entering the trade we took a full size position, hitting T1 within minutes, and simultaneously reducing the risk of the trade by dragging my stop to breakeven. This was just one tick above the entry, at 5511.
Price ultimately came within 5 points of our second target at 5540.25 (T2 was 5545) before turning around and stopping us out for a 14 point gain on 75% of the contracts taken.
At 9:50 I wrote:

Trade #2 April 3 - 5479.50 Reclaim long
Here’s what I wrote at 10:39AM:
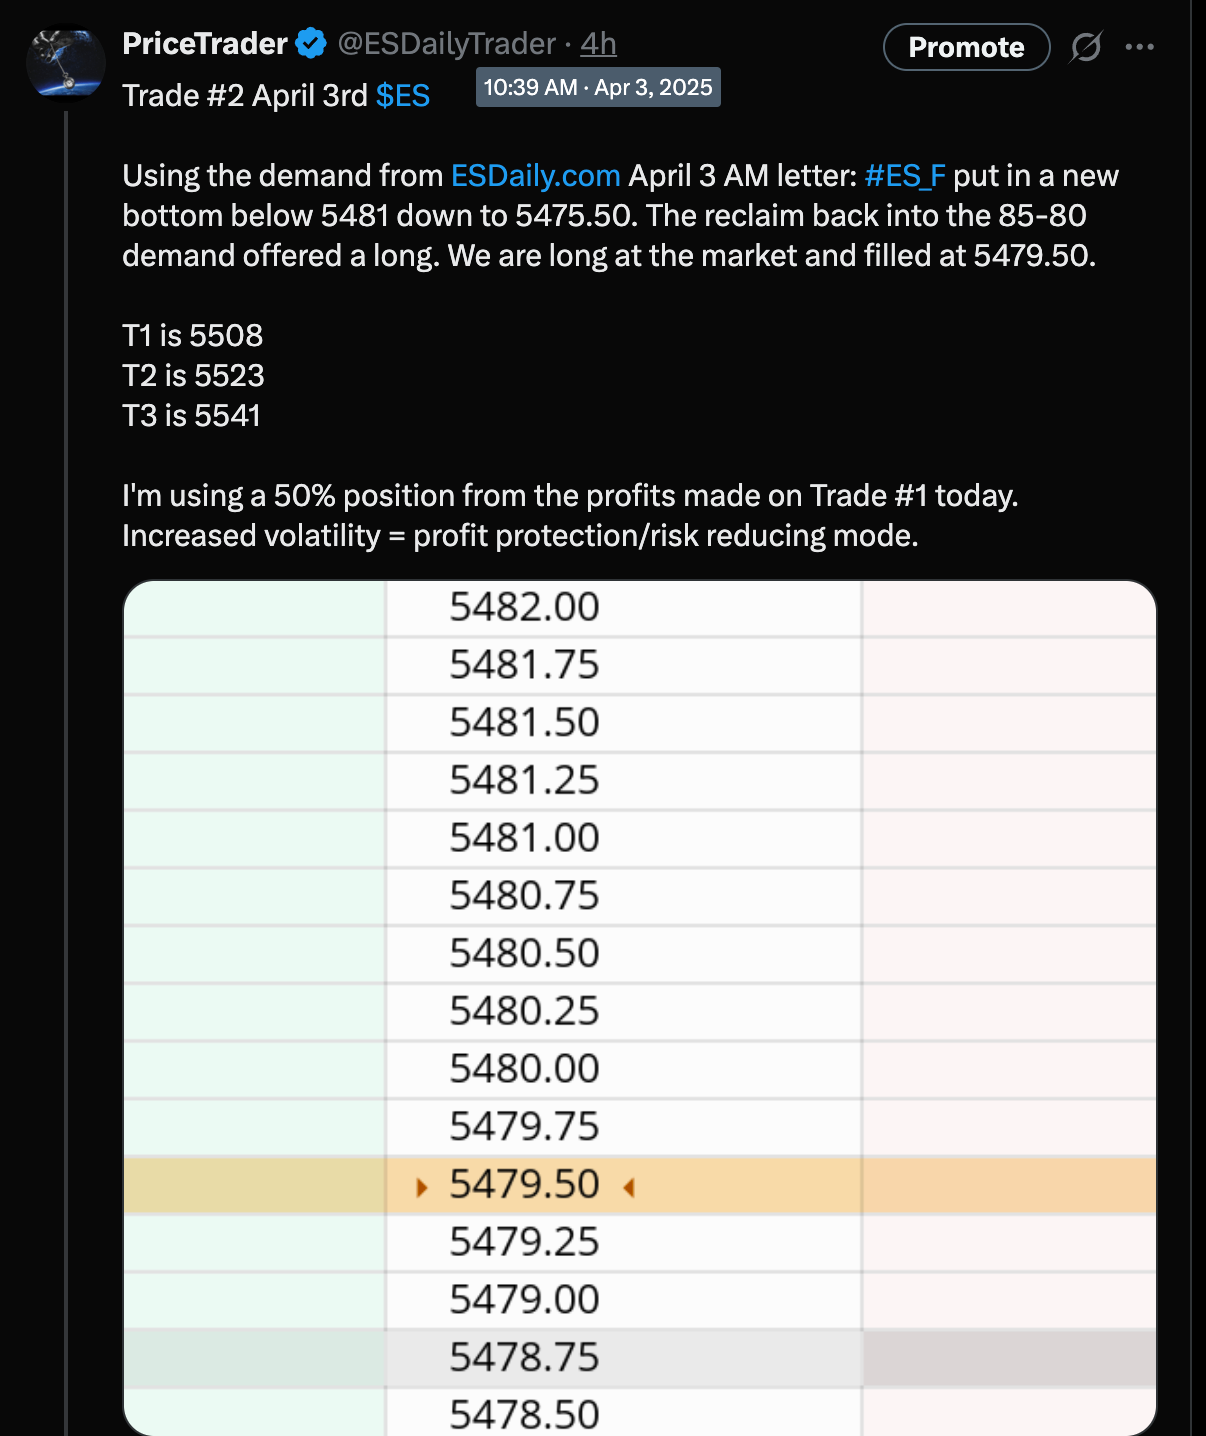
“The reclaim back into the 85-80 demand offered a long. We are long at the market and filled at 5479.50.”
Though it took longer than Trade #1, we hit T1, taking 70% by 12:04 PM.
I noted:
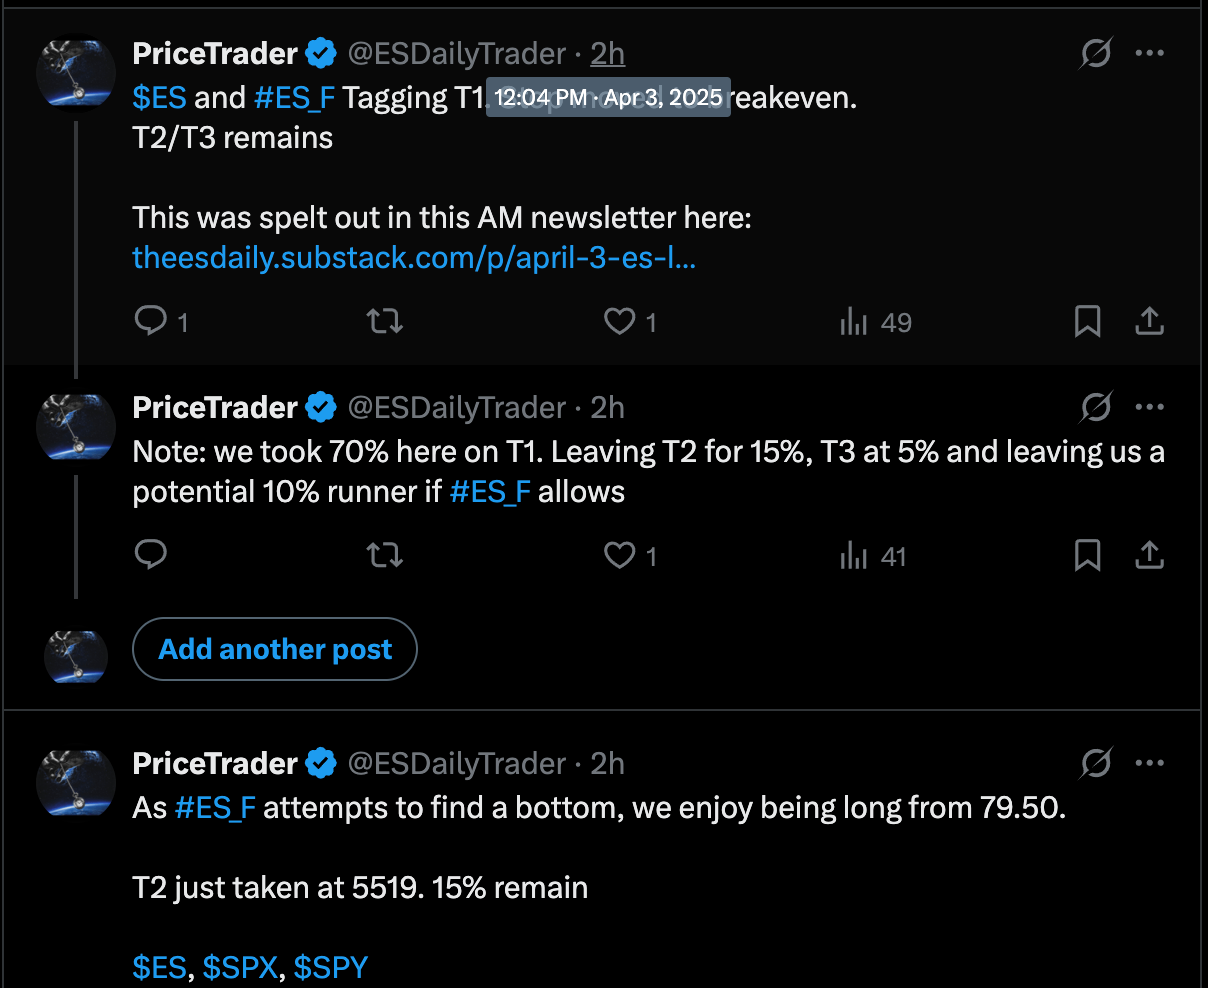
By 12:33 PM T2 was taken at 5519 (15%), and we ultimately came back and stopped out at 5480 on the remaining 15%.
By 1:30PM EST I was done trading for the day, and started piecing together this afternoon letter to give as much input as possible.
At 1:30PM, I wrote:

April 4th - 2 Trades
Trade#1 - 5230 LTB for T1, stopped at BE
Trade #2 - 5210 breakdown for T1&T2, stopped at BE
In the April 4 newsletter I wrote (after the selling commenced)
Every move is not an opportunity
People are fairly simple creatures when it comes to the following emotions:
Greed
Fear
Desire
Content
Hope
Despair
Anxiety
It is my purpose of ESDaily to eliminate all of those and trade using a system.
Our job isn’t to catch 300 points on the ES in a day like today.
Only take the Grade A+ setup ES offers a few times a day.
We need to take a PIECE of the action, not get all of it…
It is a system.
This preceded my opportunity section which said:
In terms of direct bid/asks
Above 5267/5327 offer a reclaim long. I’m not huge on knife catching, but we can look for price to find our support/demand areas, accept and buy on reclaims above the area.
A new low of 5210 offers a breakdown short. Remember, failed breakdowns make up a huge component of our trading strategy, but one could issue a sell direct on a breakdown from this area to the 5195 support.
Both worked.
Here’s what an hourly chart looks like right now:
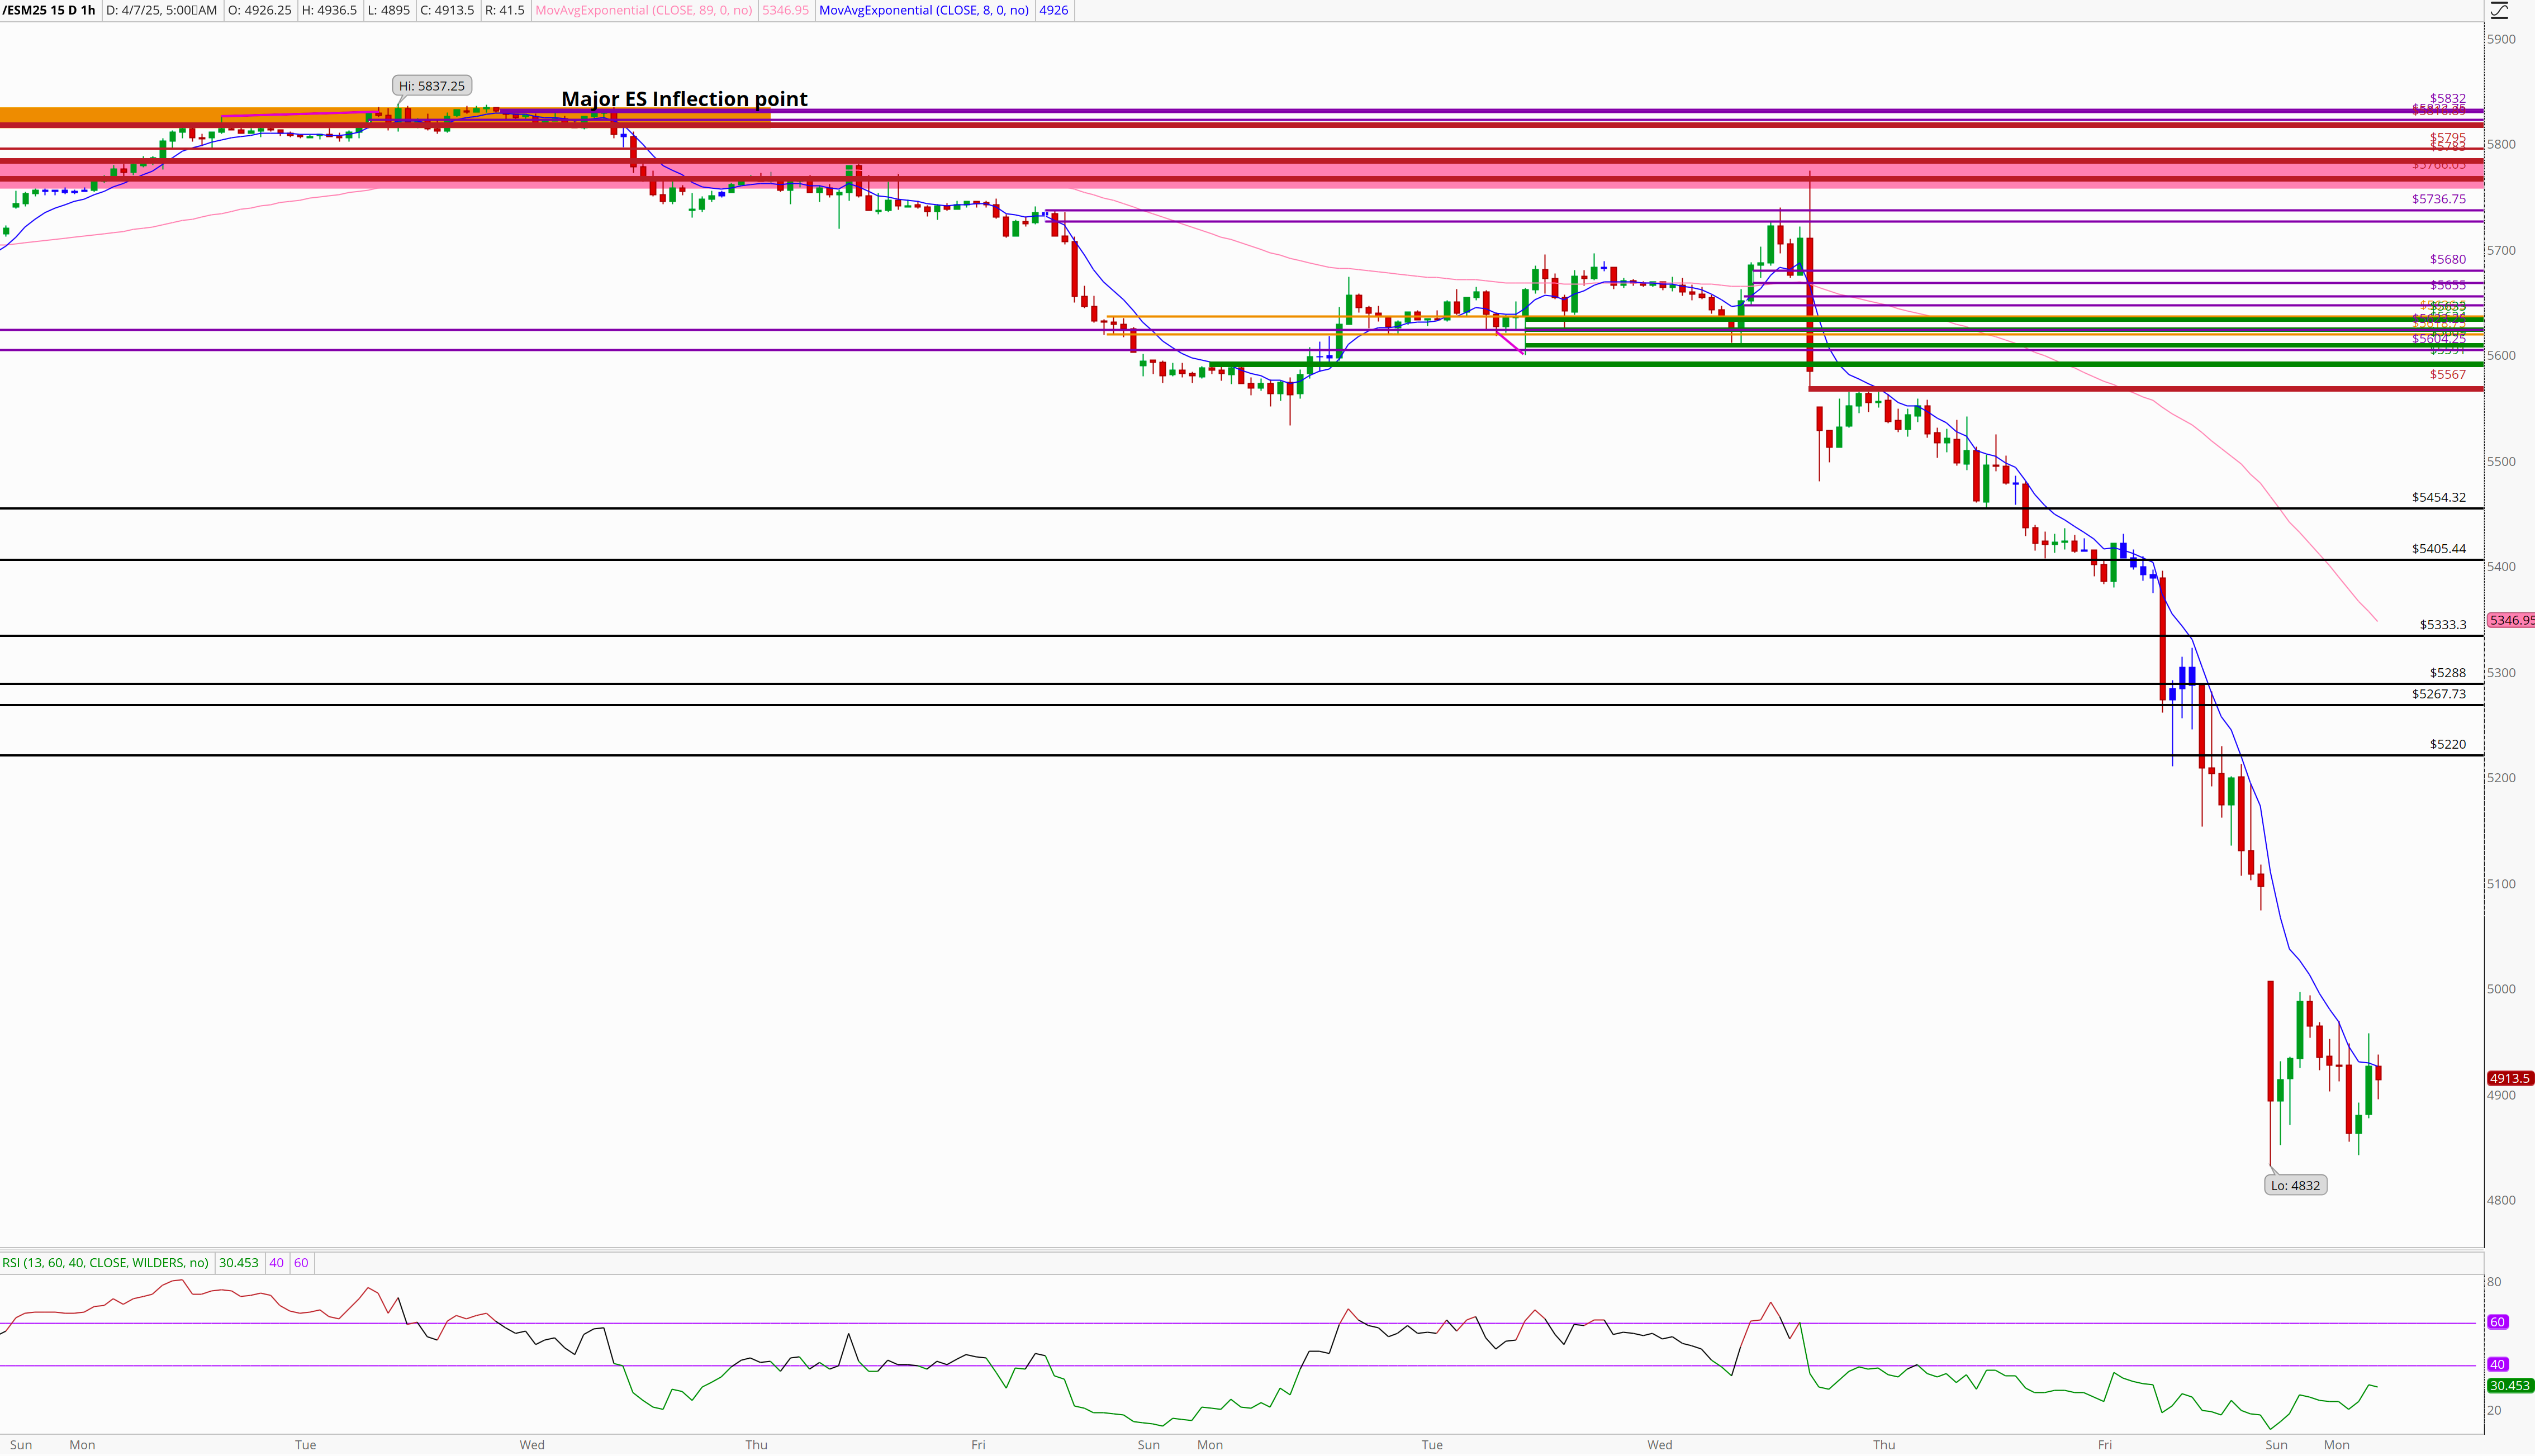
ES gapped down Sunday evening from the 5100 close and found a bottom in the 6PM hour at 4832. Since then we’ve attempted to form a bottom oscillating between the low of last night and the open of last night.
From 7PM-9PM last night we’ve gotten the largest rally since the selling began. We came down and tested the 4832.
I wrote a note on X.com last night:
4878 was flushed, reclaimed and we are now printing 4918. We formed some small demand here on the 15 min chart between 78 and 41.
In times like this, where we seeing massive selling, I can’t stress enough the importance of not falling into the retail trap…. thinking you need to trade more than you do.
Don’t go seeking more action unless it fits the plan.
We need to take a PIECE of the action, not get all of it.
…Remember, we may just be provided 1 great opportunity a day. We don’t need multiple.
If we nail it, cool.
If we miss it, cool.
Our job is to identify opportunities before they happen, and then execute.
So where does the next "piece” come in as opportunity?
Critical Areas-
Below are ES levels I’m watching for Monday April 7
Support/Demand- Support is not the same this as demand. Demand is high quality institutional levels we can see on the chart. While we seek demand, we may find opportunities for longs using support/magnet levels. We can find “subprime” areas of opportunity that price may use as bouncing points. We always want to ensure momentum is on our side in this case. In the section below, you’ll see areas of interest. If I consider them Demand, you’ll see a (D) followed by price.
Likely Supports For 4/7 are: 4875, 4855, 4839, 4820,4806, 4800, 4787
Resistance/Supply- Supply is not the same this as resistance. Supply is high quality institutional levels we can see on the chart. While we seek supply, we may find opportunities for shorts using resistance/magnet levels. We can find “subprime” areas of opportunity that price may use as bouncing points. We always want to ensure momentum is on our side in this case. In the section below, you’ll see areas of interest. If I consider them Supply, you’ll see a (S) followed by price.
Likely Resistances For 4/7 are: 4871, 5006, 5049, 5072, 5087-5110(S), 5127, 5135, 5162, 5194, 5205, 5212,
In terms of direct bid/asks
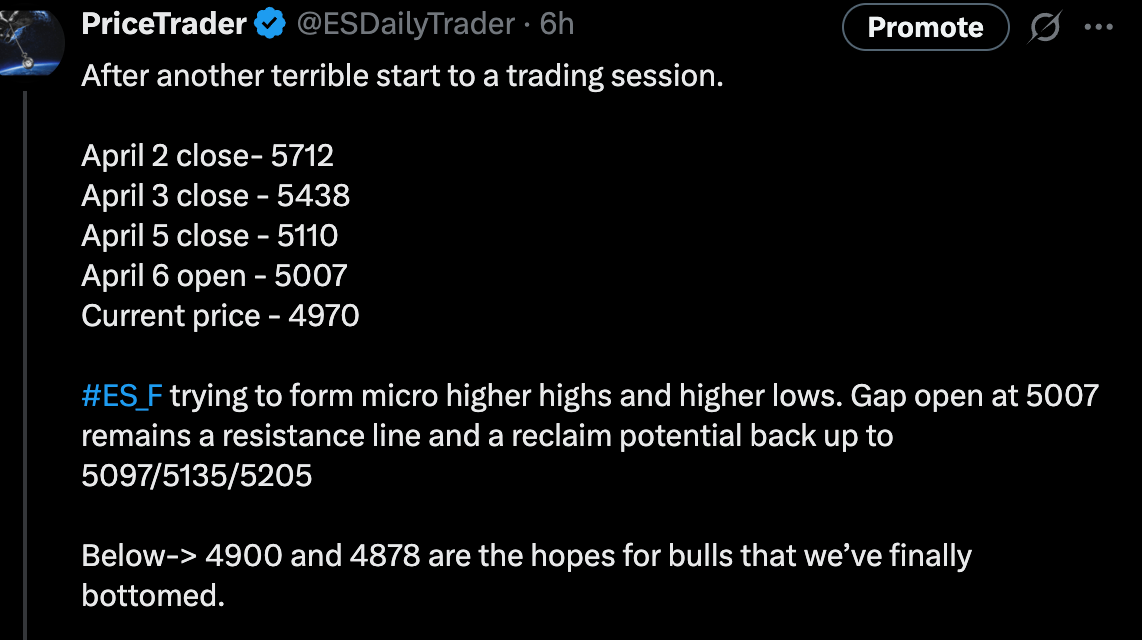
Gap open at 5006 remains a resistance line and a reclaim potential back up to 5097/5135/5205
A new low of 4832 offers a breakdown short. Remember, failed breakdowns make up a huge component of our trading strategy, but one could issue a sell direct on a breakdown from this area to the 5195 support.
See the momentum rules here:
No need to be a hero and bottom pick.
Note: these are very much so “historic” times. Expect violent sells to continue, reclaims everywhere, extraordinary squeezes, and whipsaws. There is zero reason to trade unless we have a great opportunity. Small levels are likely to be blown through. Size down, lessen your risk.
It’s times like these it’s very easy to blow accounts.
I don’t see myself trading much today unless there’s a Grade A+ setup. But for those that do, please please please…. limit your size and pick your spots, following the profit taking system.
Remember, our job is to protect our capital, not catch highs and lows and swing for the fences.
We’ll have to wait and see what price delivers today
As always, stick to the plan.
Trade like a Robot, let’s make it a great Monday
-PT