
ES Opens At Apr. 9th Gap Down, Sells off 105 Points, Fills the Gap, Rallies, Before Giving It All Back. We're Long from 5400.25
Precision here on ES amongst all the chop

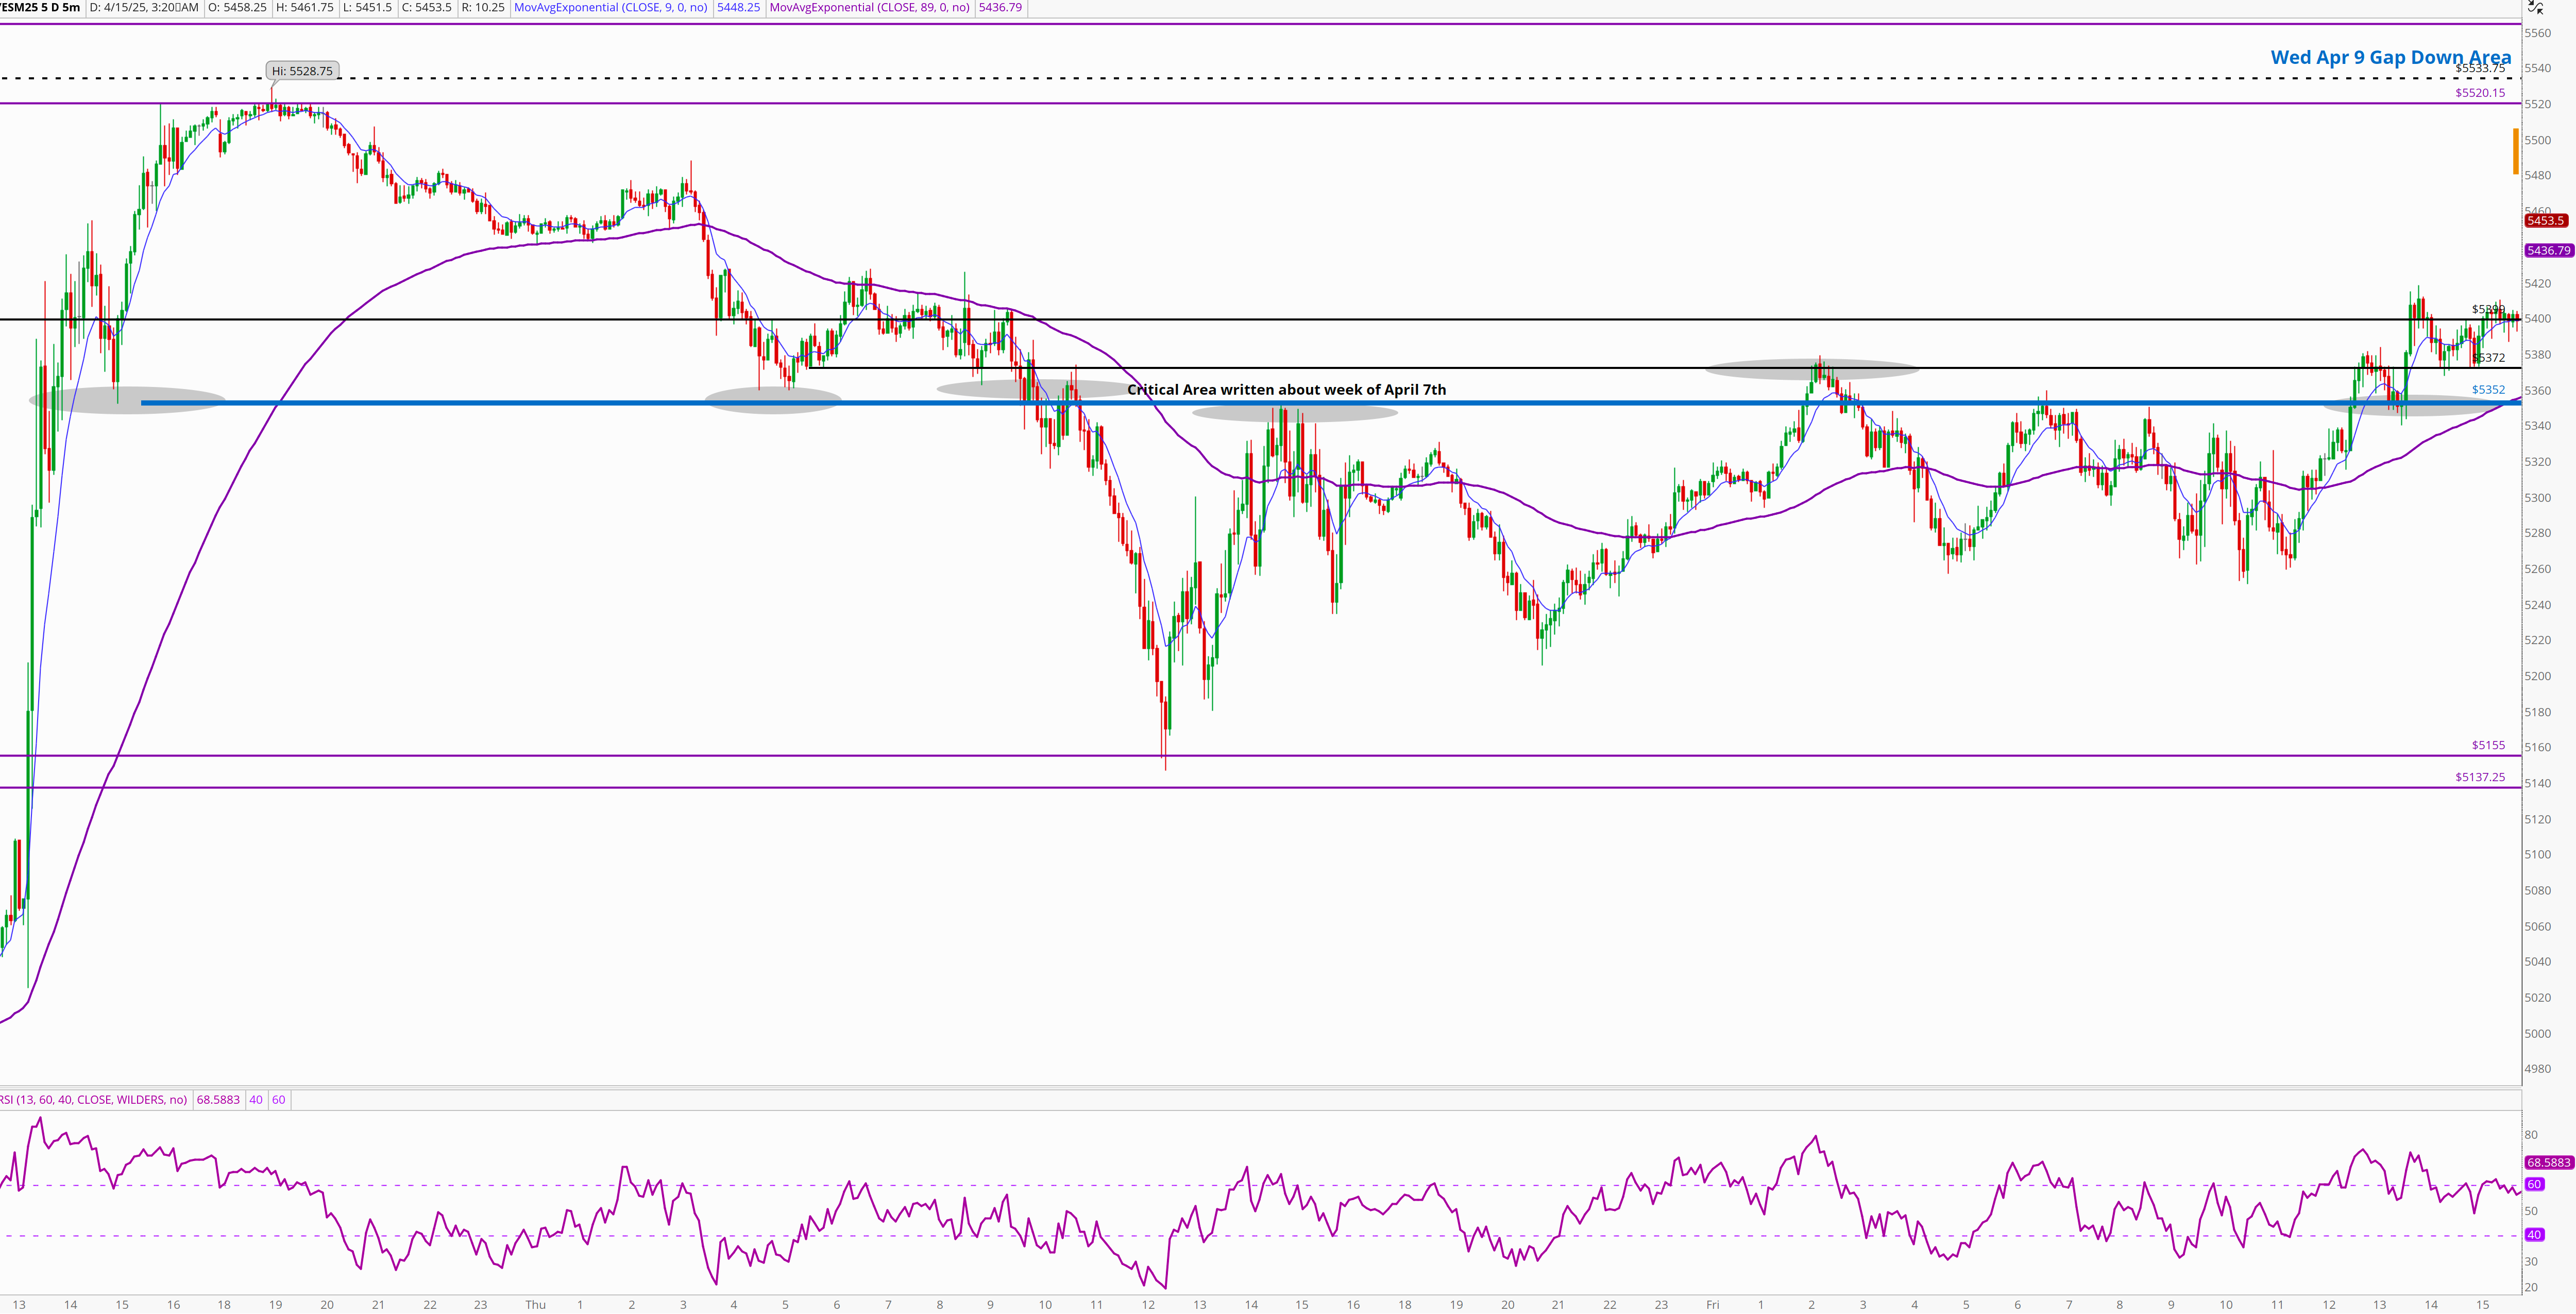
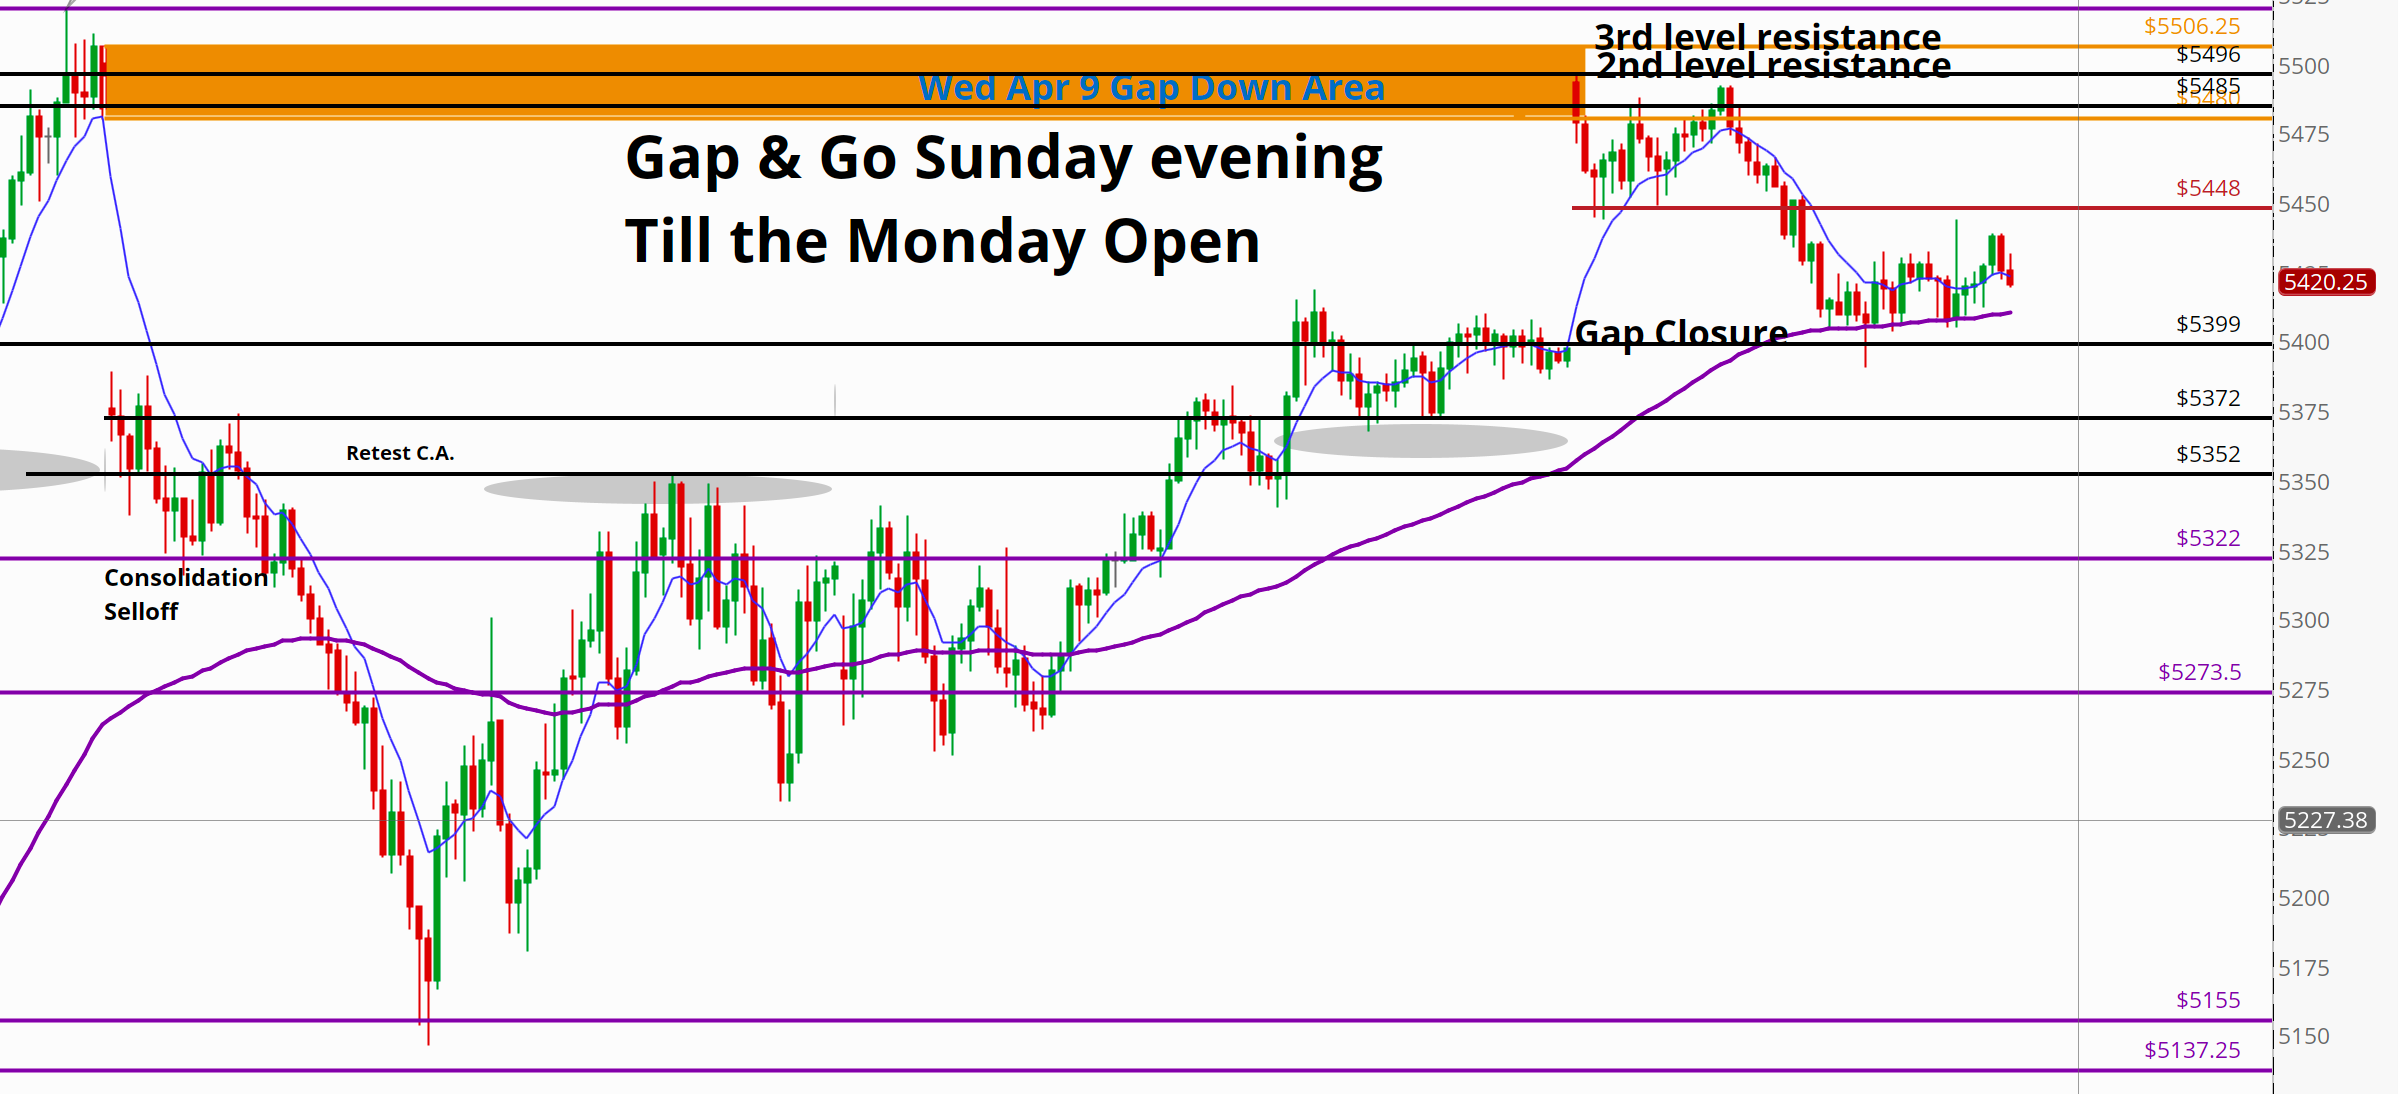
Last week 5352 was a level written about extensively. On Wednesday April 9th,
It was the low of the only pullback of the day before rallying 176 points, and was an initial support level from April 4.
It was the low of the early Thursday morning selloff before we bounced ~60 points.
It was the consolidation shelf Thursday at 8:30 before we sold off 200 points.
Upon retest it sold another 145 points.
Friday we used it multiple times as a high point as we built out structure for the next leg. and finally…
Friday at 1:30 it was the launch point that led us to our high Monday April 14, at 5496.
You can see the area and notes on the chart below:
During periods of chop, ES will often anchor to a single price — a “magnet” level.
And despite the wild 1000-point swings we saw in the back half of last week, that’s exactly what played out: a massive, mind-numbing range between 5146 and 5520. Big moves, yes — but still chop. Just with a wide lens.
Magnet levels aren’t random. They’re built off prior structure — key support and resistance zones that have already proven themselves. In choppy conditions, price treats these levels like home base: tagging them again and again, using them as both support and resistance depending on the context.
This time, that level was 5352.
Over just 2.5 sessions, ES hit 5352 twelve separate times. Price would rip 200+ points away, overshoot the next level, then snap right back. Again and again. That’s a magnet in action — not directional, just gravitational. And when markets are in flux, recognizing that can save you from forcing trades that simply aren’t there.
For bulls, it’s a good thing yesterday’s selloff didn’t seek out this magnet.
Let’s dive into yesterday’s price action a bit more…
I included two charts for reference. The first is After Trading Hours (ATH) and Regular Trading Hours (RTH).
I generally use a 23/5 chart seeing all Globex price action but when it comes to gaps, it’s cleaner sometimes to see the RTH chart, when most volume comes in.
Note: What you’re really looking at when you open a chart isn’t just price — it’s human emotion, visualized. Every candle, every swing — it's fear, greed, panic, FOMO — all wrapped in time blocks. You can see the full emotional spectrum right here as the pendulum swings from one extreme to the other. There’s a lot packed into this chart. Take the time to digest it. Because when you learn to read the emotion behind the moves, you start to understand the why behind our core setups — and why discipline isn’t optional. It’s everything.
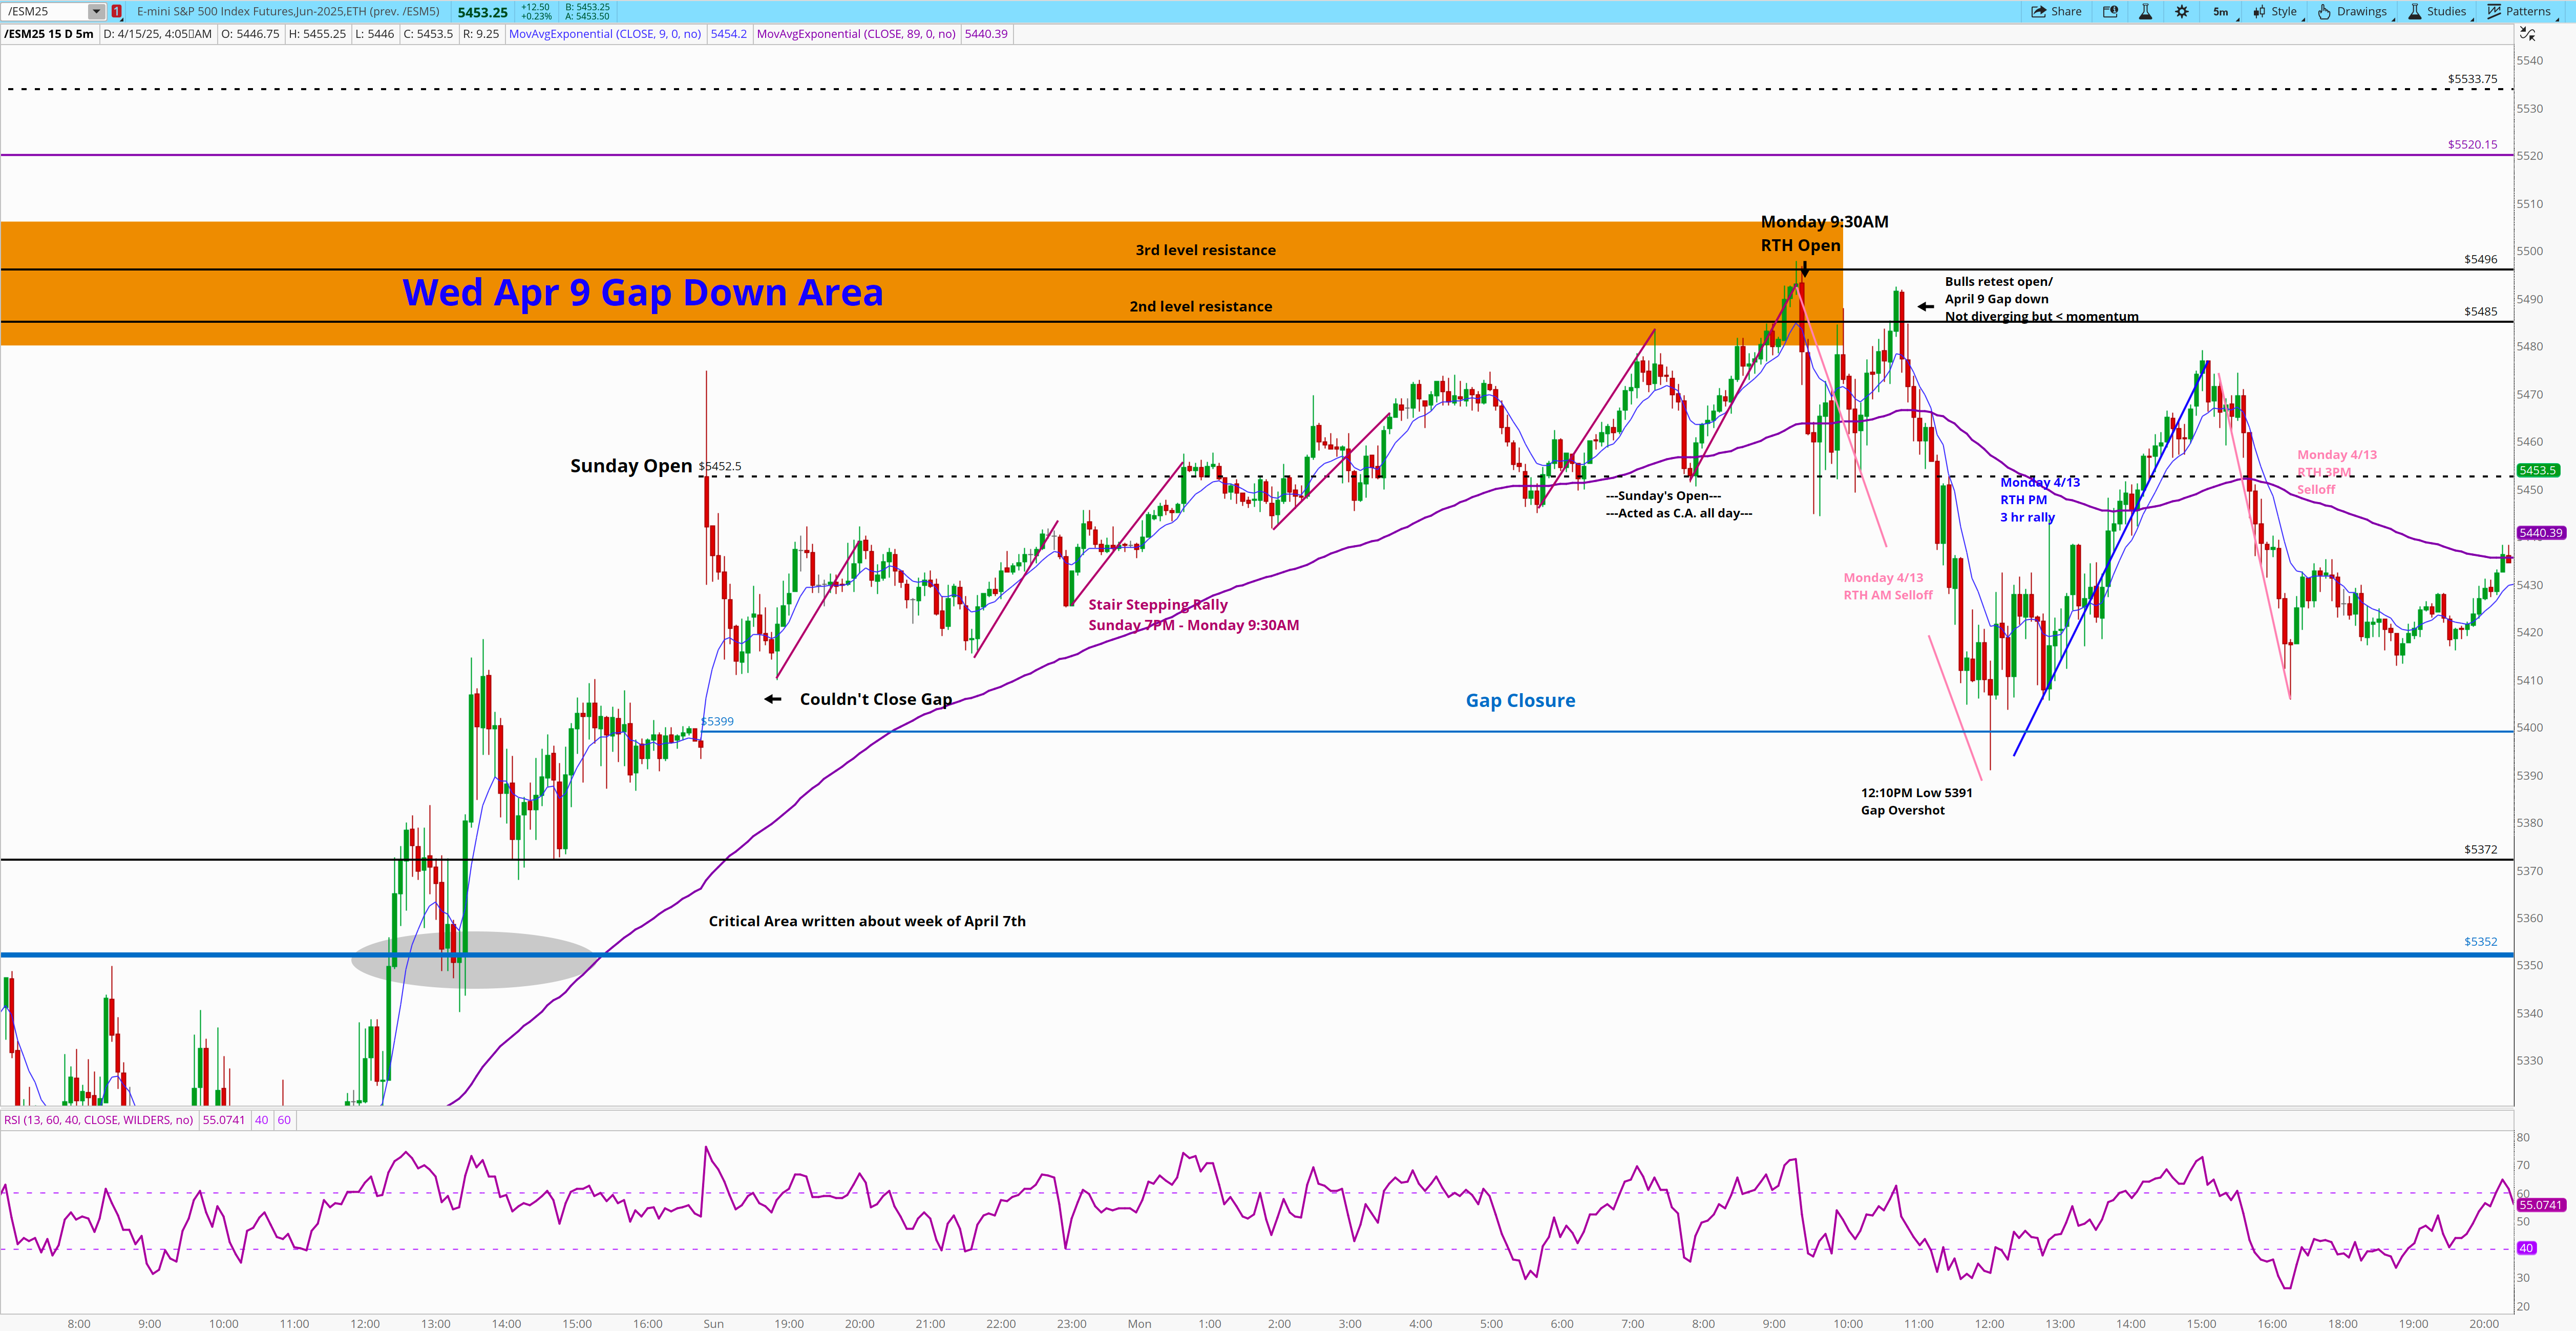
We opened Sunday with a small gap up at 5452, rallied to 5474, then sold off 5410 in the first hour of trading. By 7PM EST Sunday, April 13th, we bottomed but we failed to close the gap at 5399. An impressive bull stair-stepping rally is what we got, with the green impulses growing in size and strength — right up til the 9:30AM EST bell hit.
At 9:24AM yesterday morning, I posted this on X.
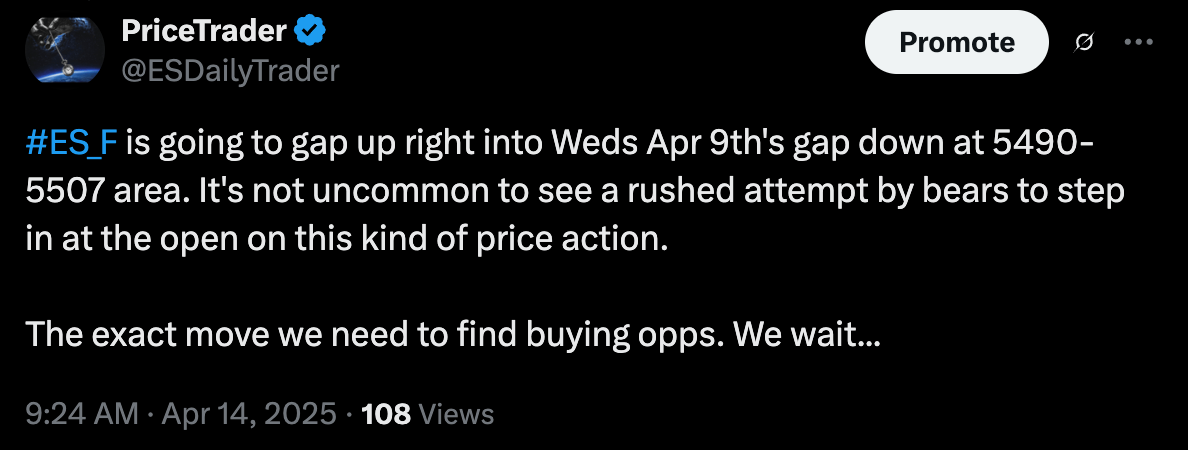
Greed started to overcome some of the bulls, even on a micro level, as we rallied for 14 straight hours, bidding up every pullback. First level supports were respected and there was just a single instance of price breaking a low. It did so — by a tick at 5:45AM before we went on to make a new, overnight high of the rally. Point is, bulls were absolutely in charge. Between 8:30AM and 9:15AM price hovered and tested, sold off a few points — but was glued to the 1st level resistance point noted in April 14 AM newsletter, 5385. 9:15AM we had the leg up into level 2 resistance, then had a narrow trading window until the 9:30AM bell. I wrote this in the AM newsletter
Likely Resistances For 4/14 are: …. 5485, 5496,
These played out rather well.
You can see price opened up right inside the yellow rectangle, the April 9 Gap Down. We moved as high as 5496.50 at the 9:30AM open. Within 15 minutes we sold off 52 points. This selloff overshot the 5452 critical area down to 5444, reclaimed it (this is where we took Trade #1 of the day) bounced 35 points, came back to 5449. Bulls stepped in here creating a higher low, then gave it a final attempt at 5496. We only got up to 5492. Then, the bull buying stopped.
In attempt to create new highs, seeing failure likely on small time frames…I wrote this at 8:52AM:
2nd test at our 5485 resistance now. As we negatively diverge here, bears need a push below 5448 to attempt a gap closure.
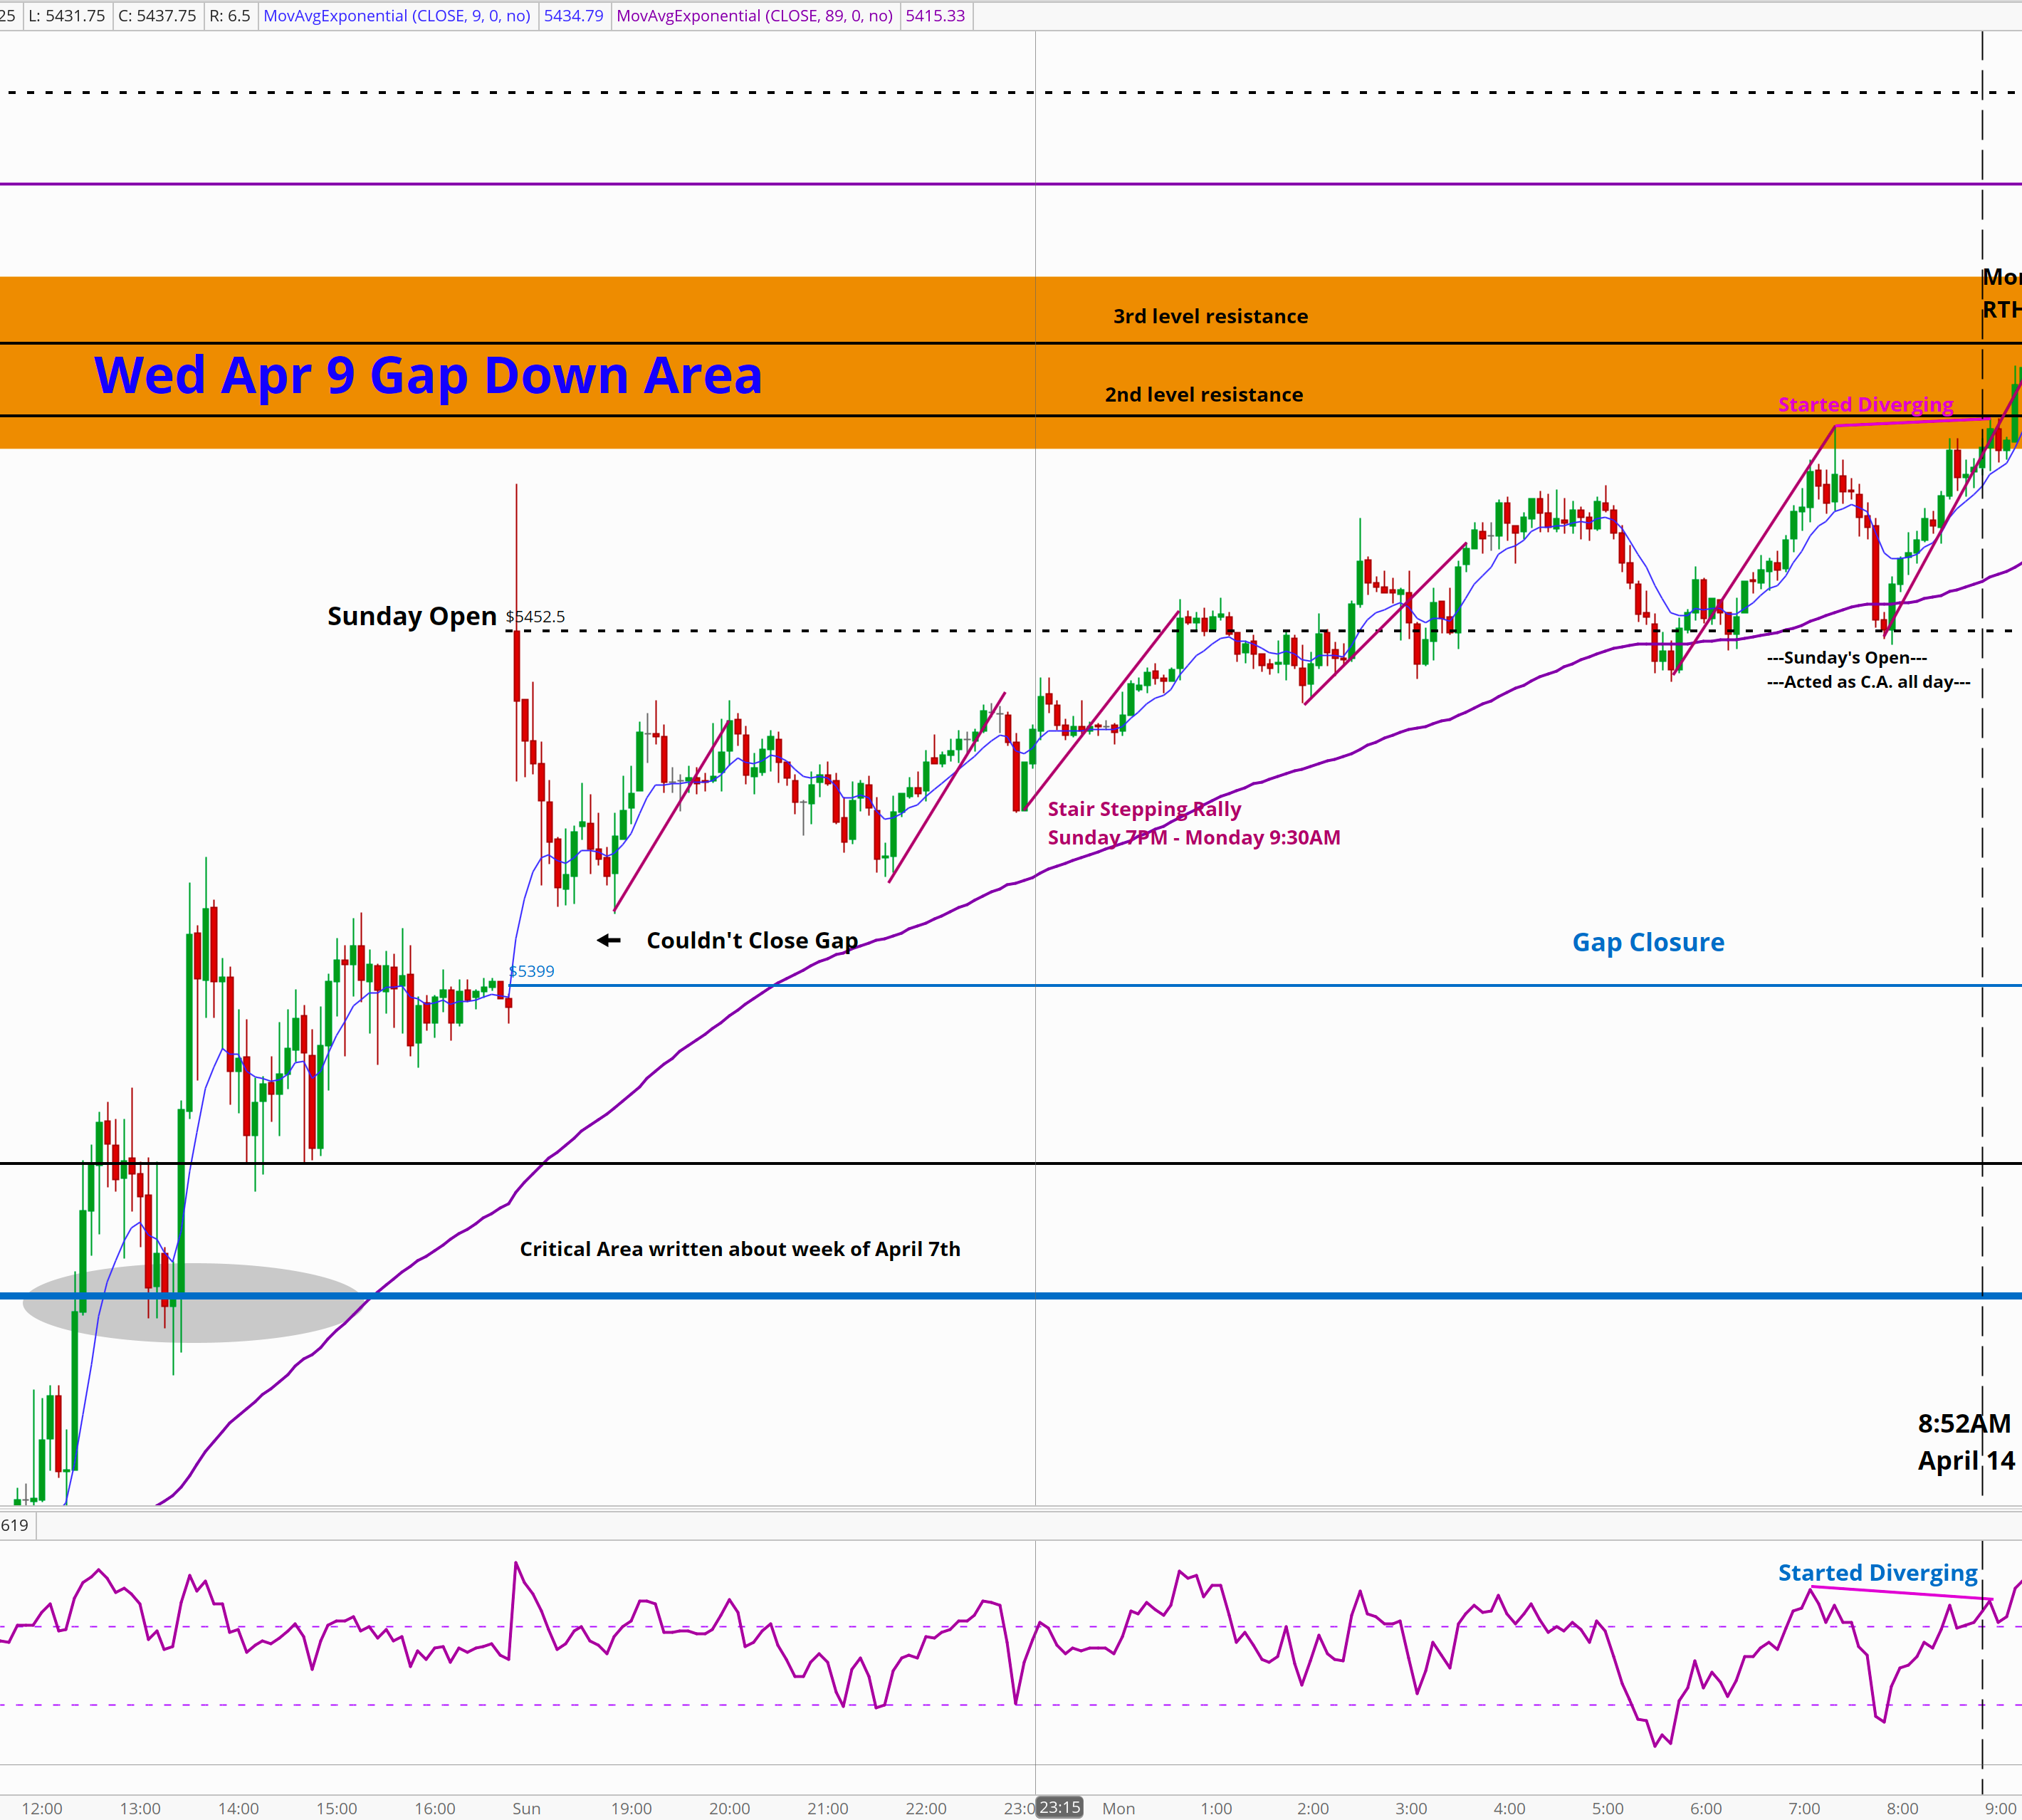
The small time frame diverging, gave us the signal that reversal was starting. The open, 38 minutes later, was the proof. We sold down to ~5448 and was was the low until 11:25AMEST.
Note: the 8:52 remark where I stated “bears needed below 48 to get going”.
Once it broke, we sold off hard. Within the first 3 hours of trading, we closed the gap, putting in an intraday selloff of 105 points.
Chart below is RTH only
The gap fill closure brought back-to-back trade opportunities for us.
In the Apr 14 newsletter I wrote:
Likely Supports For 4/14 are: …. 5399 (Gap closure)…..
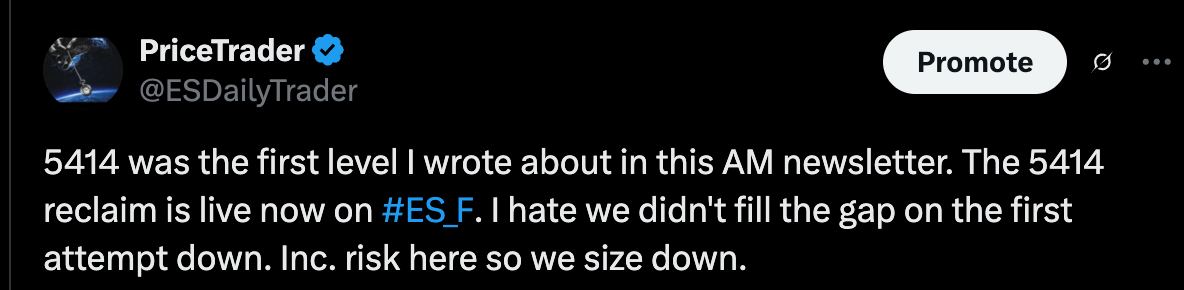
5414 looks like the first available failed breakdown potential Friday’s high and used as support in the overnight session twice. We could look to buy here on a reclaim above that area if we attempt to close the gap this morning.
After the first trade of the day (the 5452 reclaim filled at 50.75 explained below), we ran right down to 5404.75 and reclaimed the 5414 area. I took the trade for…
April 14 Trade #2 5414 Reclaim: Result - Partial Loss
Here’s the chart:
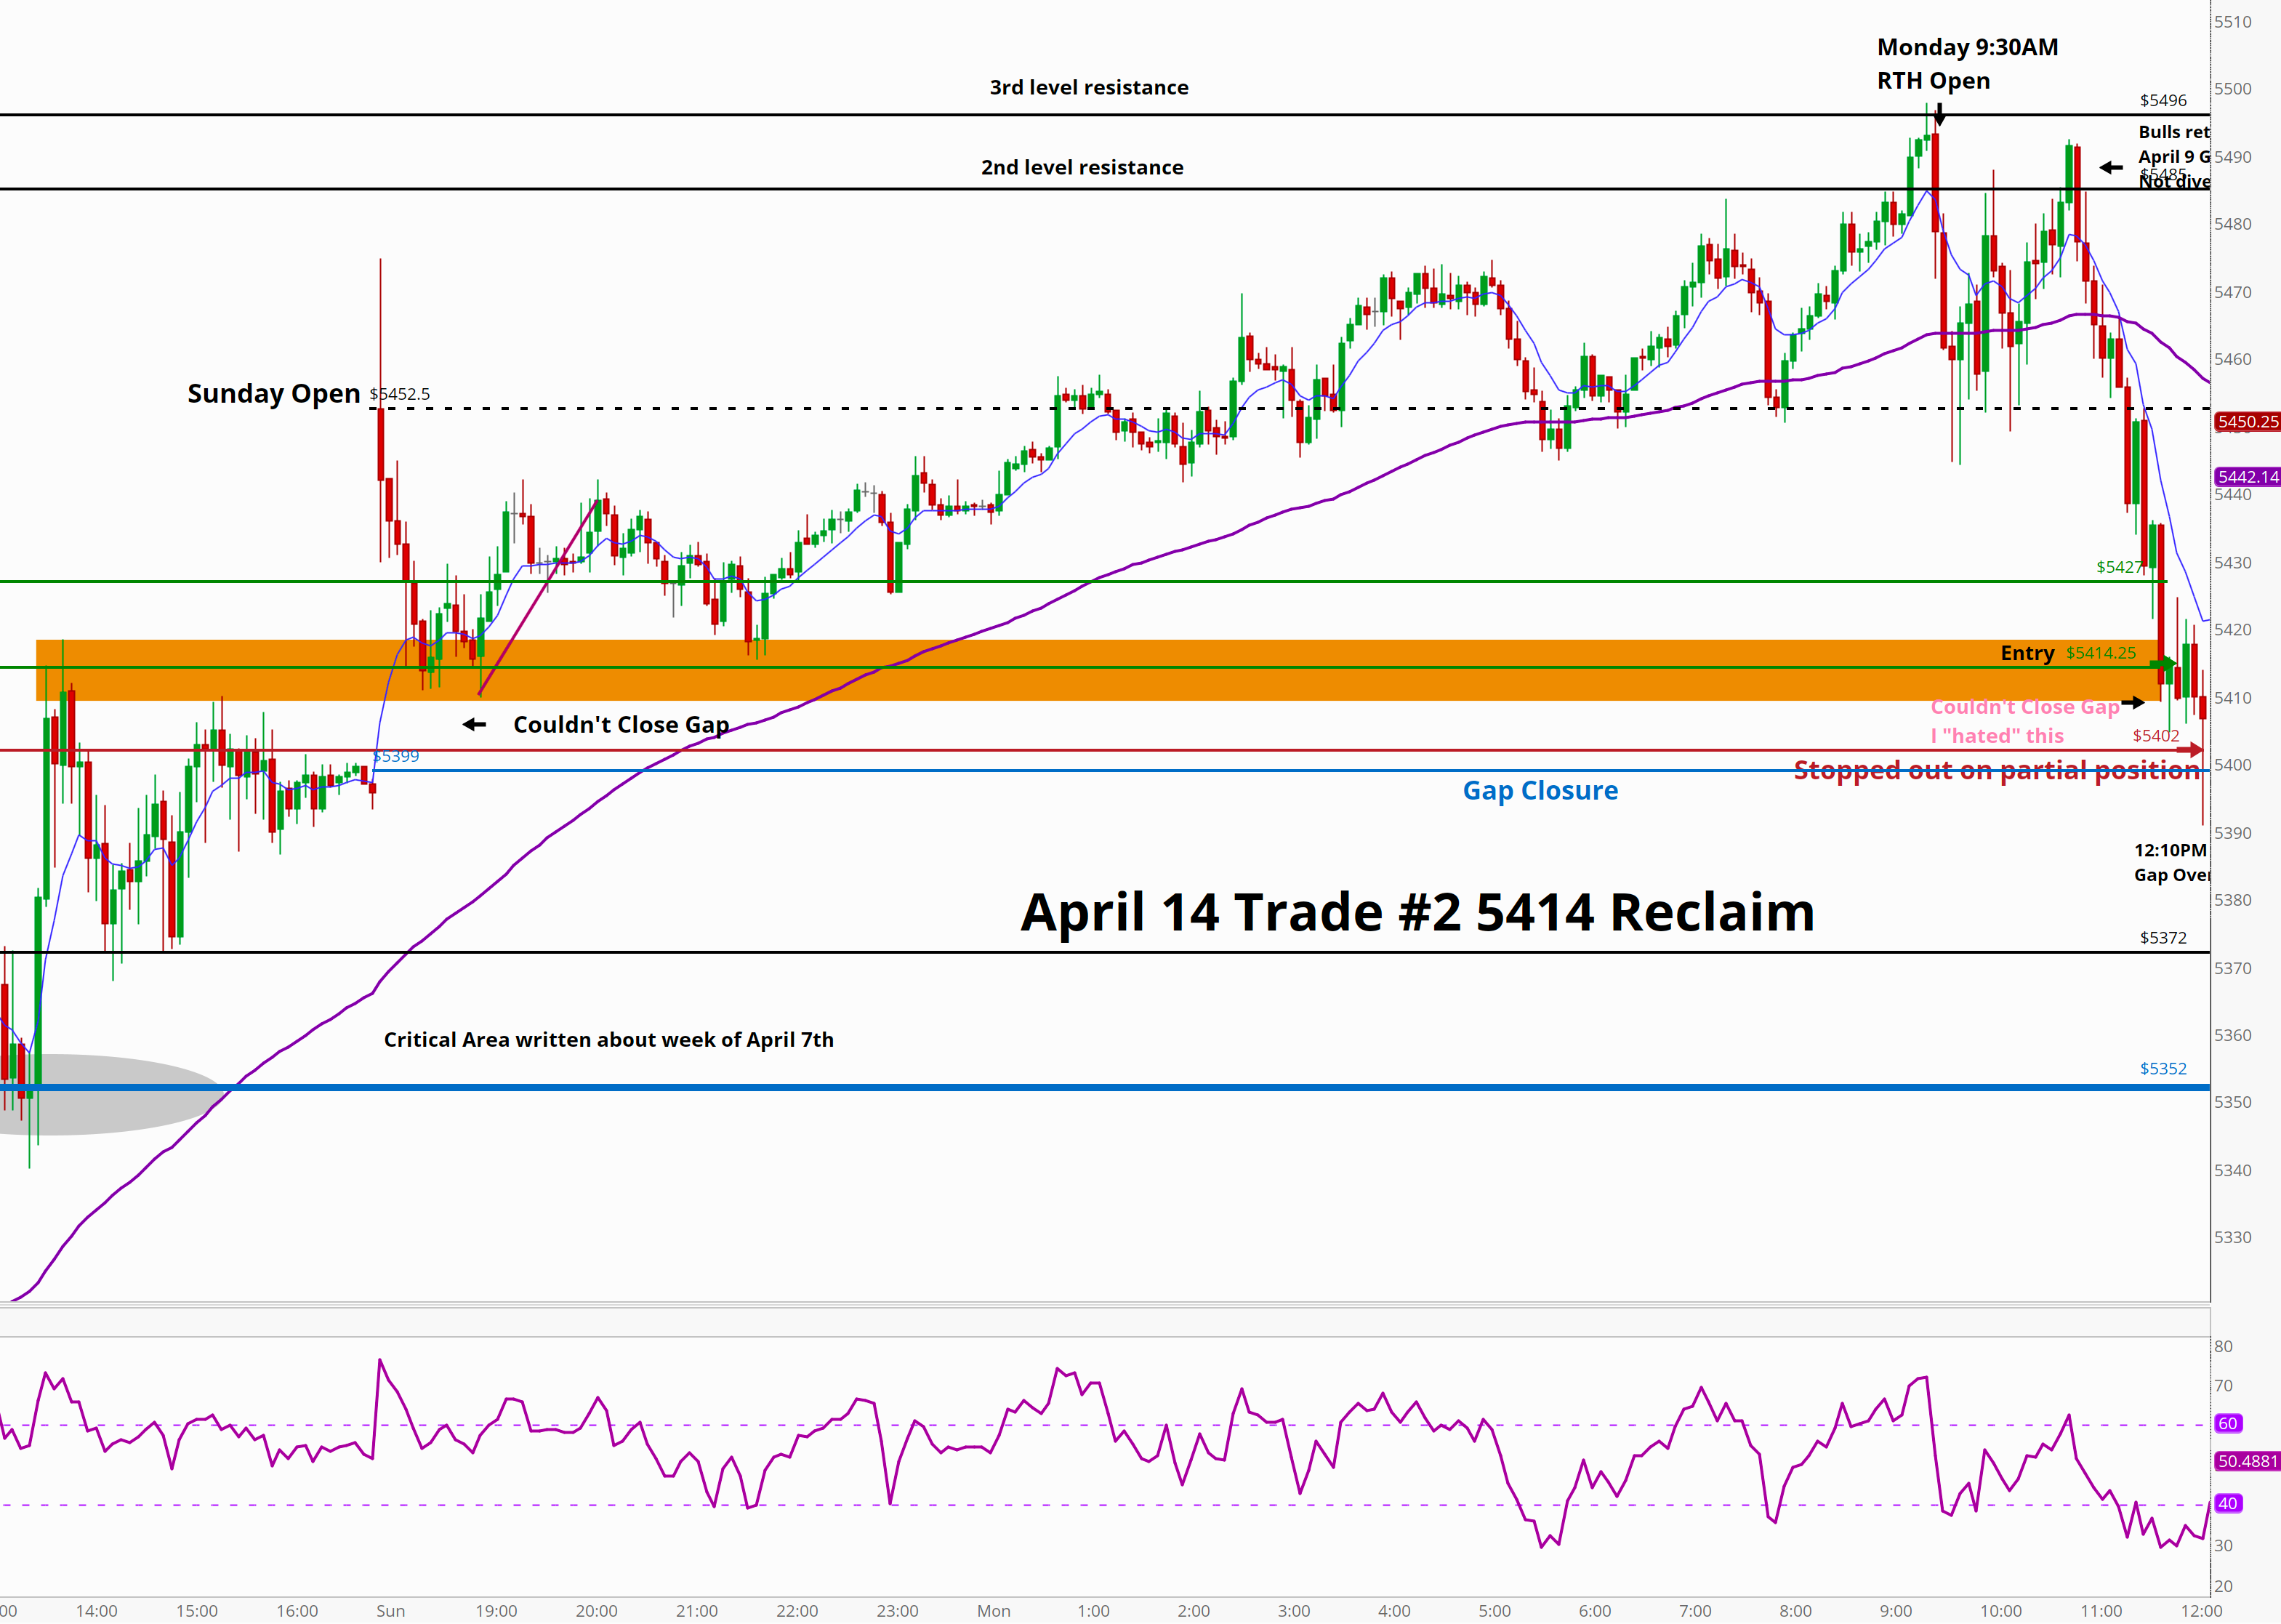
As price attempted to fill the gap up from Sunday we found ourselves, just above with 5414 as a major level I was looking at. The high range of Friday, gapped through and held as support multiple times. In theory, price would flush this area by 6-12 points, stabilize, reclaim, and move up to the next level of resistance.
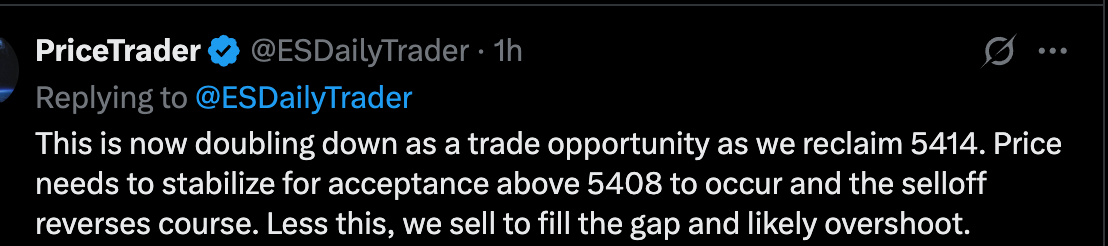
While I decided to take this trade as price bottomed initially at 5404 and reclaimed 5414, I noted:
I hated the fact the gap wasn’t closed here yet.
Sure enough, after popping to 5424 (within 3 points of our initial target), we sold off. This resulted in us stopping out for a 12 point loss on the partial (50%) position.
ES seeks out gap closures like non other, and it wasn’t going to let 5 points hold itself back after a 95 point sell.
Very important. Note: The fact we didn’t fill the gap, I warned of increased risk. Therefore we sized down.
Though we took the loss, we identified the inherent risk potential on ES wanting that gap closure. Our job is to take profits and reduce as much risk as possible. We did this here and did our job. The fact we hadn’t filled the gap, knowing ES seeks gap closures and overshoots, let us know the proper thing to do was size down the trade. That saved many ES points on this loss.
We then flushed the gap and overshot as anticipated.
We did in fact overshoot down to 5391. That was very short lived, as very little trading was done at the lows of the day. We stormed back towards the gap, reclaimed, bulls rushed in and we were filled for:
April 14 - Trade #3 of the day at 5400.50 Gap Closure Reclaim. Result T1-T4 hit, and a runner stopped.
When I say “back-to-back” trade opportunities, one could believe I got trigger finger. That I simply re-entered into the trade after being stopped out on the 5414 reclaim.
But that wasn’t the case.
These we’re preplanned levels and trade ideas I had spelt out hours before the market had opened. Well before we knew about the 105 point selloff.
They simply played out very quickly.
Here’s the chart and see how quickly it happened:
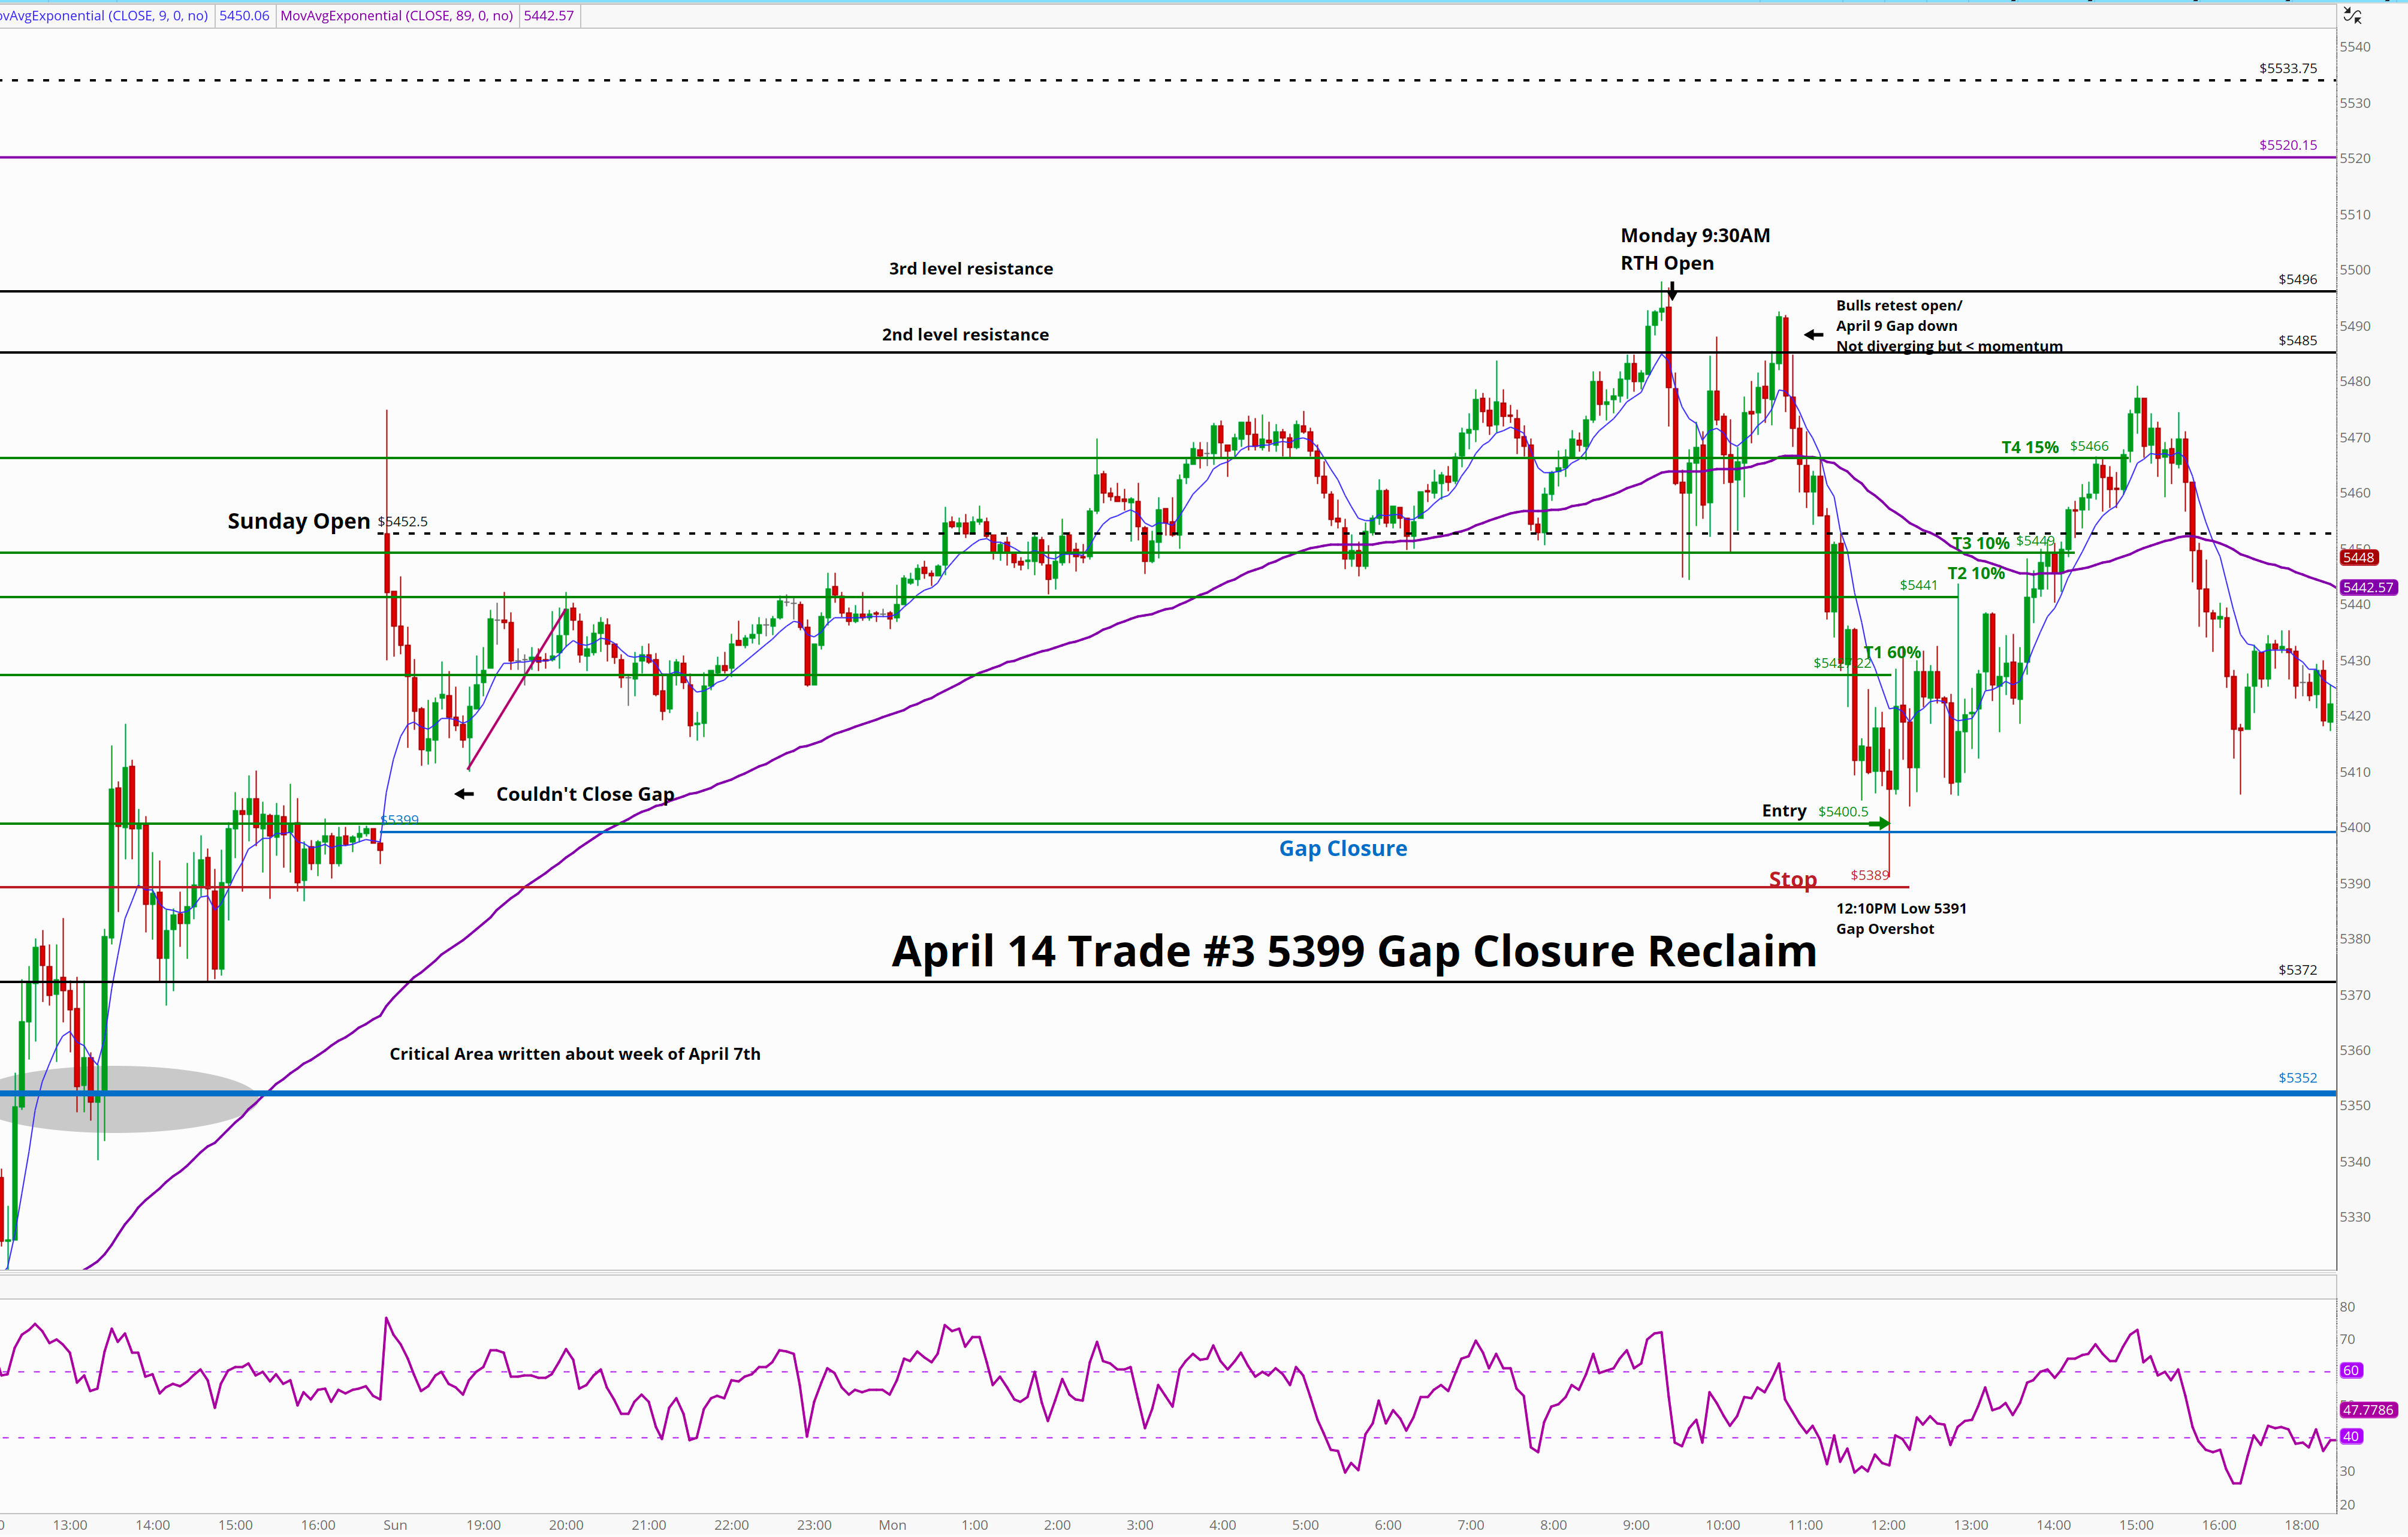
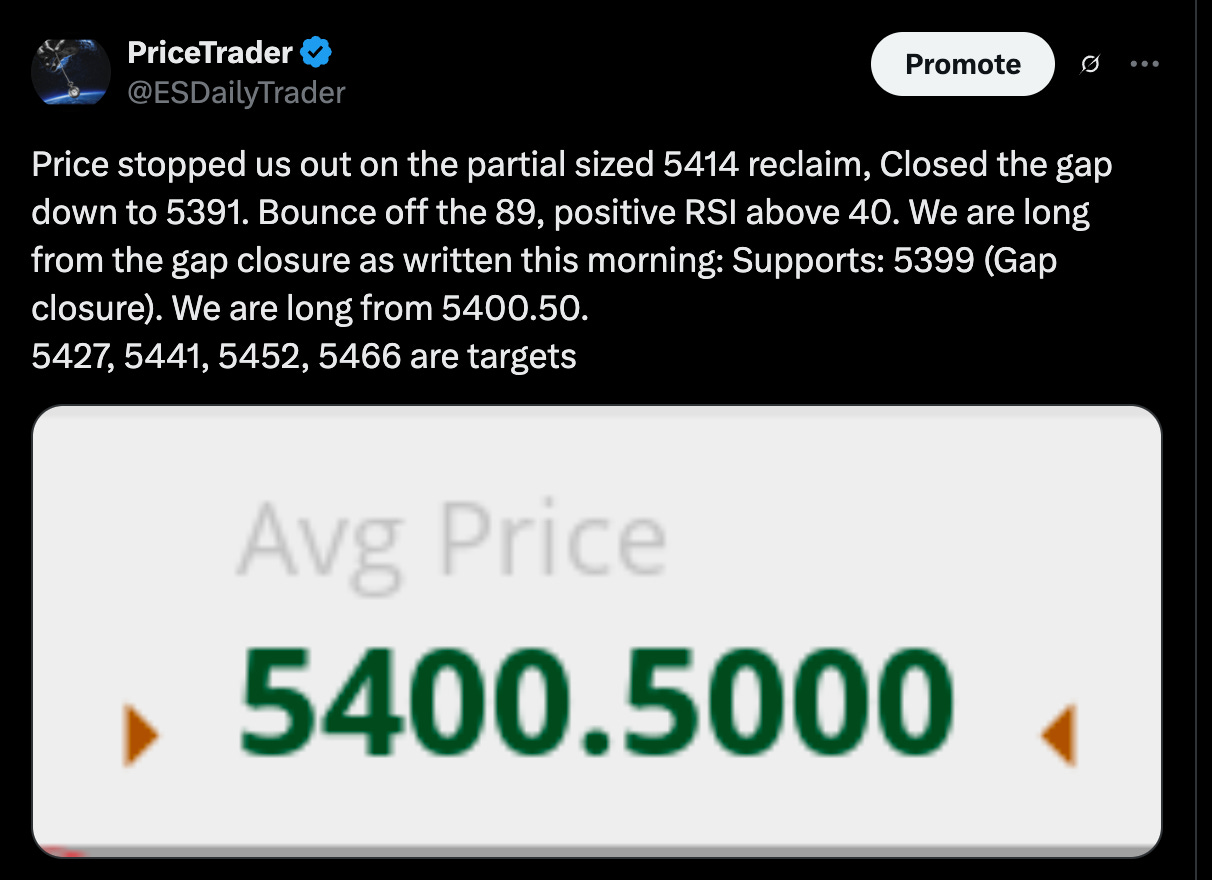
In short order, the bulls perked up. We popped from the gap to T1 at 5427 and T2 of 5441. As always, I took the majority of profits here on the 27 point rally of 60%, and another 10% on the 41 point rally. As we entered into the trade (around 12:12PMEST), I mentioned this on X:
By 2:46PM EST we’d hit T4 at 5466 and I wrote this as we carried a very small runner into the final hour of trading:
From there, as noted, we sold off back to 5406 are bears attempted to close the gap again. So far they’ve failed as price is currently back up around 5440.
It’s great having a plan —Waiting, watching the massive sell bring the opportunities, remain disciplined on entries and position sizing, and seeing it ALL come together.
Let’s get to today’s price action and opportunities
Keep reading with a 7-day free trial
Subscribe to ES Daily by PriceTrader to keep reading this post and get 7 days of free access to the full post archives.