
The Trapdoor That Never Opened
The Nasdaq fell 12%. The one line that would have confirmed a top never broke.

Every bull market has a trapdoor.
It’s not a price. It’s not a headline. It’s a line on a momentum oscillator that, when it breaks, tells you the character of the market has changed underneath your feet — usually weeks before price makes it obvious.
That trapdoor is the 40 line on weekly RSI.
In a genuine uptrend, momentum oscillates between roughly 40 and 80. Forty gets tested. It gets scared. It holds. That’s what an uptrend is, mechanically. And the day it finally gives way, the whole range shifts down — 60 becomes the ceiling, and every rally into it becomes a gift to sellers.
This market just fell twelve percent in six weeks. Chip stocks got destroyed. The Composite closed in correction territory. Sentiment went straight in the toilet.
And the weekly RSI?
It bottomed in the mid-fifties.
Not thirty-six. Not forty.
The trapdoor never opened.
So while everyone was busy drawing lower highs, this market was quietly telling anyone who bothered to look that it took a correction — and nothing more.
Here’s the evidence.
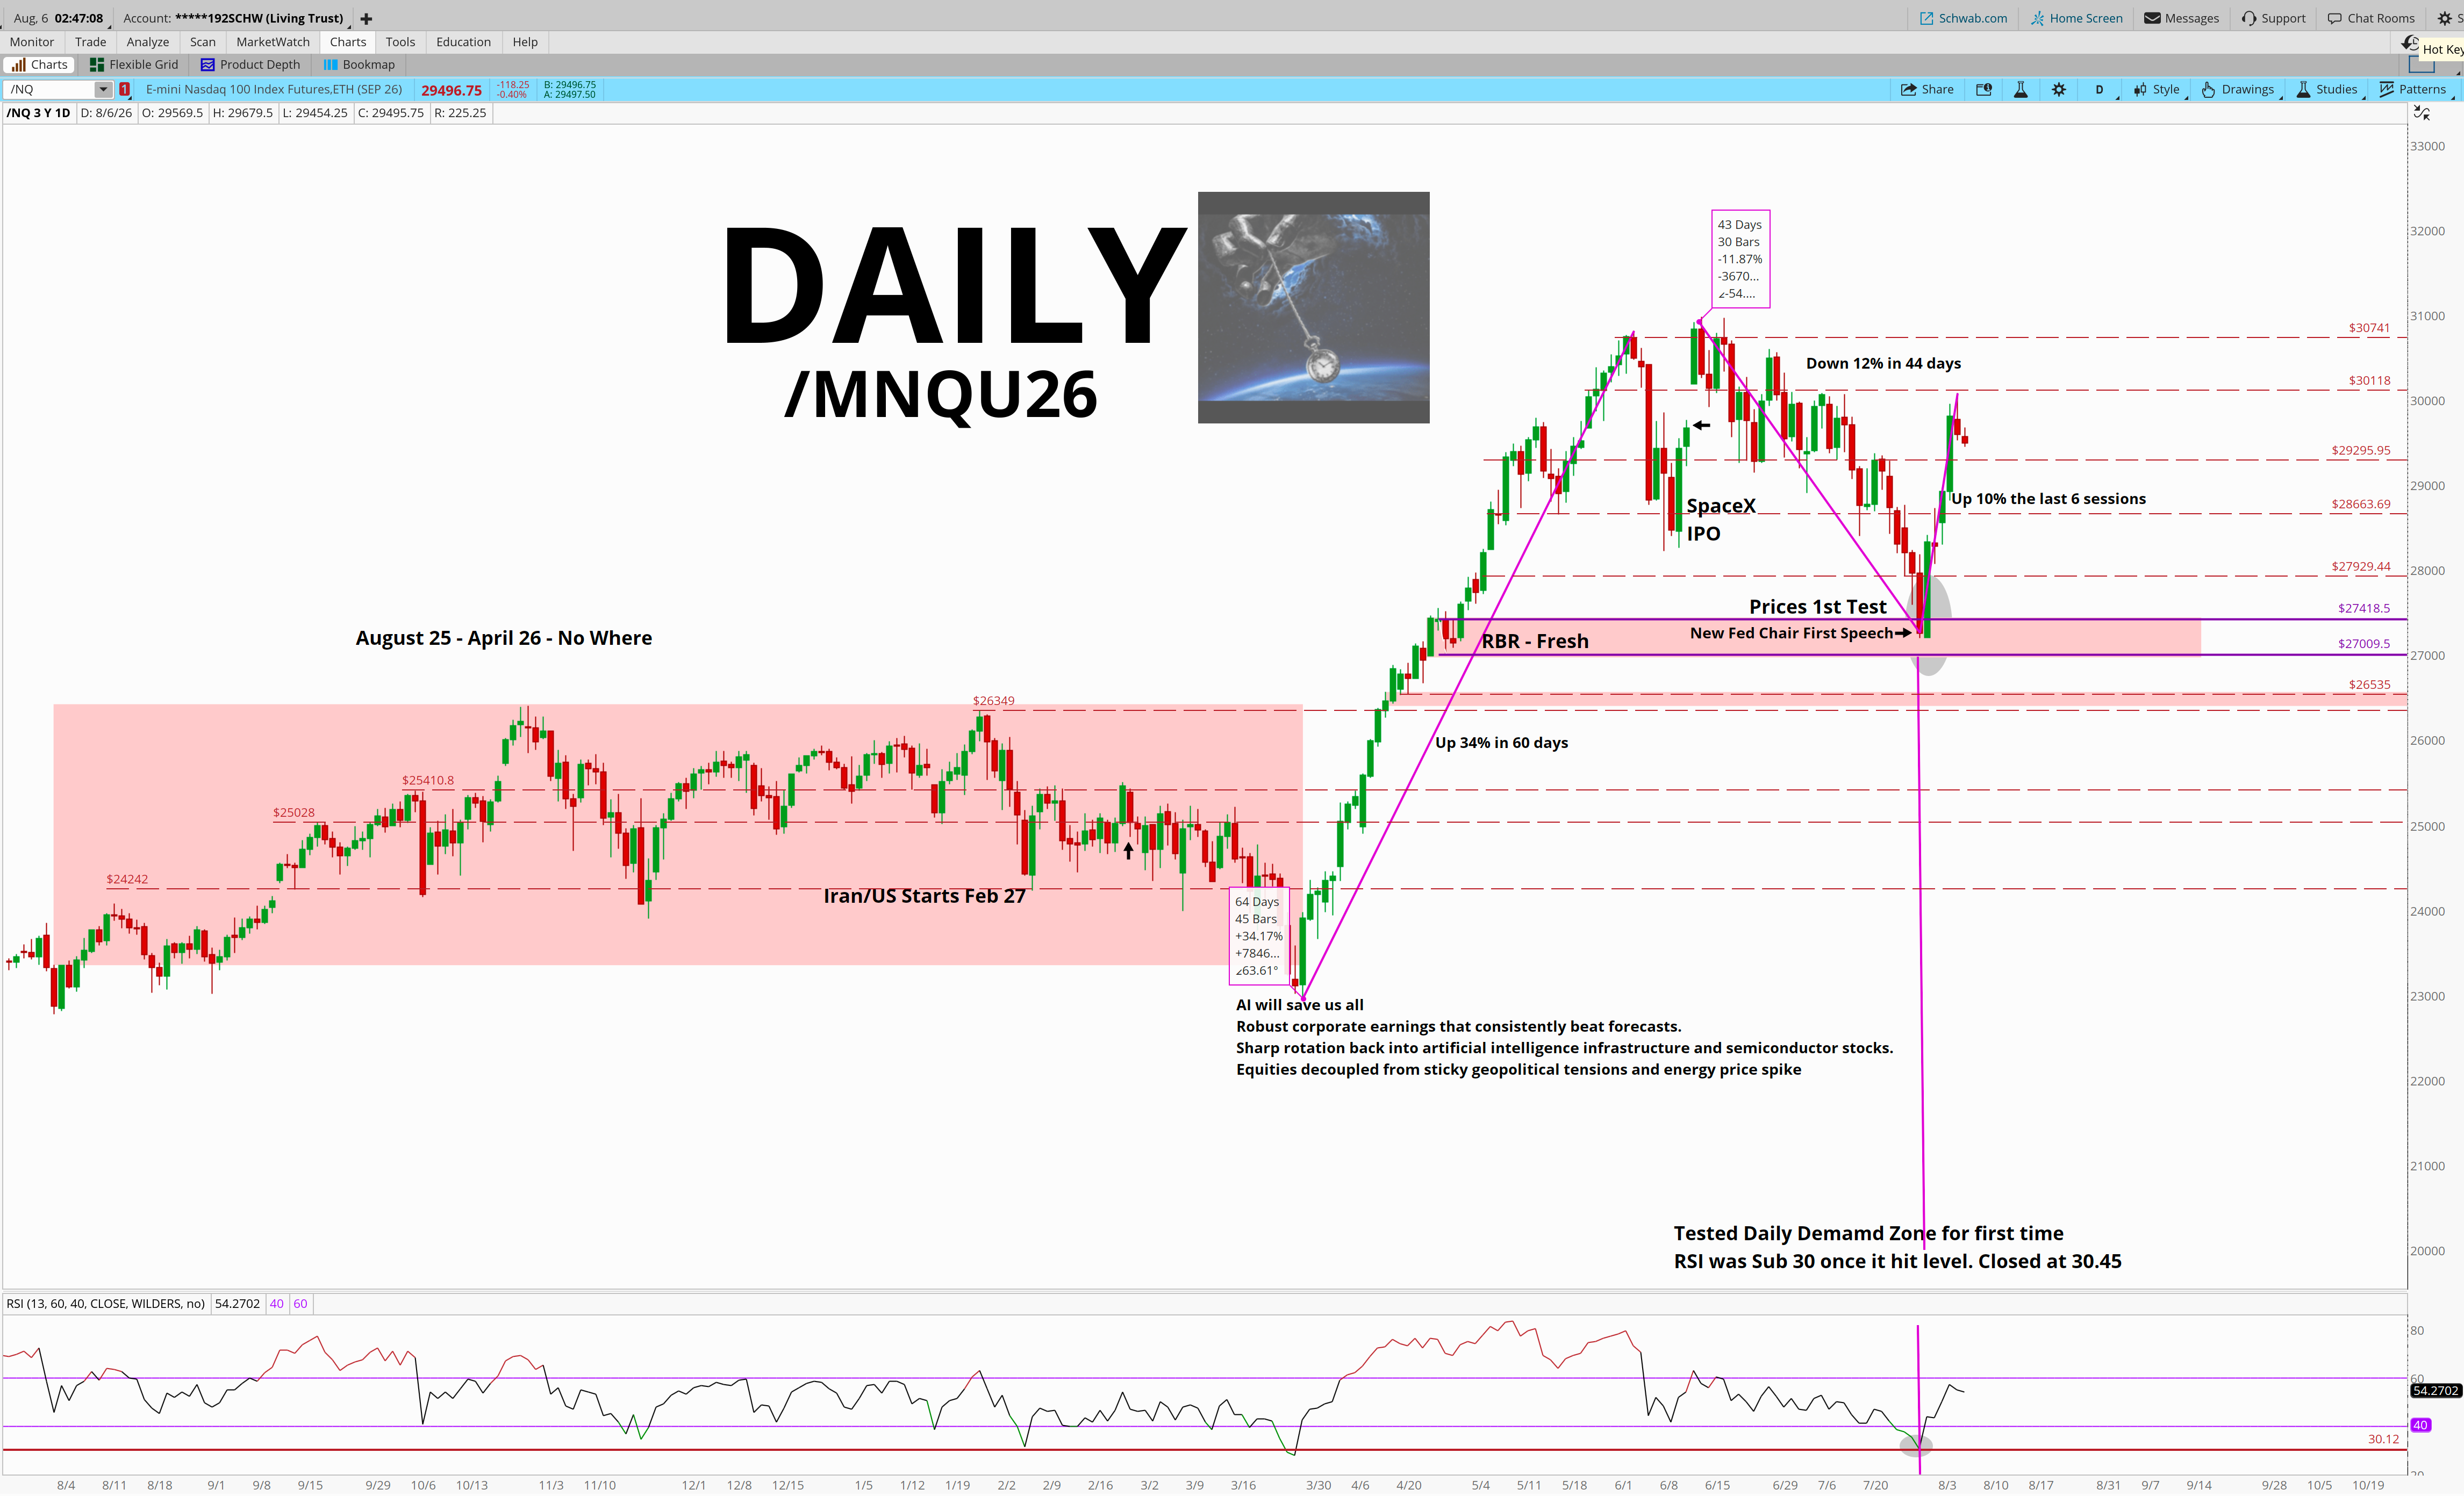
Let’s start on the daily, because this is where the whole story got written.
Right here.
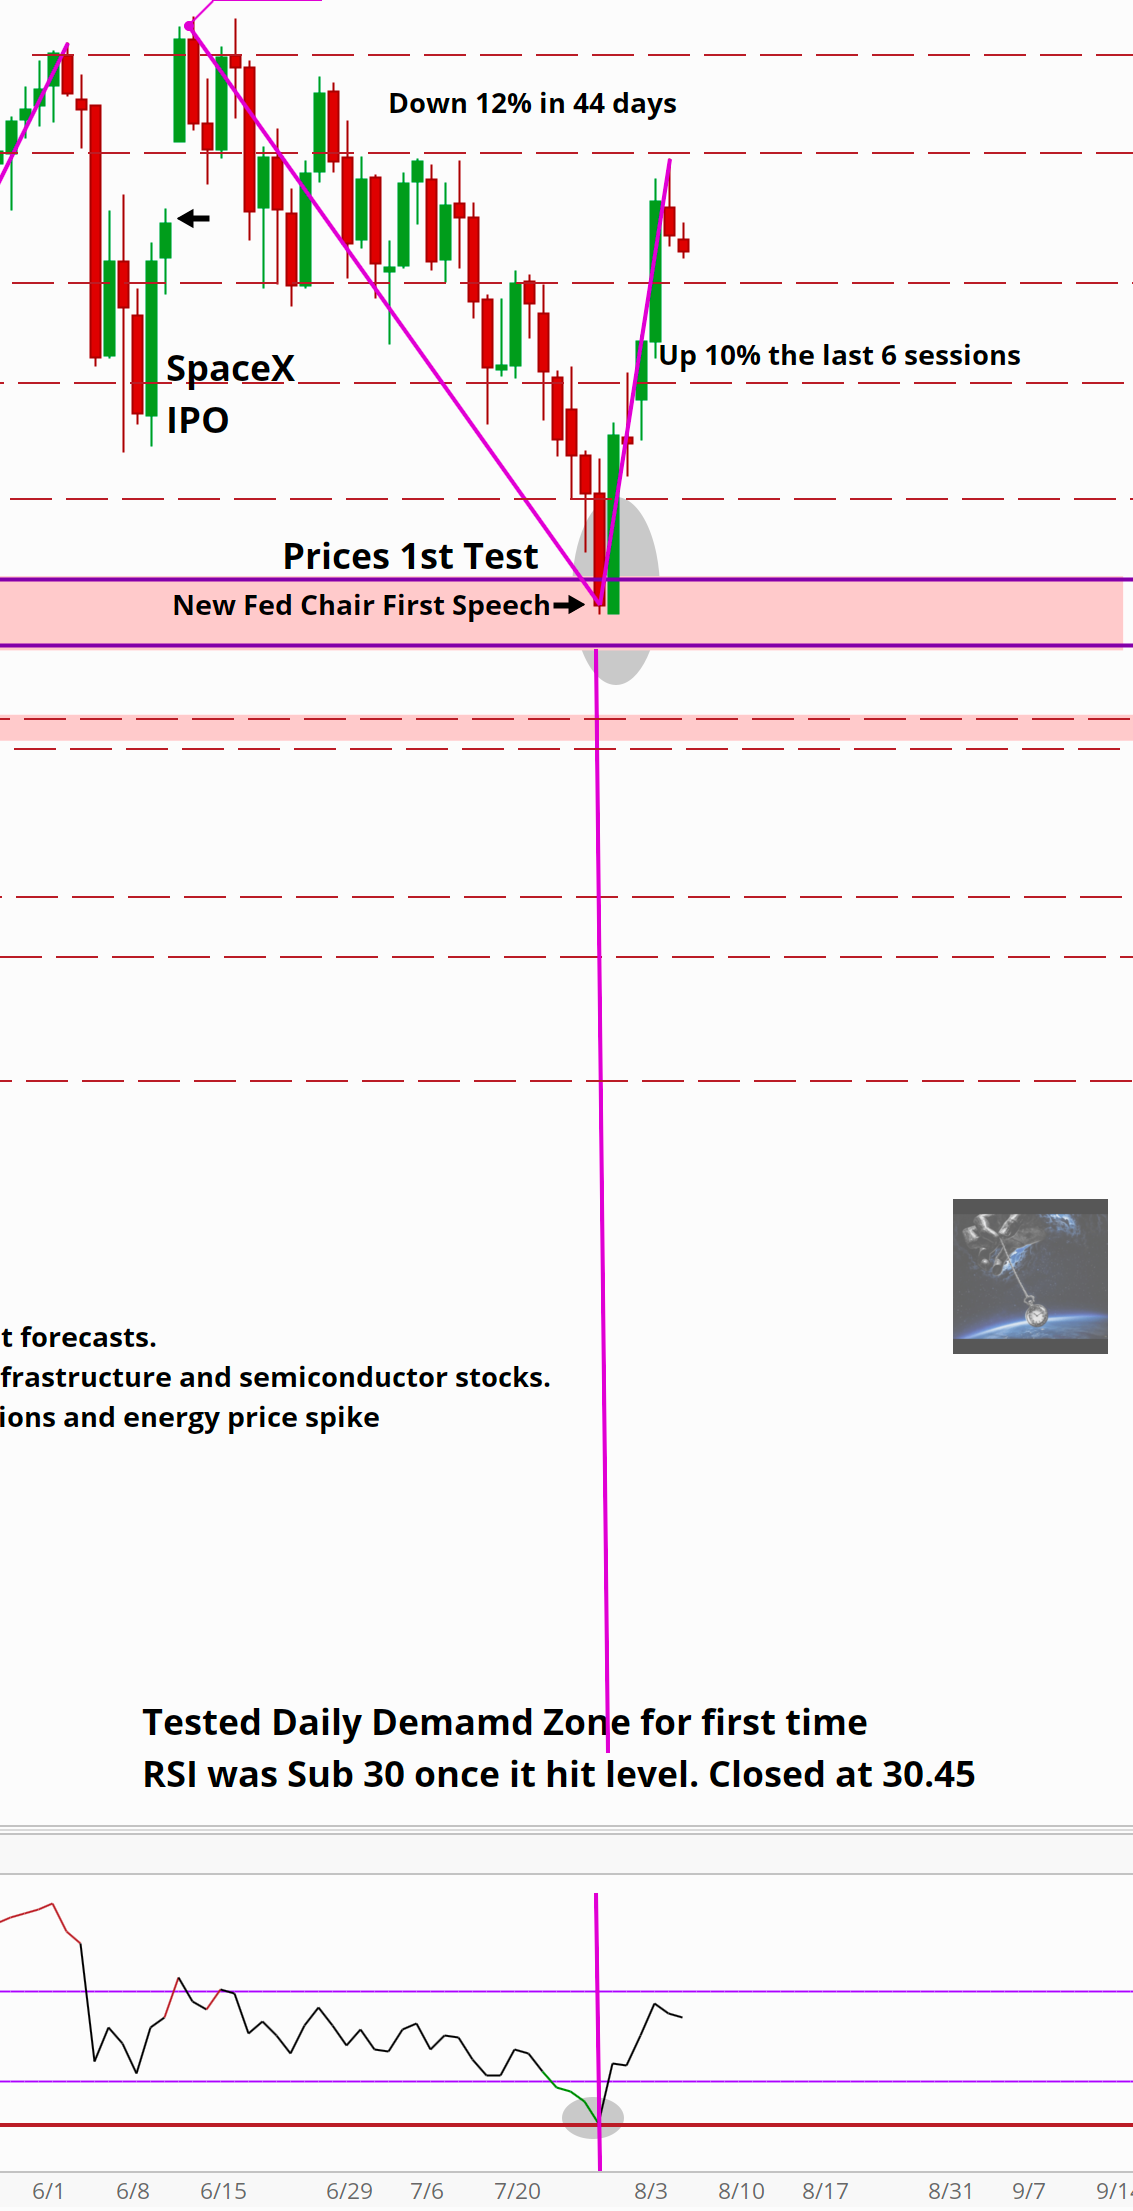
Daily RSI goes sub 30 into the level, pops a bit, and closes at 30.45.
Most people see a sub-30 print and think “oversold.”
But oversold can always get more oversold.
Context is everything, and I’ll show you the context here…
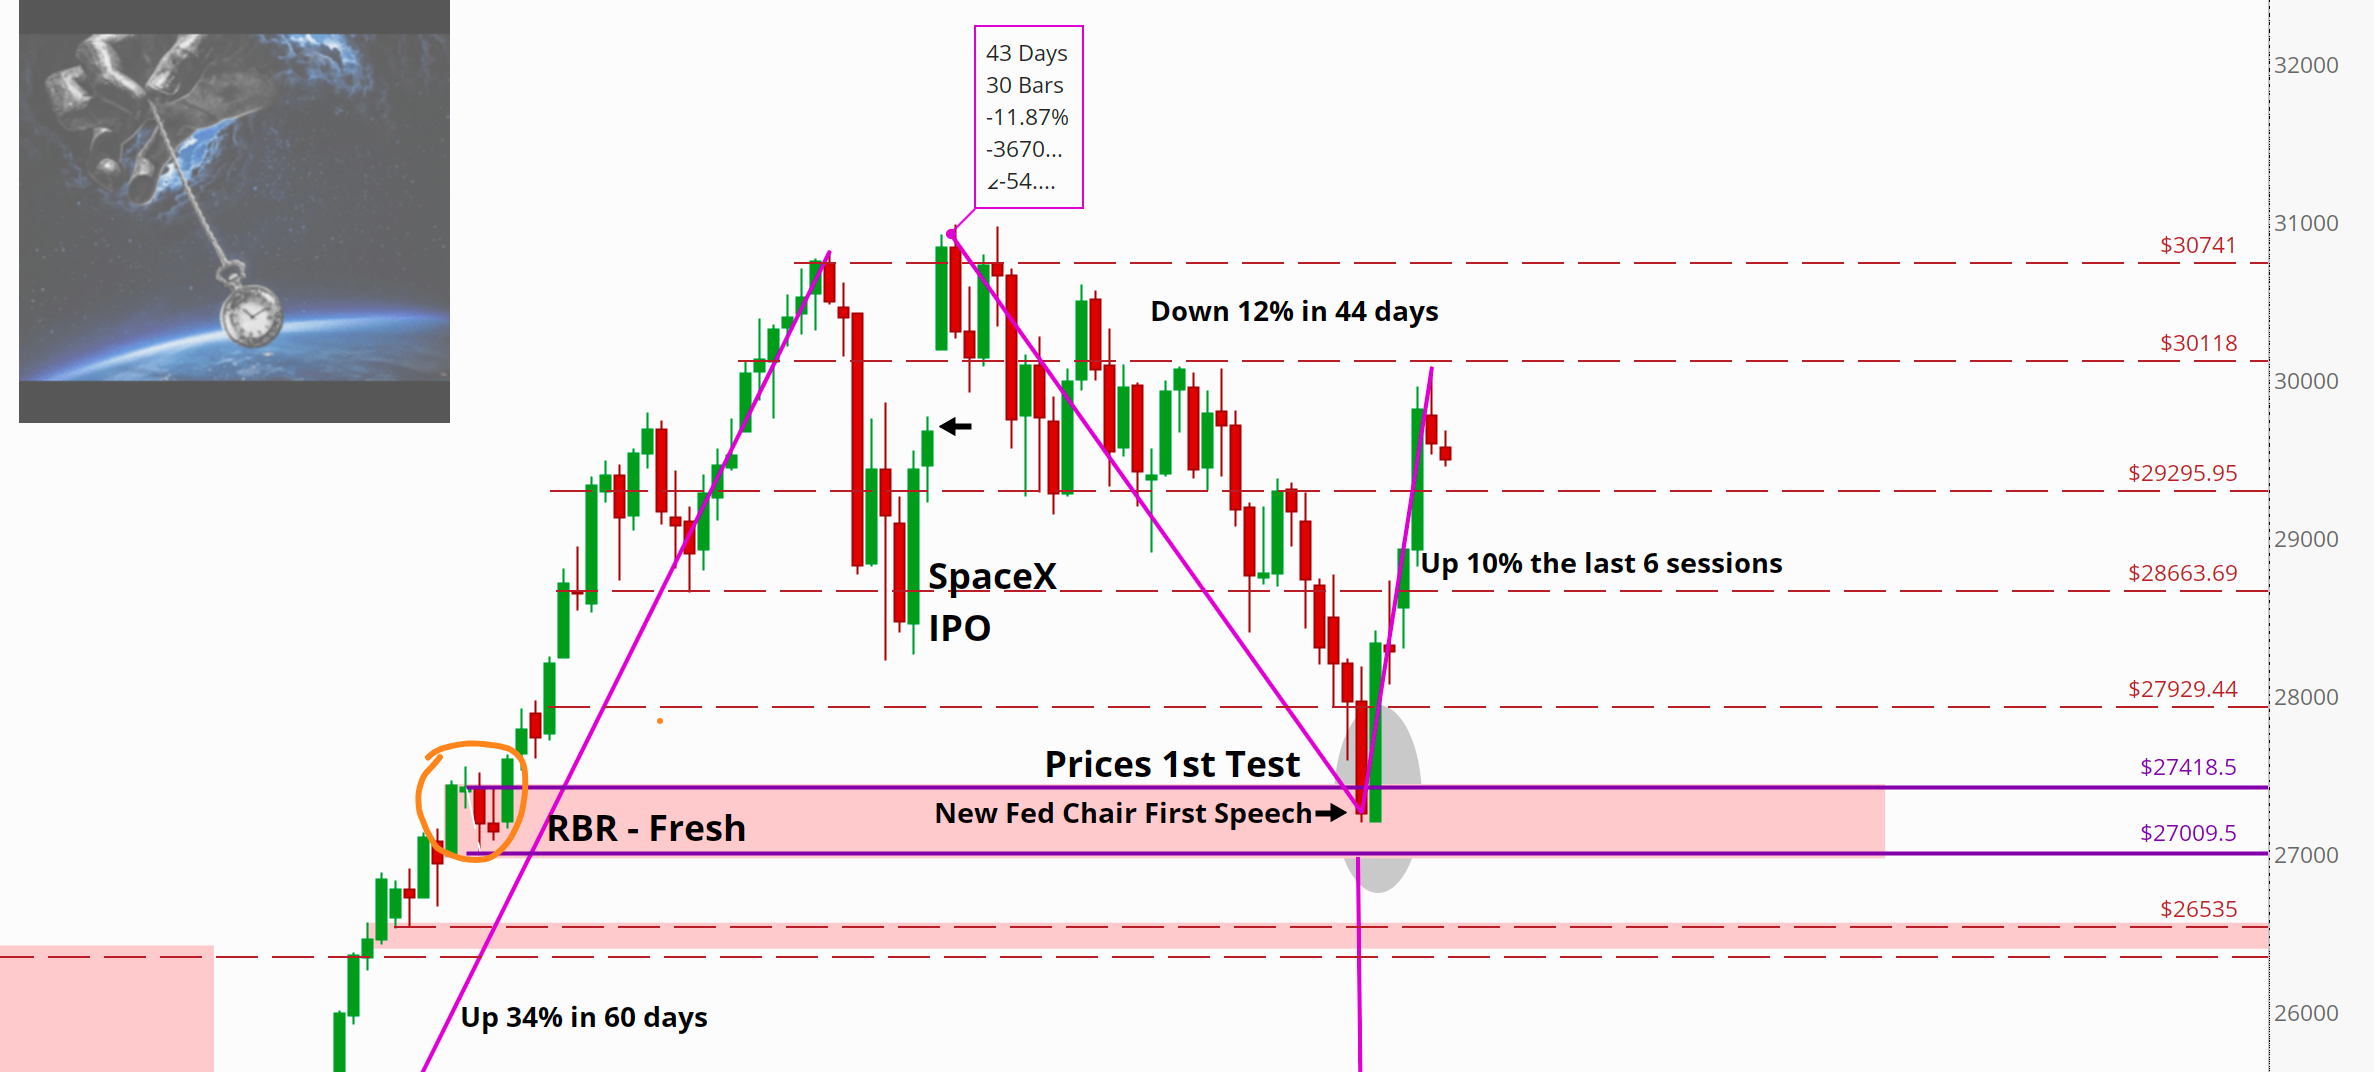
Price falls from it’s highs, nearly 12 % in 43 days and where does it go?
It happens right at a fresh demand zone.
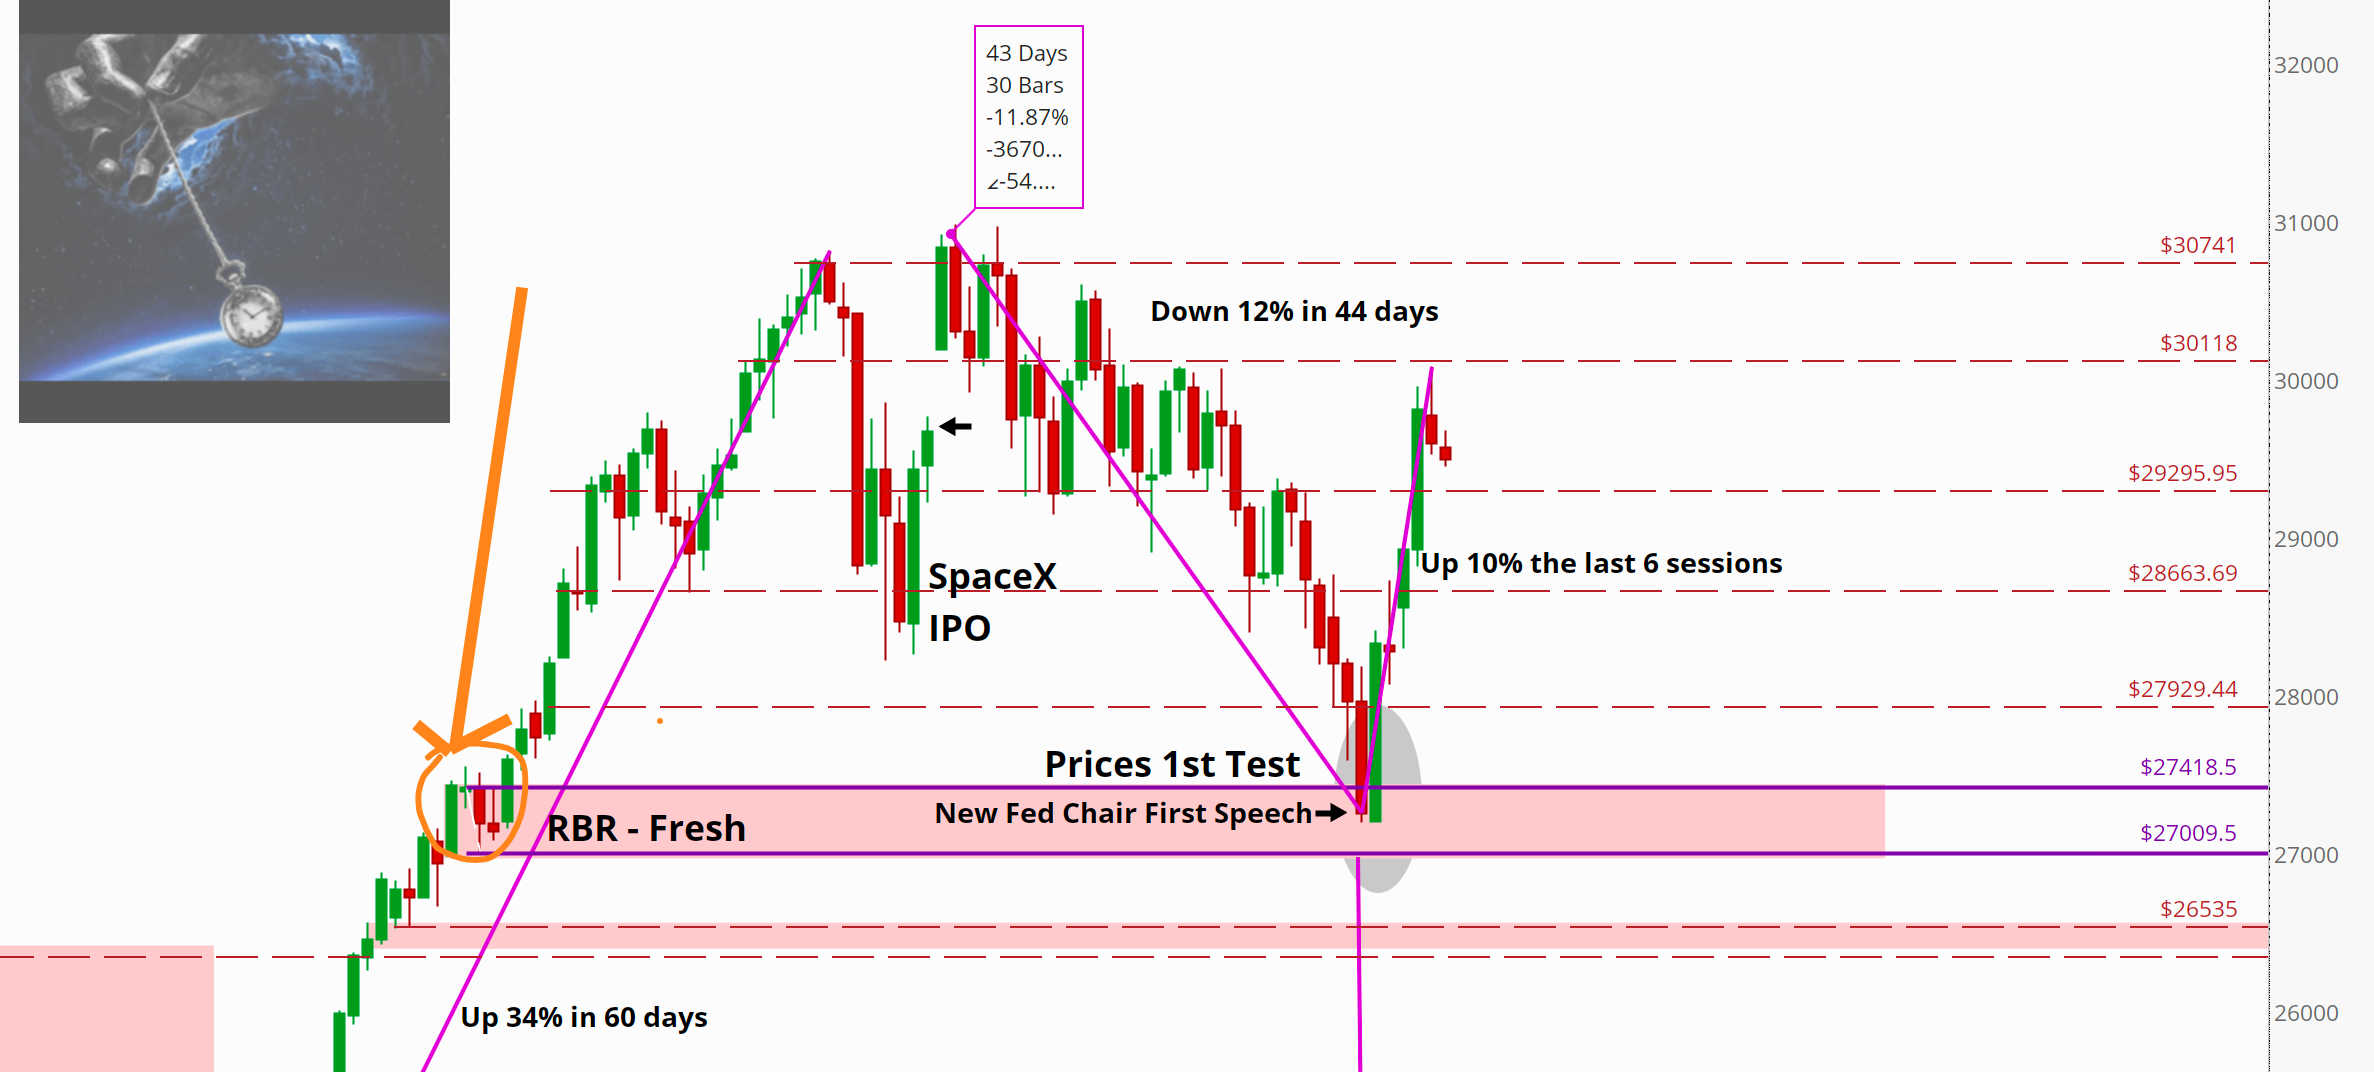
That ~400 pt rally-base-rally.
It was never tested before this time.
Price arrives
Momentum is exhausted, diverges on smaller time frames, and the market turns on a dime.
Up 10% in six sessions.
Doesn’t happen often
Here’s the math nobody’s doing.
Record high 30,740 on June 2.
Low of 27,257 on July 29.
That’s 3,483 points.
50% retracement: 28,999
61.8% - 29,410
78.6% - 30,004
Where did the 10% bounce stop???
Almost exactly 30,000
Pretty remarkable.
Bear market rallies die at 50, maybe 61.8.
They don't routinely take back 78% of a decline in a week and a half.
One caution before we move on.
That zone has now been used?
It's spent.
A level that holds on first test is a gift.
Second test is a coin flip.
Third test is a liability.
If we come back down there this autumn, do not assume the same outcome, especially if RSI is weak. Many times, these levels will flip into something like a drop-base-drop and become resistance.
A New Man At The Helm
There’s one more thing on that daily chart, and it’s the part I keep coming back to.
Look at where the low printed.
New Fed Chair. First speech.
The single event the entire market spent July bracing for. New hand on the wheel, nobody sure which way it turns. and….. that’s the exact bar that marked the bottom.
That’s not a coincidence.
That’s the mechanism. Markets don’t bottom when the news gets good. They bottom when the last person who was going to sell the uncertainty has already sold it. Price fell into a fresh demand zone with momentum fully exhausted, the feared event arrived, and there was nobody left on that side of the boat.
The catalyst everyone was afraid of turned out to be the catalyst that ended it.
Here’s the most important thing I’ll say today.
The daily told us what happened.
It doesn’t tell us whether this was a correction or a top. Only the weekly can do that, and the answer is already sitting on the chart.
Below: the weekly momentum read that settles it, the full level map, the number that would prove me wrong, and the calendar risk sitting five weeks out.