
How My Best Trades Start (Before I Ever Click Buy)
It’s not about reacting — it’s about building a trade before it ever moves.

Structure. Traps. Confirmation. That’s the edge.
Amateurs chase price. Pros build trades.
They know exactly what they’re looking for — and more importantly, what they’re not.
Here’s what every high-conviction trade I take has in common:
I start with:
✅ 1. Structure
ES doesn’t move randomly — it moves with purpose.
And most major moves begin from imbalanced zones, where either buyers or sellers clearly won.
We call these key structure zones, and they usually show up as:
Bases (areas of rest or consolidation)
Impulses (strong directional moves)
Breakouts/Breakdowns (clean violations of key levels)
These aren’t just shapes — they’re where institutions leave their footprints.
Price often returns to these levels to fill unfilled orders or seek liquidity.
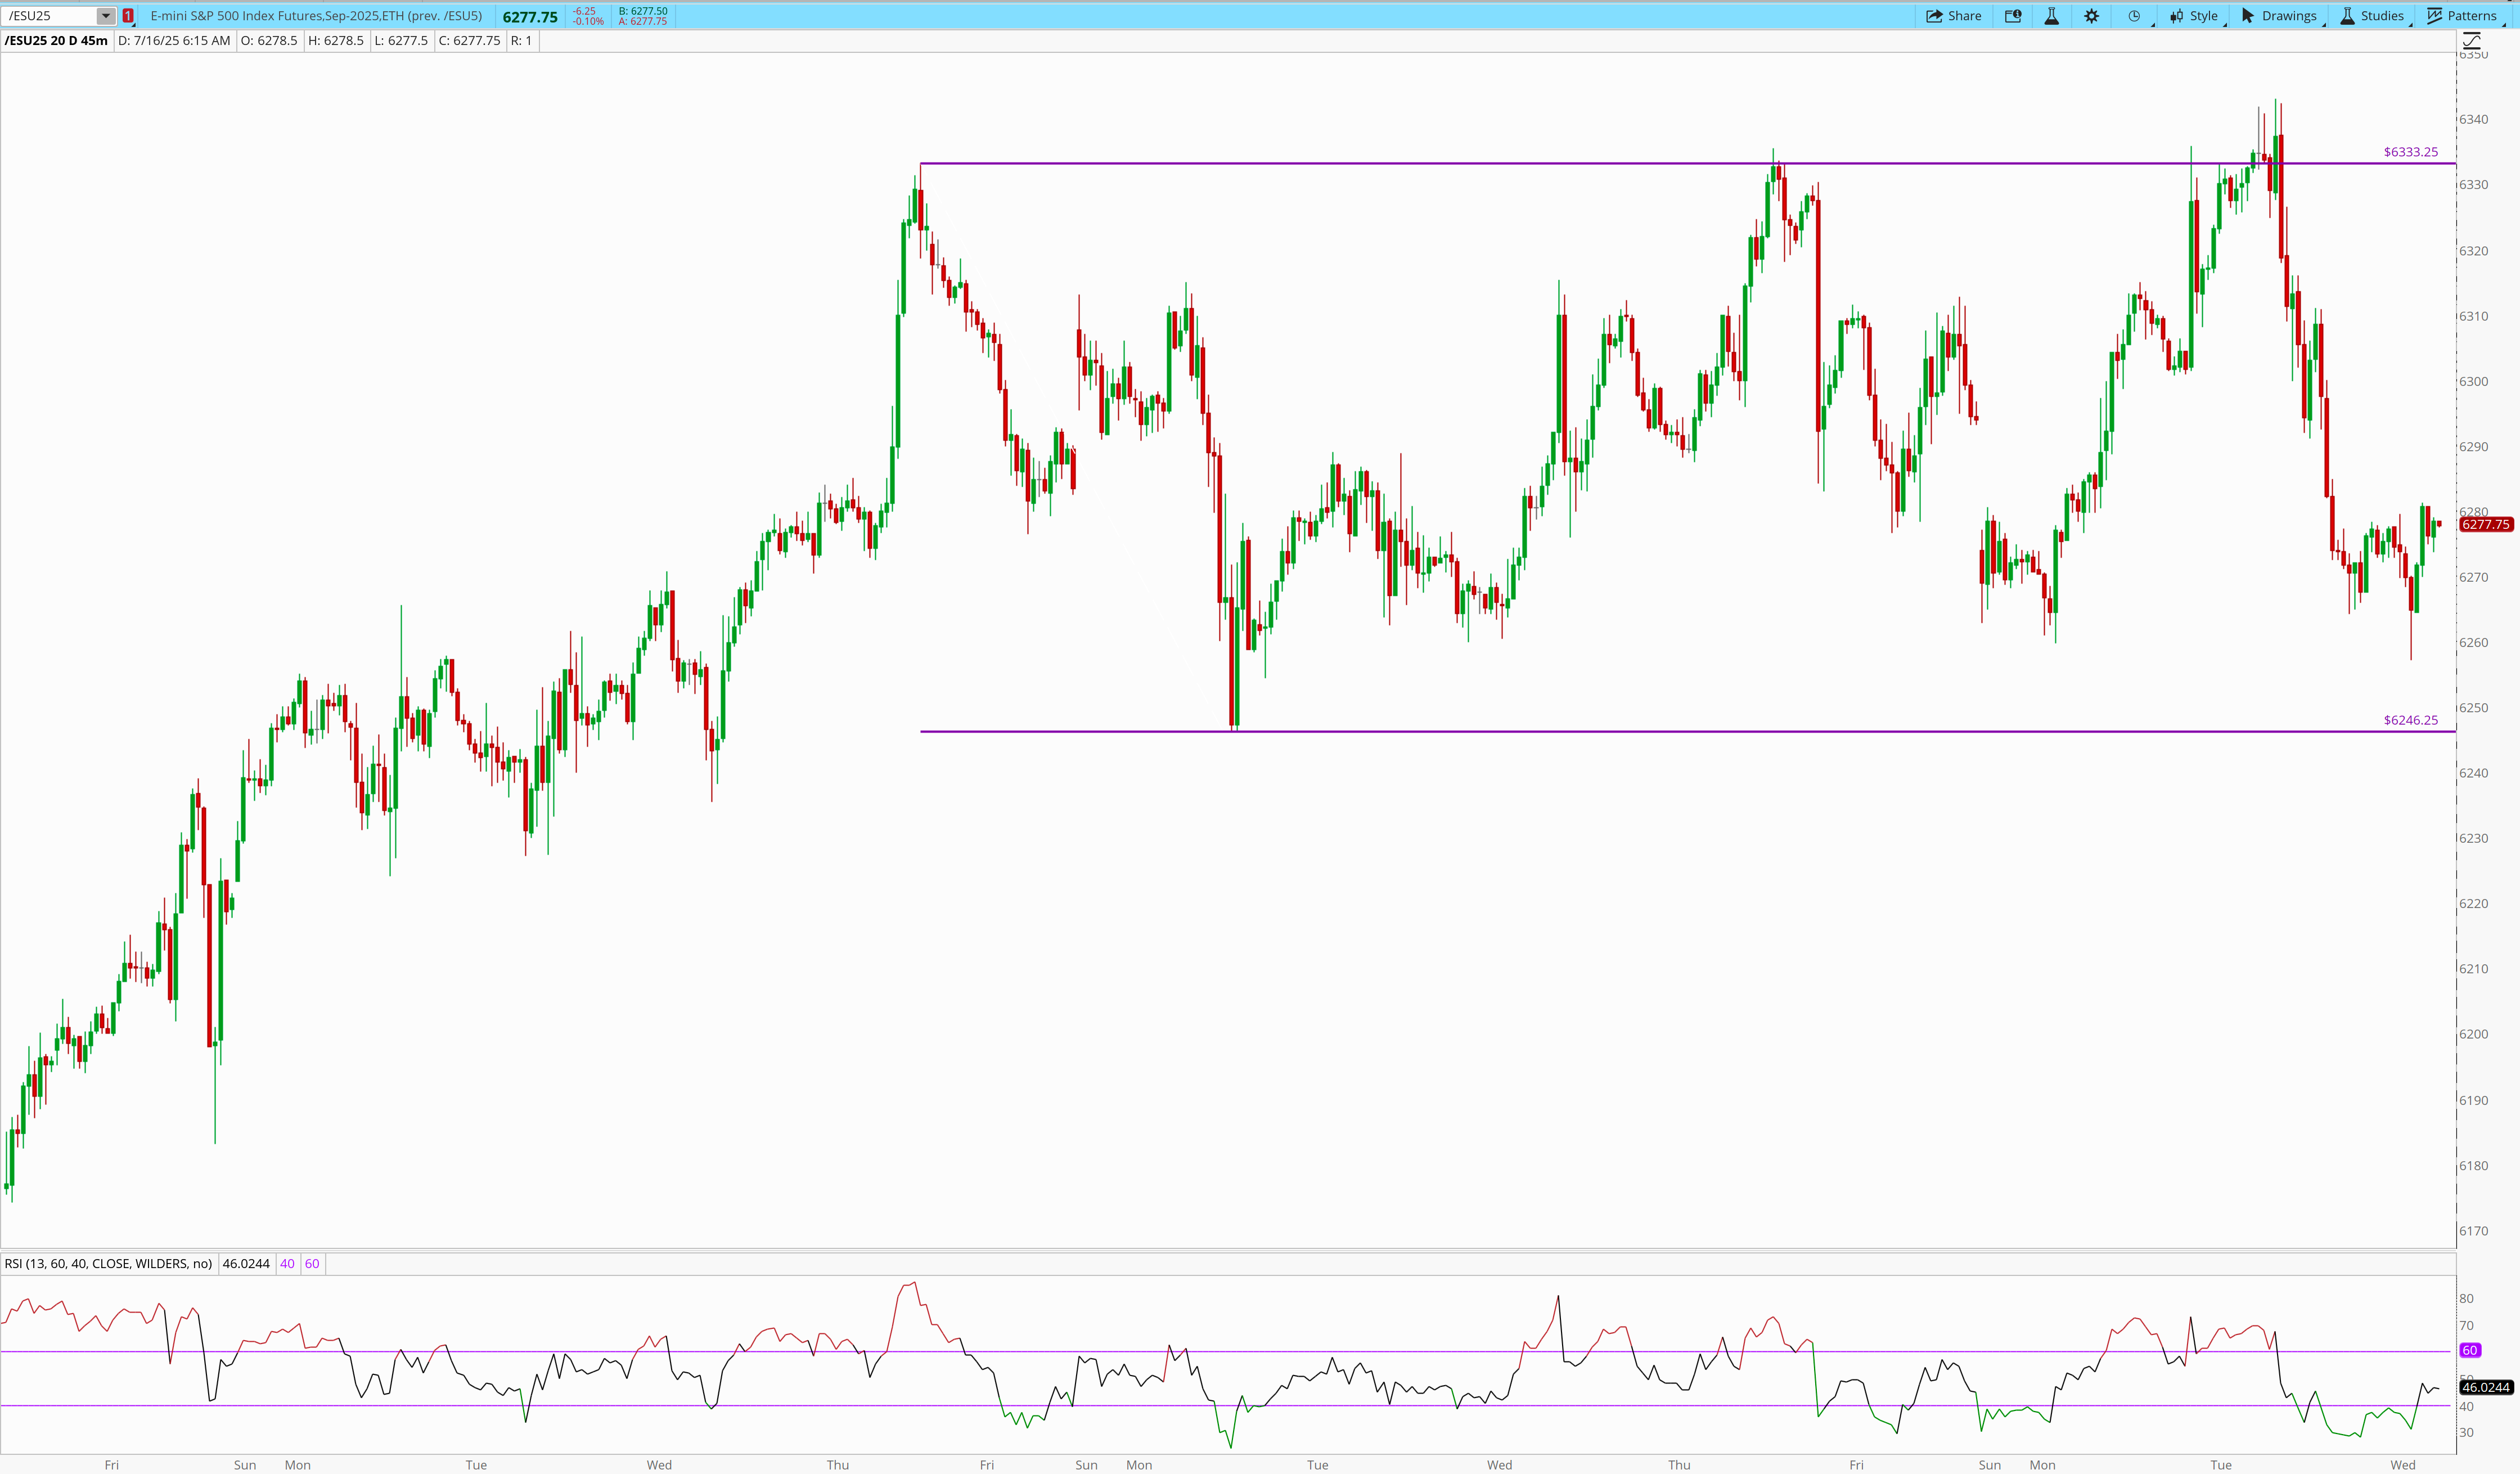
Here’s a look at identifying structure: using the July 3, 2025 -July 17, 2025 price movements.
Once we understand the structure, we wait for liquidity.
When Liquidity hits, we look for:
🔓 Want to see these levels before they happen?
✅ 2. A Key Level
Structure tells us where to look.
Liquidity tells us when to strike.
We wait for:
Stop hunts below multi-tested levels
Sudden reclaims (failed breakdowns)
Grinds toward obvious extremes before reversal
At that moment, we look for a Key Level already marked — often days in advance — and almost always tied to:
A. Level Trackbacks (LTBs)
These are institutional footprints.
We’re looking for areas where price moved away from a base, then returns with respect.
Not all levels are created equal.
We filter and rank them daily in the Gameplan.
B. Failed Breakdowns (FBDs)
These are liquidity traps.
Price flushes below support, finds demand, then rips back above.
It’s not random — it’s a trap.
And it’s where the best trades start.
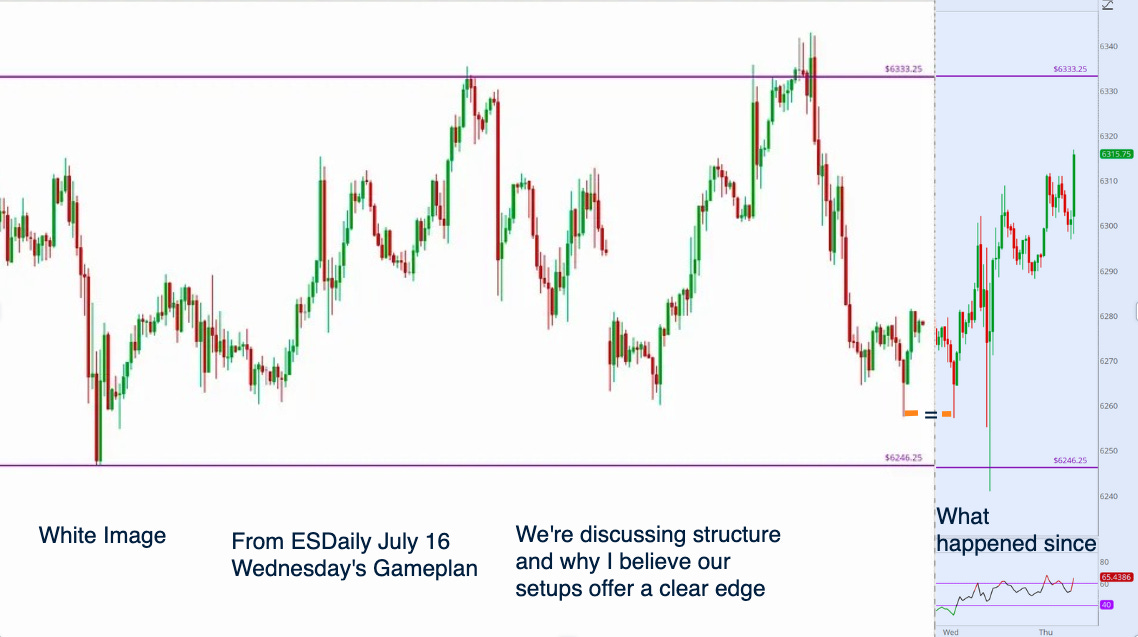
On July 16, 2025
We bought 6245.25 — a clear opportunity outlined ahead of time.
Why?
Because it offered the highest risk:reward opportunity inside of the existing structure.
Liquidity trap
Breach of multiple critical reclaim areas
Low on the curve
✅ 3. Price Behavior That Confirms It
We don’t catch falling knives.
On July 16, 2025 when price fell from 6294.75 to 6240 that was the liquidity hunt. It started at 11:15AM by 11:35 we were sub 6245.
We did not buy at 6245.25, as a direct bid. We waited for acceptance — signs that orders are being absorbed and momentum is shifting.
Price defends the zone
Momentum slows
Buyers appear again
We failed to move below the support right underneath the reclaim area. Buyers absorbed. Large orders were filled — The kind of orders institutions make. Once price displayed this price action…. at these levels, at this structural setup …. with this risk:reward. Only then did we execute.
This wasn’t a guess — it was price entry criteria being confirmed by price behavior.
That’s when we enter.
Ready to Trade with More Confidence?
Most traders chase price without a plan — caught reacting, not anticipating.
This framework flips that on its head.
It’s how I avoid noise, spot high-conviction entries, and stay consistent day after day.
Every setup I share starts here — structure, levels, and price behavior.
If you’ve made it this far, you’re not here to gamble.
You’re here to sharpen your edge.
👉 Upgrade for Full Access
Get the full daily Gameplans — and trade with purpose.
“I used to take 6–7 trades a day. Now I wait for the kind of setups PriceTrader lays out. Fewer trades, way more conviction — and it shows in my PnL.”
— Robert G. ESDdaily paid up subscriber May 2025