
January 5 ESDaily Gameplans
Last Updated - Jan 5 3:39AM

Current Open Position(s) as of January 5
Monday January 5, 2026
January Begins With Structure, Not Urgency
The year didn’t end with clarity.
It ended with structure being tested and, in several cases, failing.
The last few weeks of 2025 were quiet on the surface, but decisive underneath. Price compressed, rotated, and pressed into known levels without ever resolving cleanly. From a distance, that can look constructive. In practice, it was an environment that punished anticipation and rewarded restraint.
That matters.
Late in the year, ES often slows the tape.
Ranges tighten. Moves overlap. And instead of clean expansion, price begins to interrogate structure. That’s exactly what happened here.
The upside failure came first.
The Dec 26 high at 6994 was tested and rejected. Not once, but enough times to make it clear that buyers could reach that level, but could not stay there. That wasn’t random. It was information. Acceptance never came, and once price rolled back below, the burden of proof shifted.
From there, the market attempted to reclaim 6965.
That effort failed as well. The reclaim never stabilized. Momentum faded quickly. What looked like a potential reset turned into confirmation that control had not shifted back to buyers.
Those two failures framed the range.
On the downside, 6913 initially held on Dec 31. Sellers pressed into it, but price responded. That level mattered, and for a moment it acted as a line of defense. But structure isn’t defined by the first response. It’s defined by what happens next.
On 12/31 later that day, 6913 broke.
That break mattered because it wasn’t immediately reclaimed. Price accepted lower, and the market followed through. That acceptance resolved the balance that had defined the prior stretch and set up the next sequence.
From there, ES closed the 12/19 gap, rallied, and stalled again. The bounce carried into 6952, where it failed.
That failure was decisive. Momentum rolled. Buyers stepped aside. And on 1/2, price cratered.
That entire sequence tells a single story.
This was not random volatility.
This was structure doing its job.
Each level mattered for a reason. Each failure mattered because price proved it mattered. And each move away from those levels carried information forward into the next test.
That’s the environment we’re stepping into now.
There are stretches where traders need to tighten up. Not because opportunity disappears, but because edge easily can. Over the last few weeks, ES repeatedly tempted participation without offering clean resolution. Moves reached obvious locations, expressed intent, and failed.
That pause wasn’t accidental.
And stepping back during it wasn’t either.
Looking back at 2025, the trades that mattered were never the ones taken because price was active. They were taken because price reached a specific location, tried to do something obvious, and failed. Sellers pressed and couldn’t hold. Buyers chased and stalled.
Structure only mattered when price proved it mattered.
That’s not how most people trade.
But it’s how this market rewards participation.
This is about structure, preparation, and conviction.
About identifying where memory exists and waiting for price to come back to it. Important context shouldn’t get buried, and meaningful levels shouldn’t require constant monitoring to matter.
January doesn’t start with a clean slate. The calendar flips, but the market carries everything forward. Every habit traders formed last year. Every edge that stopped working. Every moment where anticipation was punished and restraint was rewarded.
That’s the backdrop coming into this week.
The failures at 6994, 6965, 6913, and 6952 weren’t noise. They were chapters. And they set the conditions we’re working with now.
So the goal here isn’t to predict what ES does next. It’s to understand where participation makes sense if price comes back to us, and where it doesn’t if it doesn’t.
Everything that follows builds from that premise.
Let’s Dive into the Time Frame Analysis and Today’s Opportunities
Daily
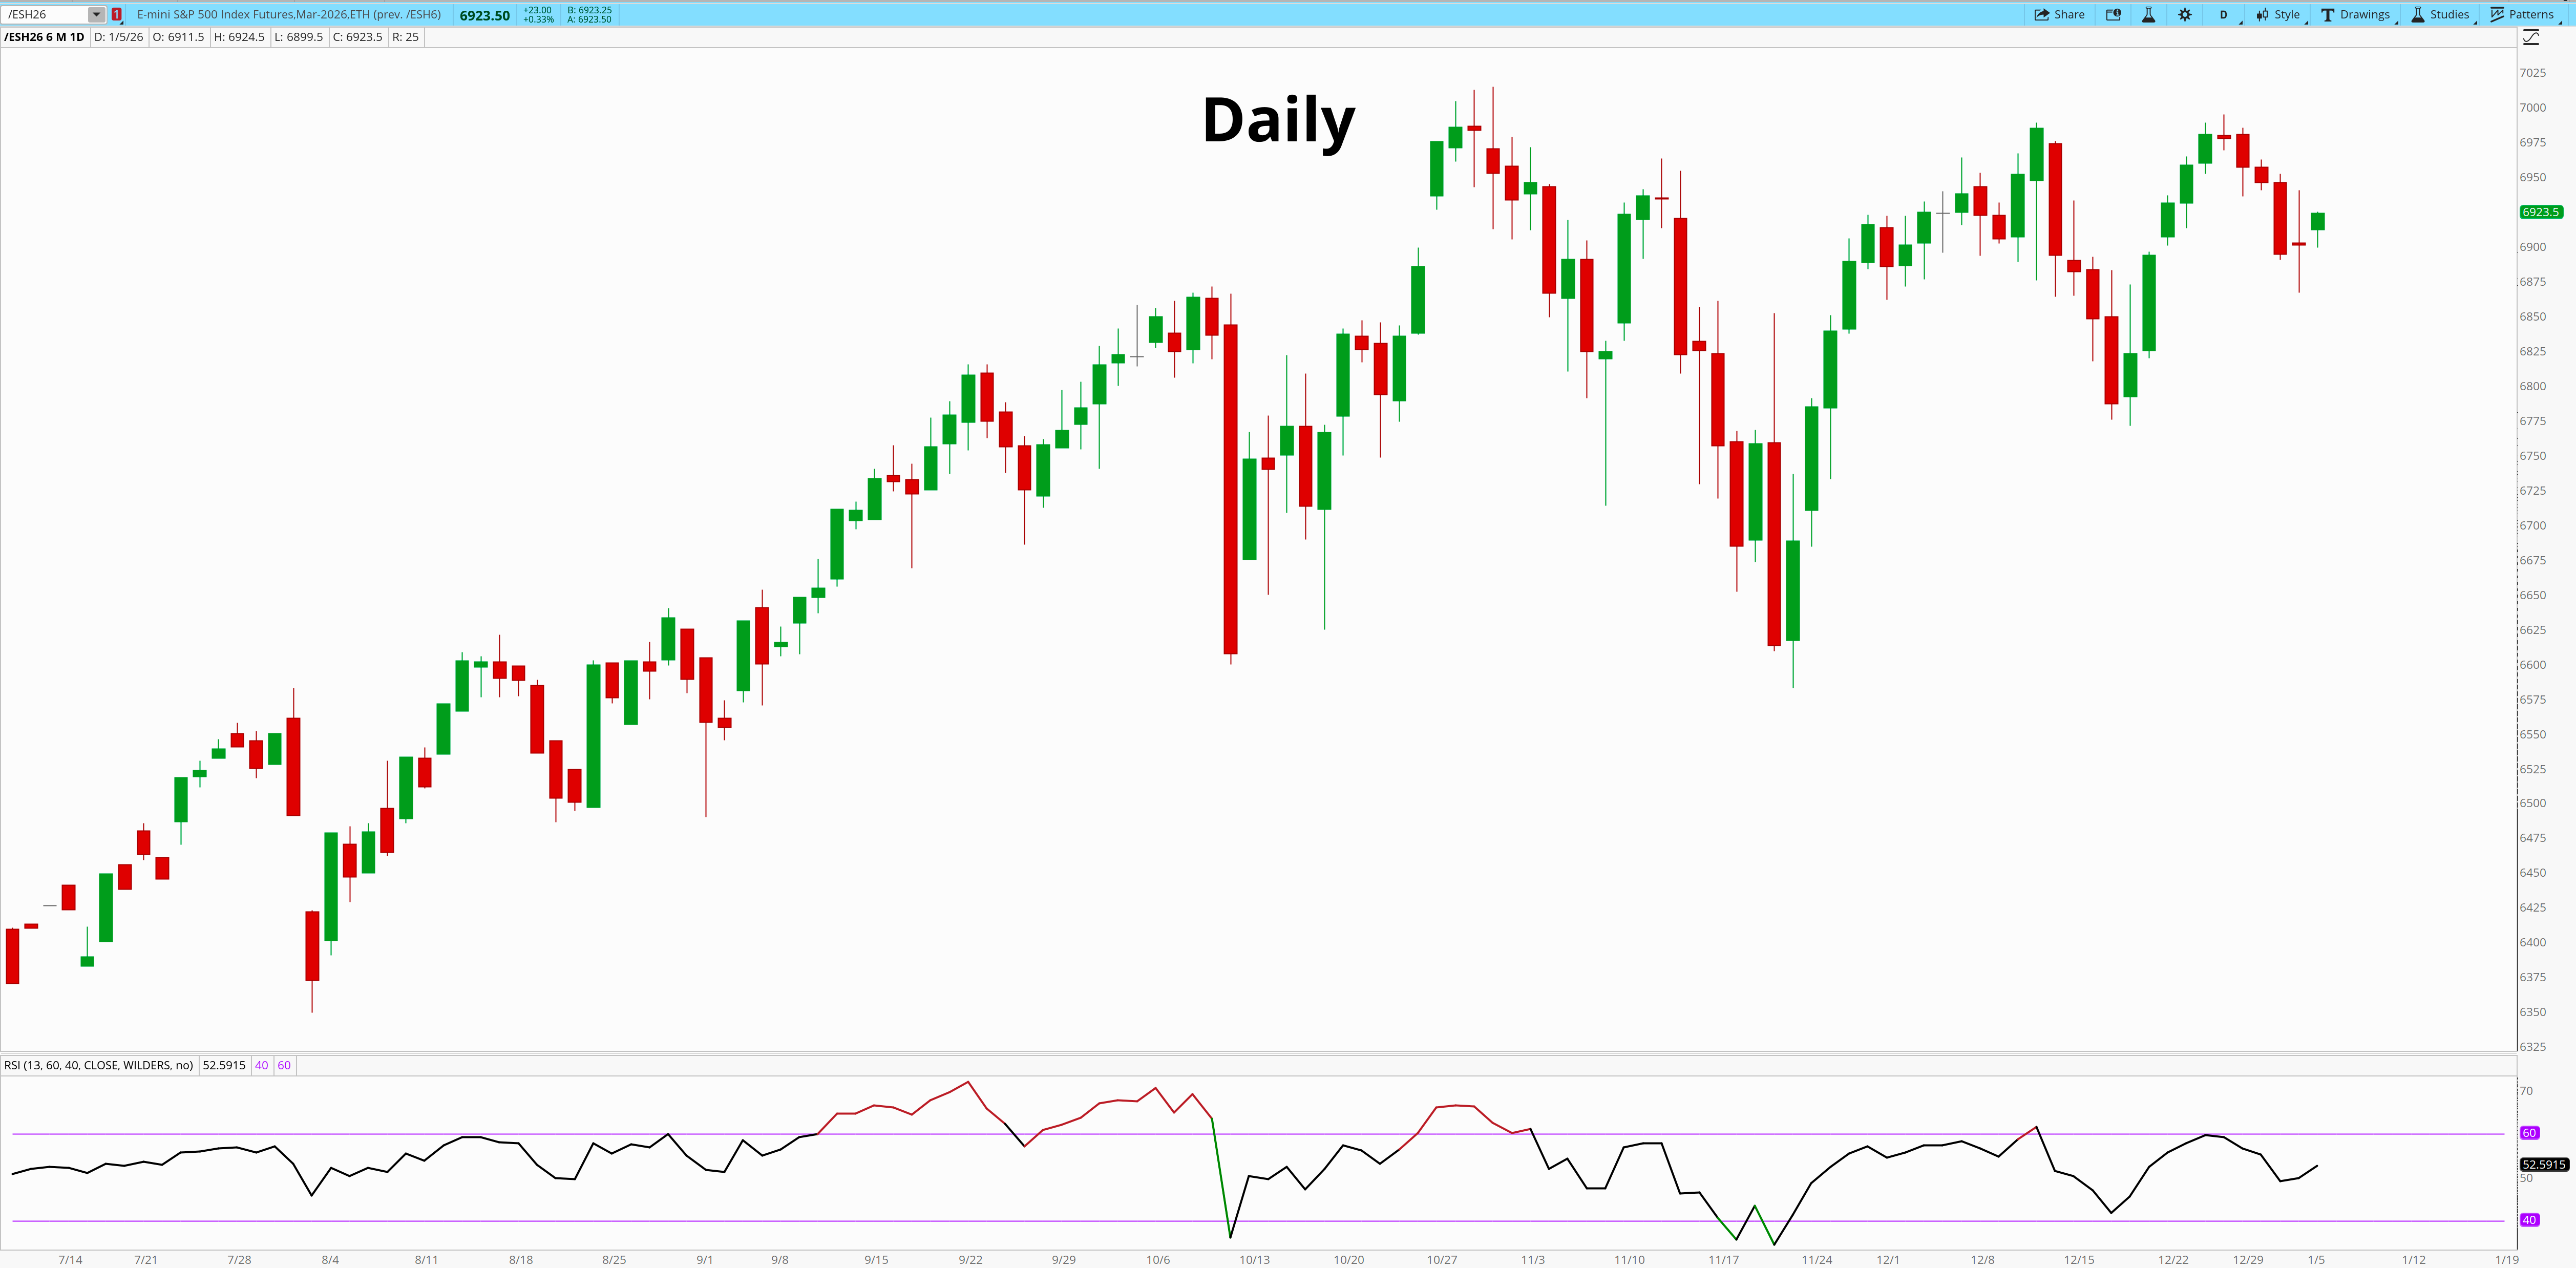
From a Daily perspective, the last two weeks resolved more than they created.
The important work is already done.
The market attempted continuation late in December and failed.
That failure was not subtle. The Dec 26 high at 6994 was reached, tested, and rejected repeatedly. Buyers could get there, but they could not stay there. Acceptance never came.
Once price rolled back below that level, the Daily stopped asking whether the trend could extend and started asking where structure would be tested next.
That test arrived at 6913 on 12/31. The initial response mattered, but not as much as what followed. When 6913 broke later that day and was not immediately reclaimed, balance resolved. Acceptance occurred.
From there, price did what unresolved structure tends to do. It closed the 12/19 gap, attempted a rebound, and stalled again.
Momentum confirms this sequence. RSI reset aggressively during the selloff, but it did not collapse into trend-failure territory. That tells you this move was corrective within a larger structure, not a broader unwind.
The Daily has done its job.
It transitioned the market from expansion into digestion.
4 Hr
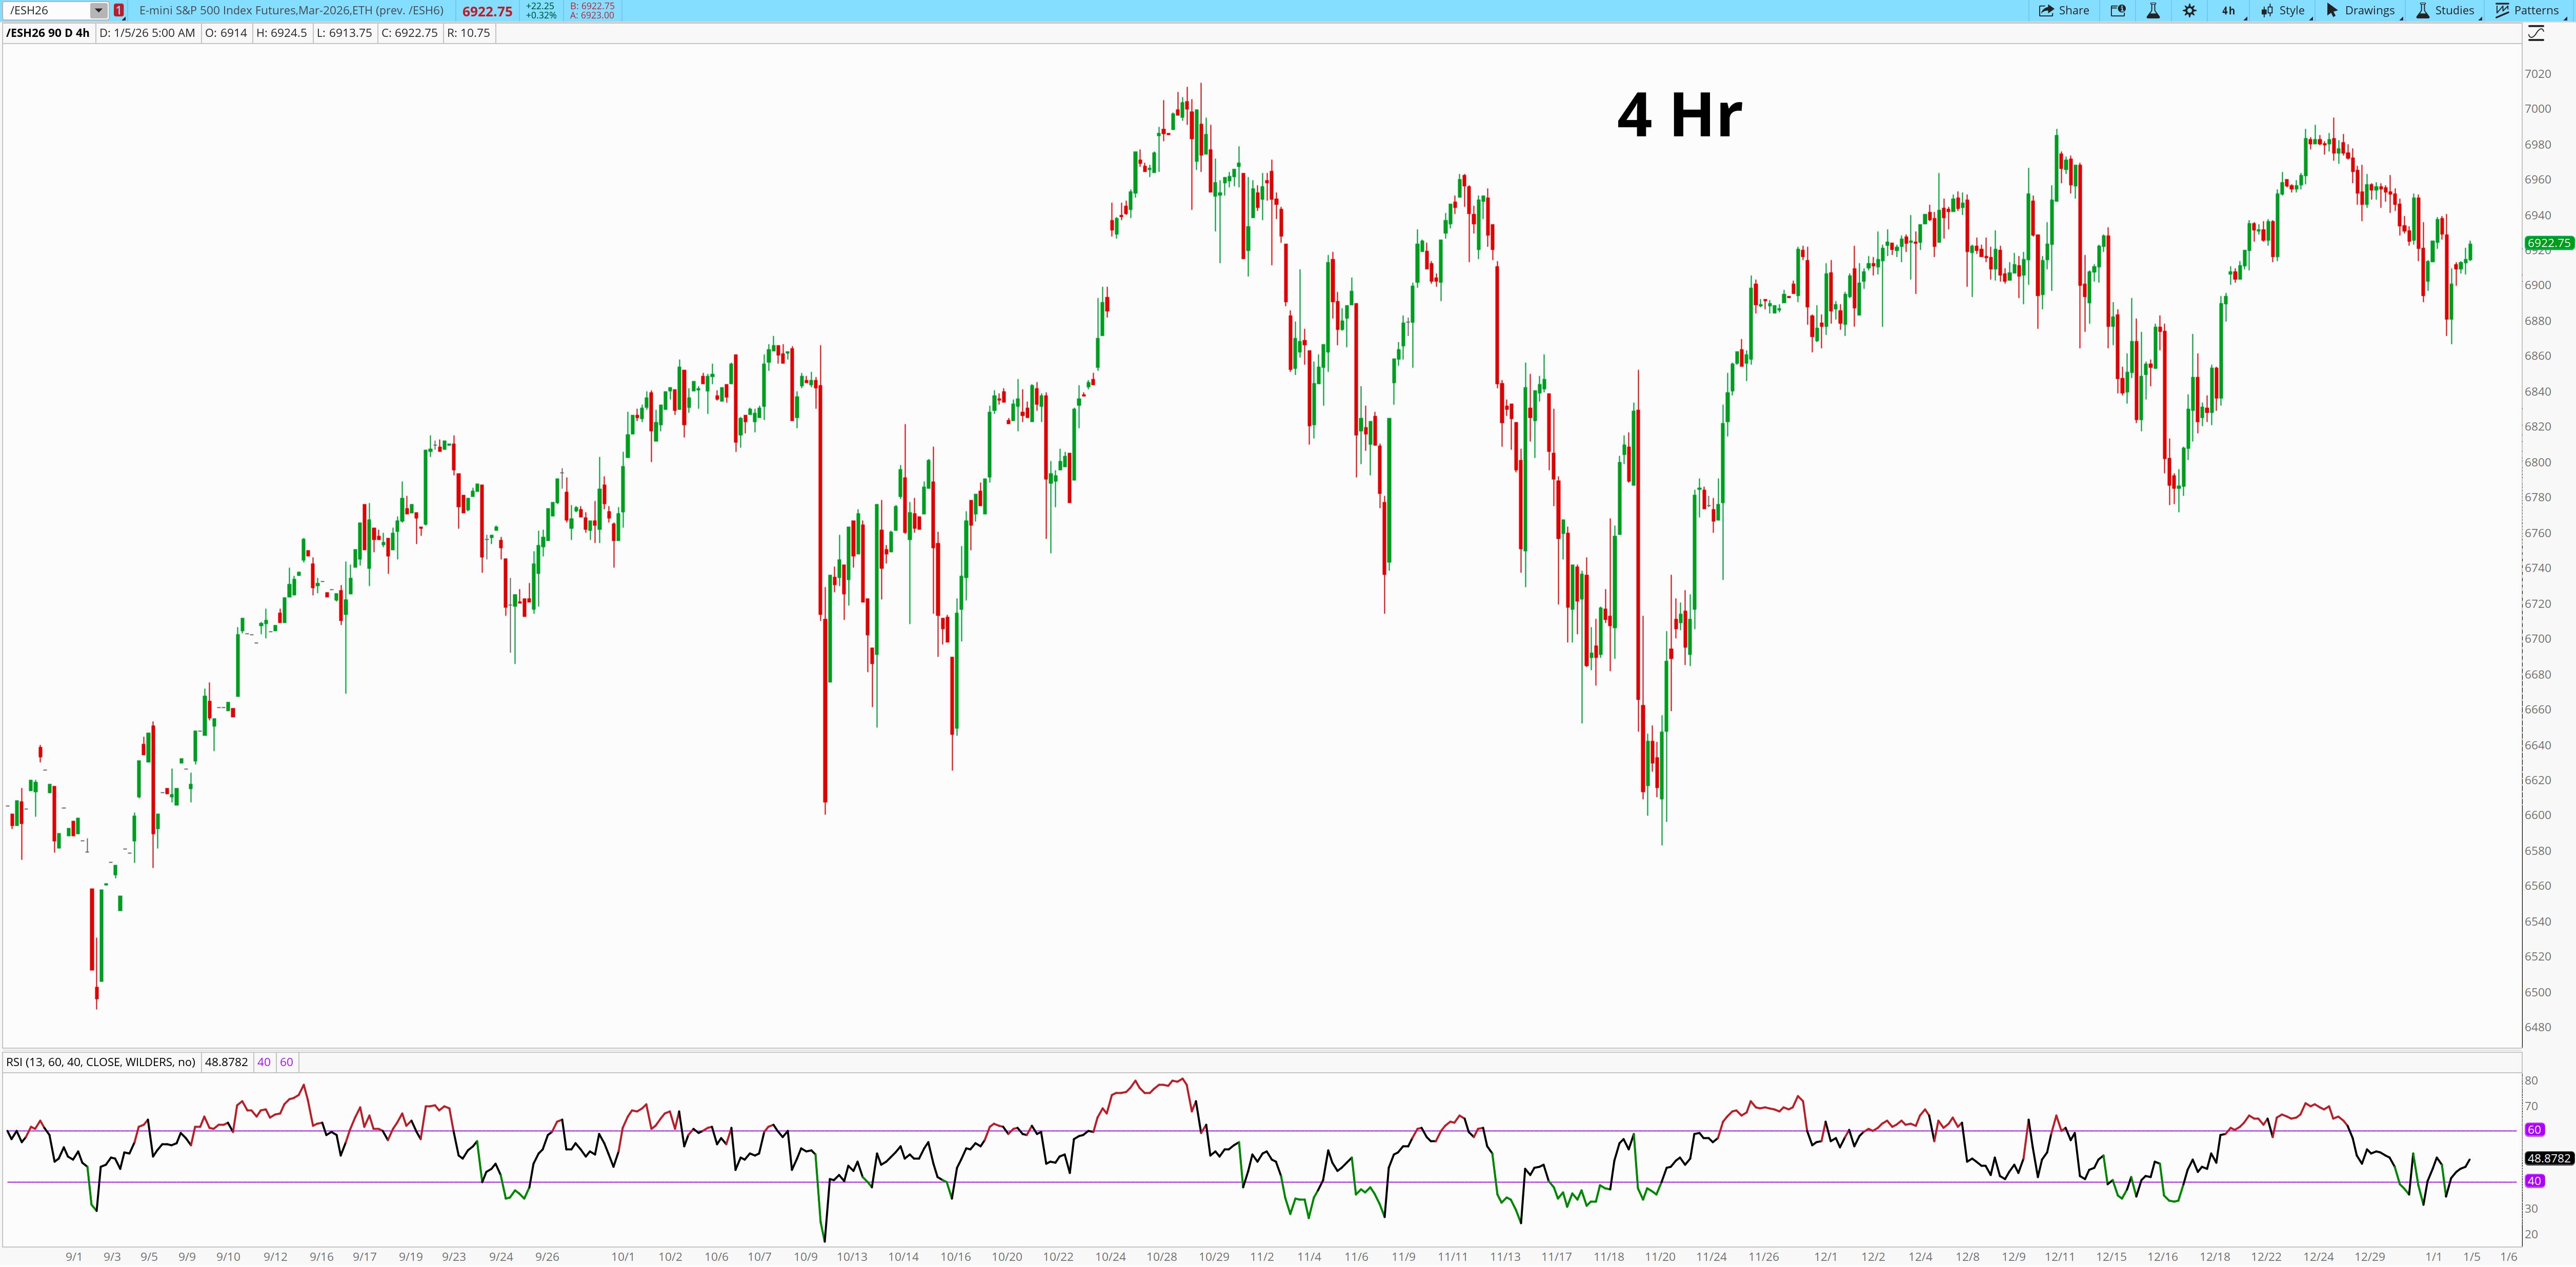
The 4hr chart shows the mechanics behind those Daily failures.
Each push lower over the last two weeks has been impulsive, while each bounce has been corrective.
That asymmetry is important.
The 4-hour chart shows how the Daily transition expressed itself in control.
Once the market failed at 6994, buyers attempted to repair damage. That repair effort centered around 6965. It did not stabilize.
Momentum faded quickly. Price rolled back over. That failure mattered because it confirmed that control had not shifted back to buyers.
The next rebound carried into 6952, the underside of prior structure. Sellers responded immediately. The bounce failed faster than the one before it, and downside momentum expanded into 1/2.
That sequence defines the current 4-hour state.
Downside moves have been impulsive. Upside moves have been corrective. RSI expands more easily on selloffs and struggles to sustain strength on bounces.
This is not a bearish market.
But it is no longer forgiving.
Buyers now have to prove they can reclaim and hold structure before continuation is back on the table.
45 Min
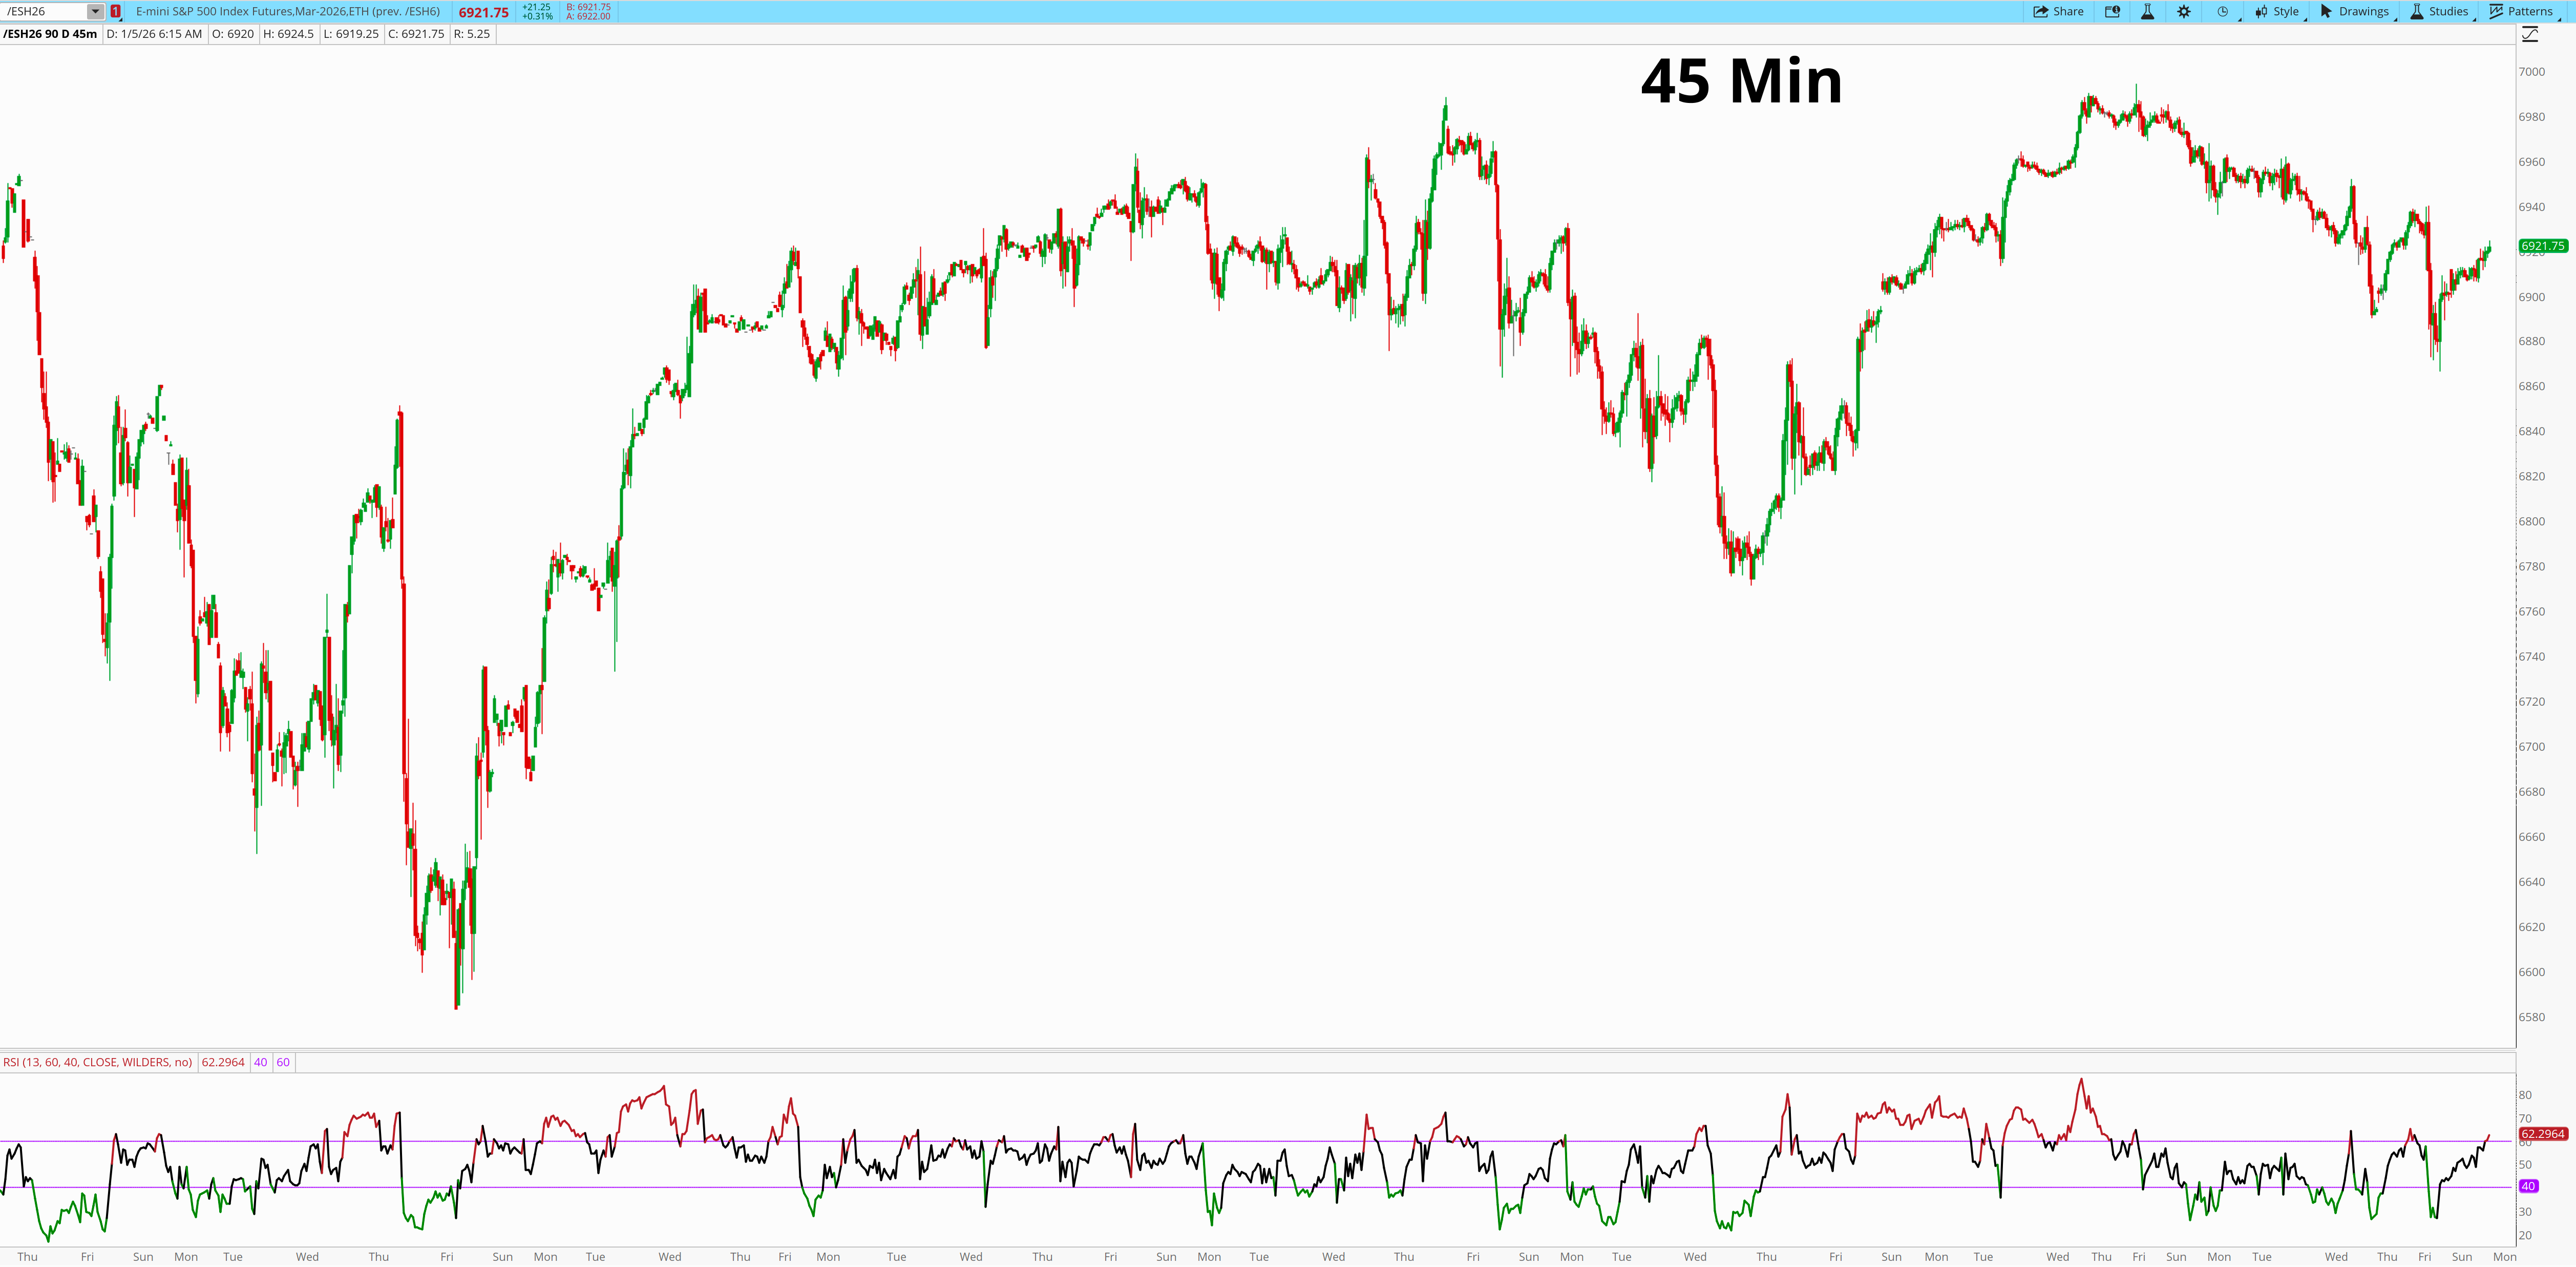
The 45min chart shifts the focus from failure to memory.
The failed highs and broken shelves are already accounted for by higher timeframes. The job here is to identify where structure was created during the transition.
The most important areas are the bases formed on impulsive exits during the selloff and early rebound attempts. These are the zones where price paused briefly, then displaced with intent.
Those exits created memory.
By contrast, the area just above 6951–6952 now carries memory for rejection, not support. Price did not base there. It failed there. That distinction matters if price works back into that zone.
The focus is not on the failed highs or the broken shelf. That information has already been absorbed by higher timeframes.
The job of the 45mine is to identify where memory was created during the transition.
The most important areas are the bases formed on impulsive exits during the selloff and early rebound attempts. These are the zones where price paused briefly and then displaced with intent. Those exits created structure.
Conversely, the areas just above 6951 now carry memory for rejection, not support. Price did not base there. It failed there. That distinction matters if price works back into that area.
Momentum at this timeframe remains fragile. Selloffs still produce expansion. Rallies still overlap. RSI struggles to hold strength during bounces and resets quickly on pullbacks. That tells you this is still an evaluation phase, not a launch point.
The 45-minute is not offering a signal right now.
It is defining where opportunity could form later.
Until price returns to one of those memory zones with controlled behavior, there is no edge to force.
15 Min
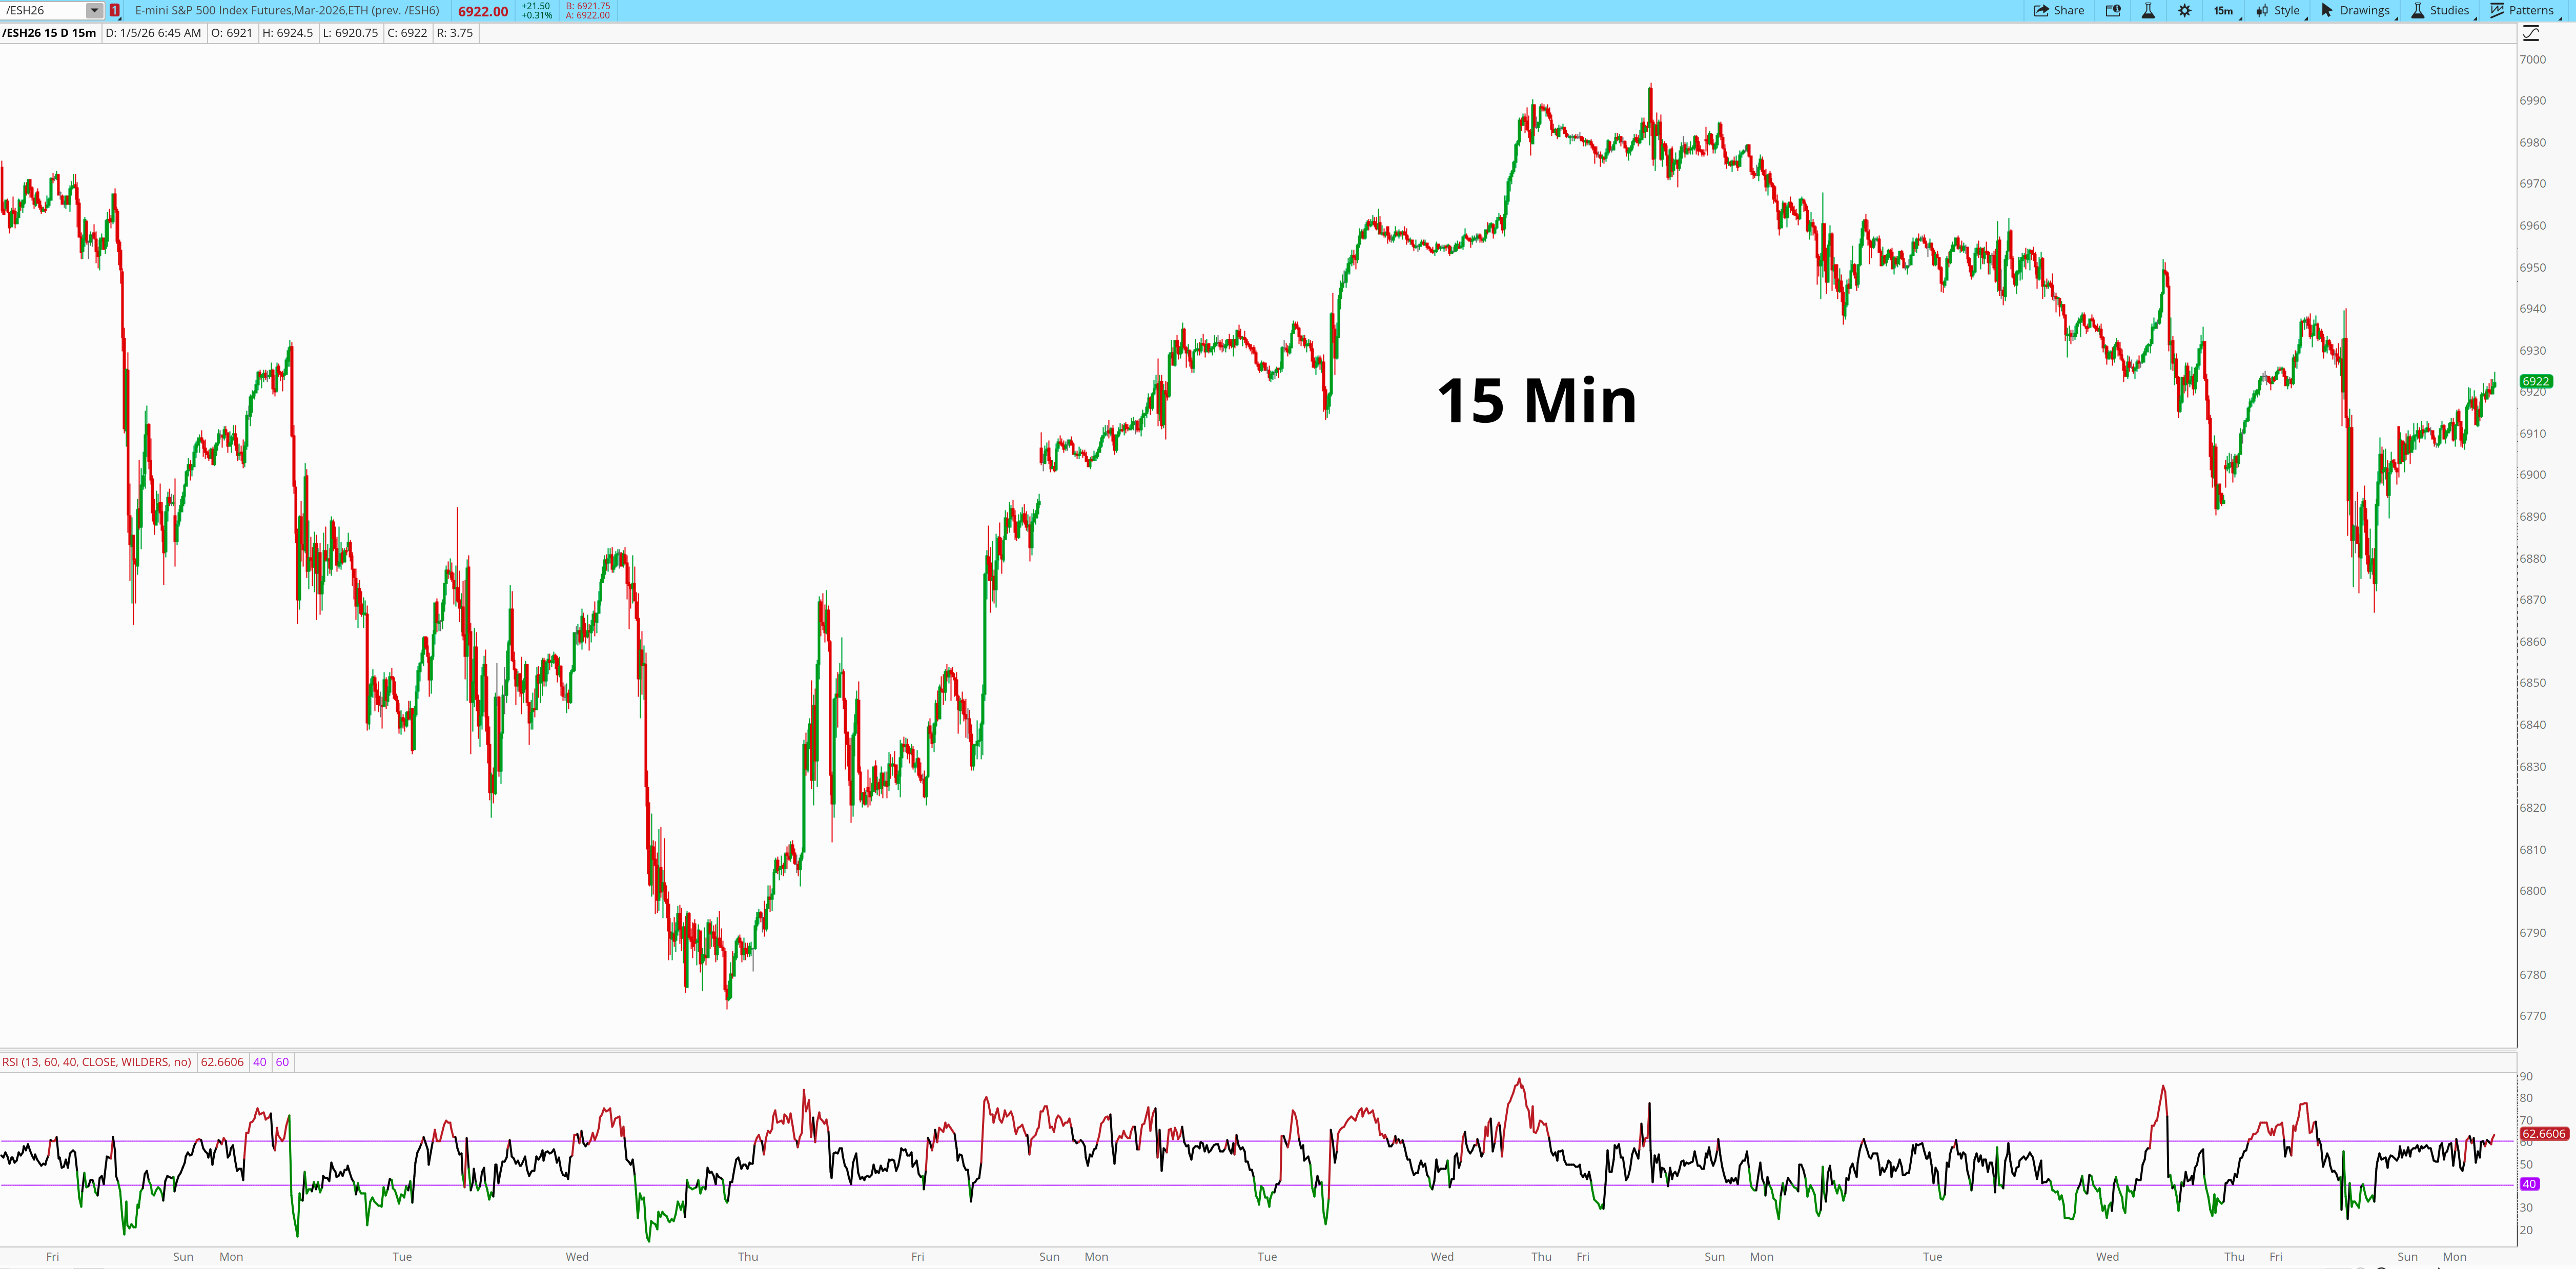
The 15min chart is where intent either confirms or fails.
At this timeframe, the story isn’t about defining structure. That work is already done. It’s about how price behaves as it moves between those higher-timeframe references, and whether momentum confirms or contradicts that movement.
What stands out immediately is the character of recent bounces.
Rallies have been shallow and overlapping. Moves off lows struggle to clear short-term resistance like 6930–6940 before stalling. When price does push through those areas, it does so briefly, without momentum expansion, and then rolls back over. That tells you buyers are present, but not urgent.
On the downside, selloffs have been more decisive. Breaks below intraday shelves like 6918–6920 have produced quick follow-through before slowing. That asymmetry matters. It reinforces the idea that short-term control still leans lower, even as the market evaluates larger structure.
RSI confirms this behavior.
Momentum struggles to hold above neutral during bounces and resets quickly on pullbacks. Rallies lose steam before RSI can sustain strength, while selloffs produce sharper momentum expansion. That doesn’t mean continuation is guaranteed. It means the market is still prioritizing testing lower prices before it’s willing to rotate higher in a meaningful way.
Approach quality has also been telling.
Price has not slowed into levels recently. It has either dropped quickly into them or ground sideways just above them. Neither of those behaviors is what high-quality opportunity requires. Clean setups form when price compresses, pauses, and forces participants to reveal intent. That hasn’t happened yet.
Instead, we’re seeing hesitation.
That’s important to acknowledge. The absence of clean execution behavior is information. It tells you the market is still deciding, and that forcing entries here would mean trading inside the decision, not at the edge of it.
For the 15-minute to become actionable, something needs to change.
Either price needs to slow and stabilize above short-term references like 6925–6930, allowing momentum to rebuild without immediate rejection, or it needs to push lower with follow-through and then fail to continue, creating a clear intent-failure sequence.
Until then, this is not a chart that rewards anticipation.
The 15-minute is doing its job.
It’s telling you to wait.
Here’s The Opportunities I’m looking at Monday morning with ES printing 6920
Keep reading with a 7-day free trial
Subscribe to ES Daily by PriceTrader to keep reading this post and get 7 days of free access to the full post archives.