
March 31 - ES finds a bottom...Right?!? April 1 Gameplan
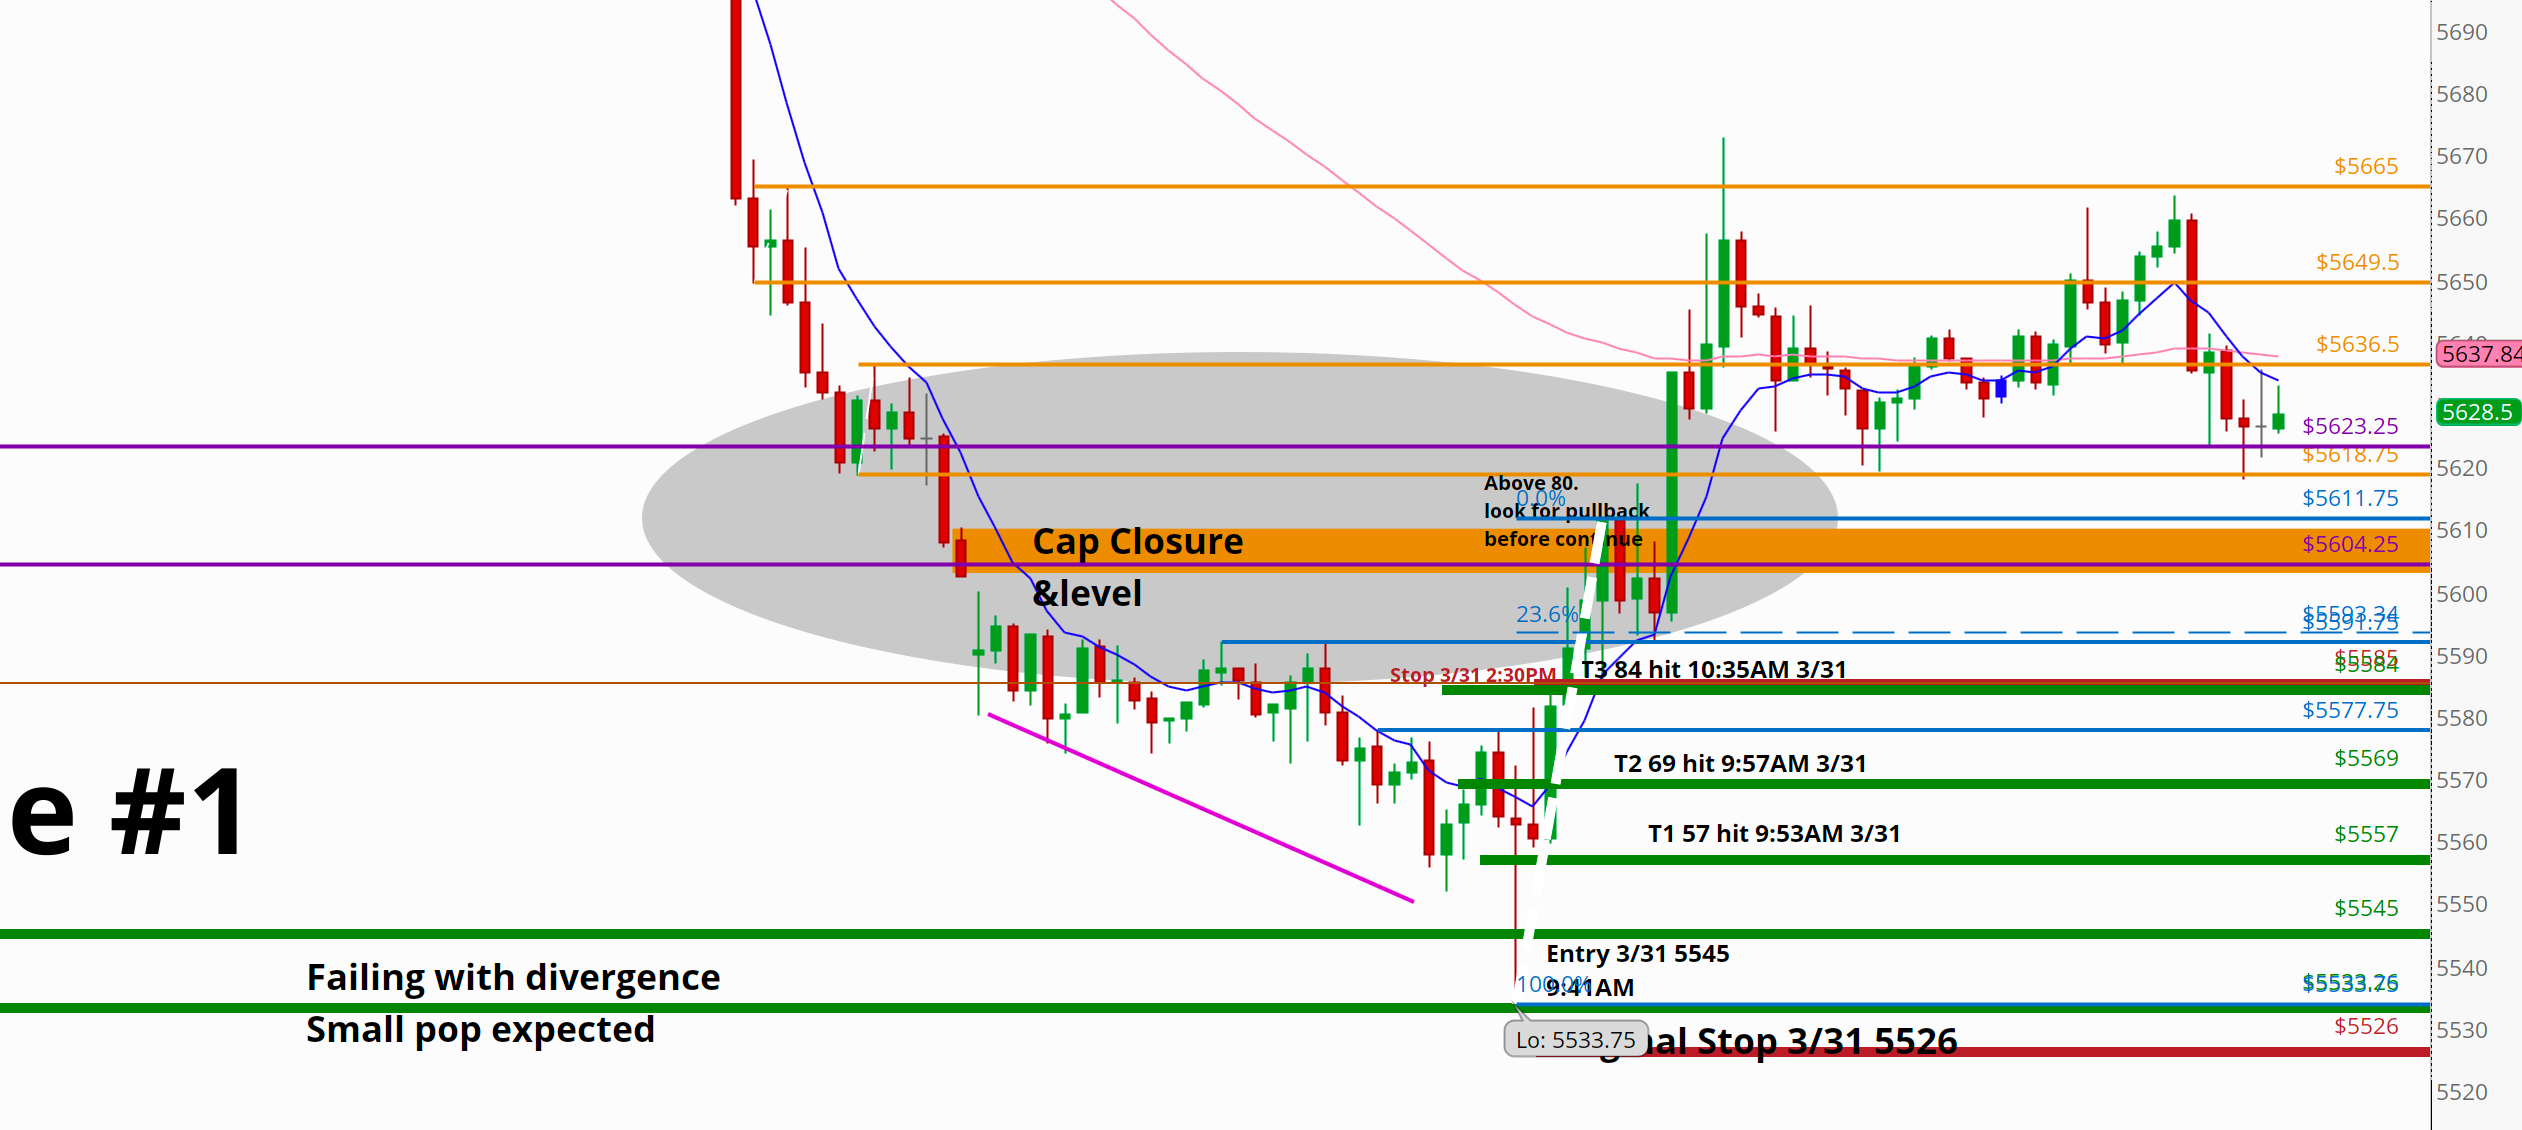
We continue to let our runner run, but cautiously.....

As I opened up the trading platform (I use ThinkorSwim at Schwab) I came to see, and was shocked…We stopped out of our runner from 5545 yesterday.
…….
HAHAHA April fools.
Nah, we’re doing just fine… :-)
We’re currently up 90 points from our 5545 taken at ~9:40 AM EST
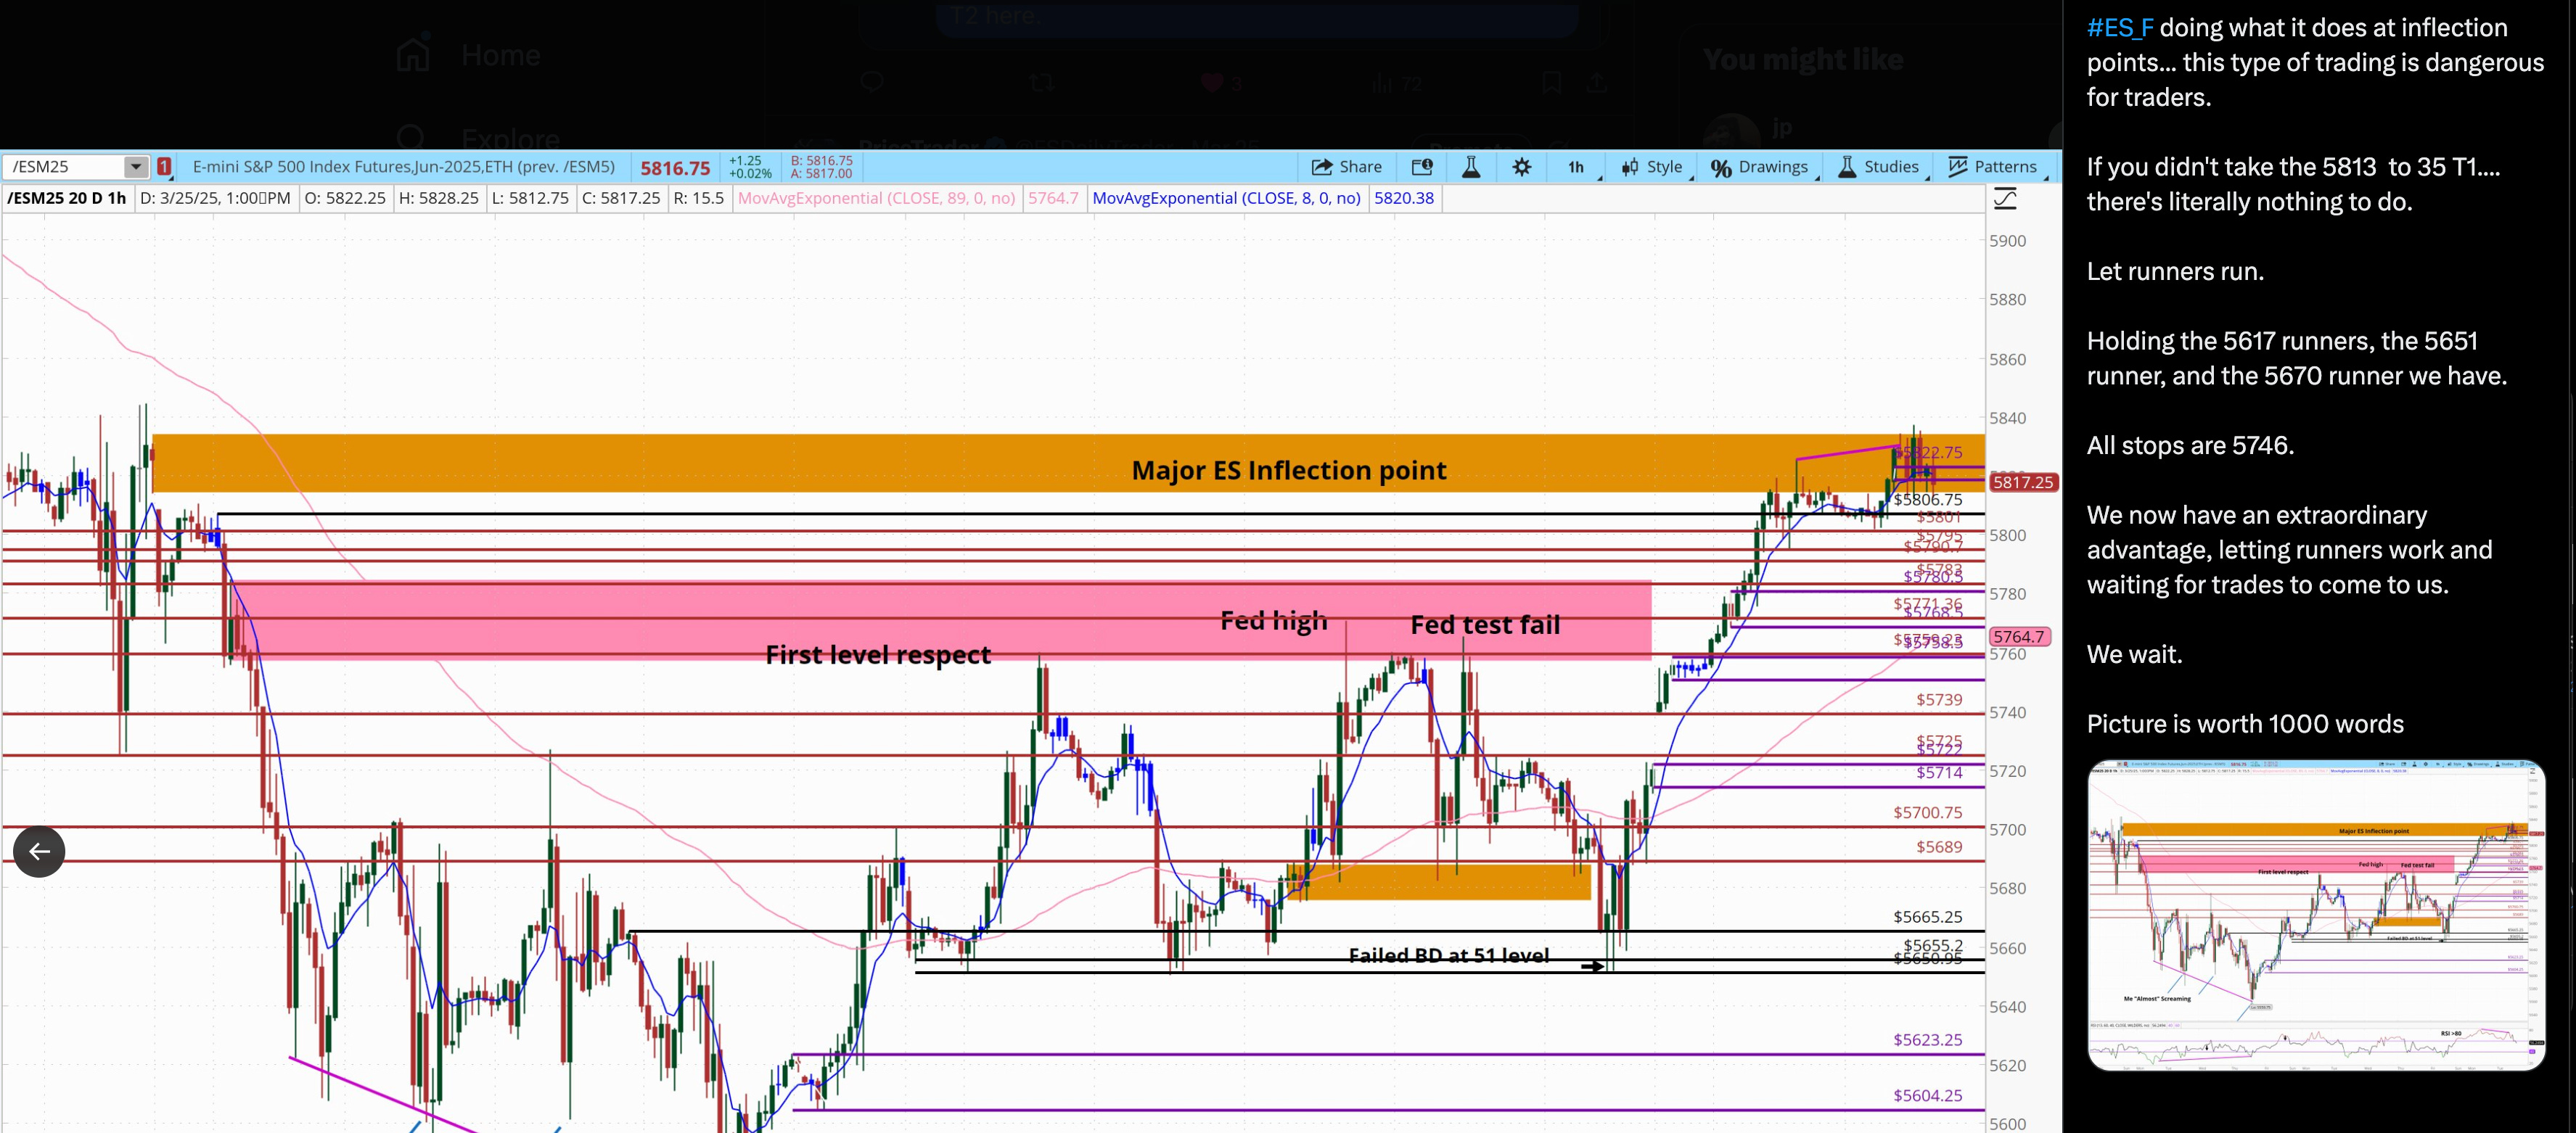
Let’s recap yesterday’s action by starting with a broad picture. Below I’ve included an hourly chart that shows the rally up to the ES Major Inflection Point, the consolidation inside the ES Major Inflection Point, the fall from grace last week, and the bounce yesterday.
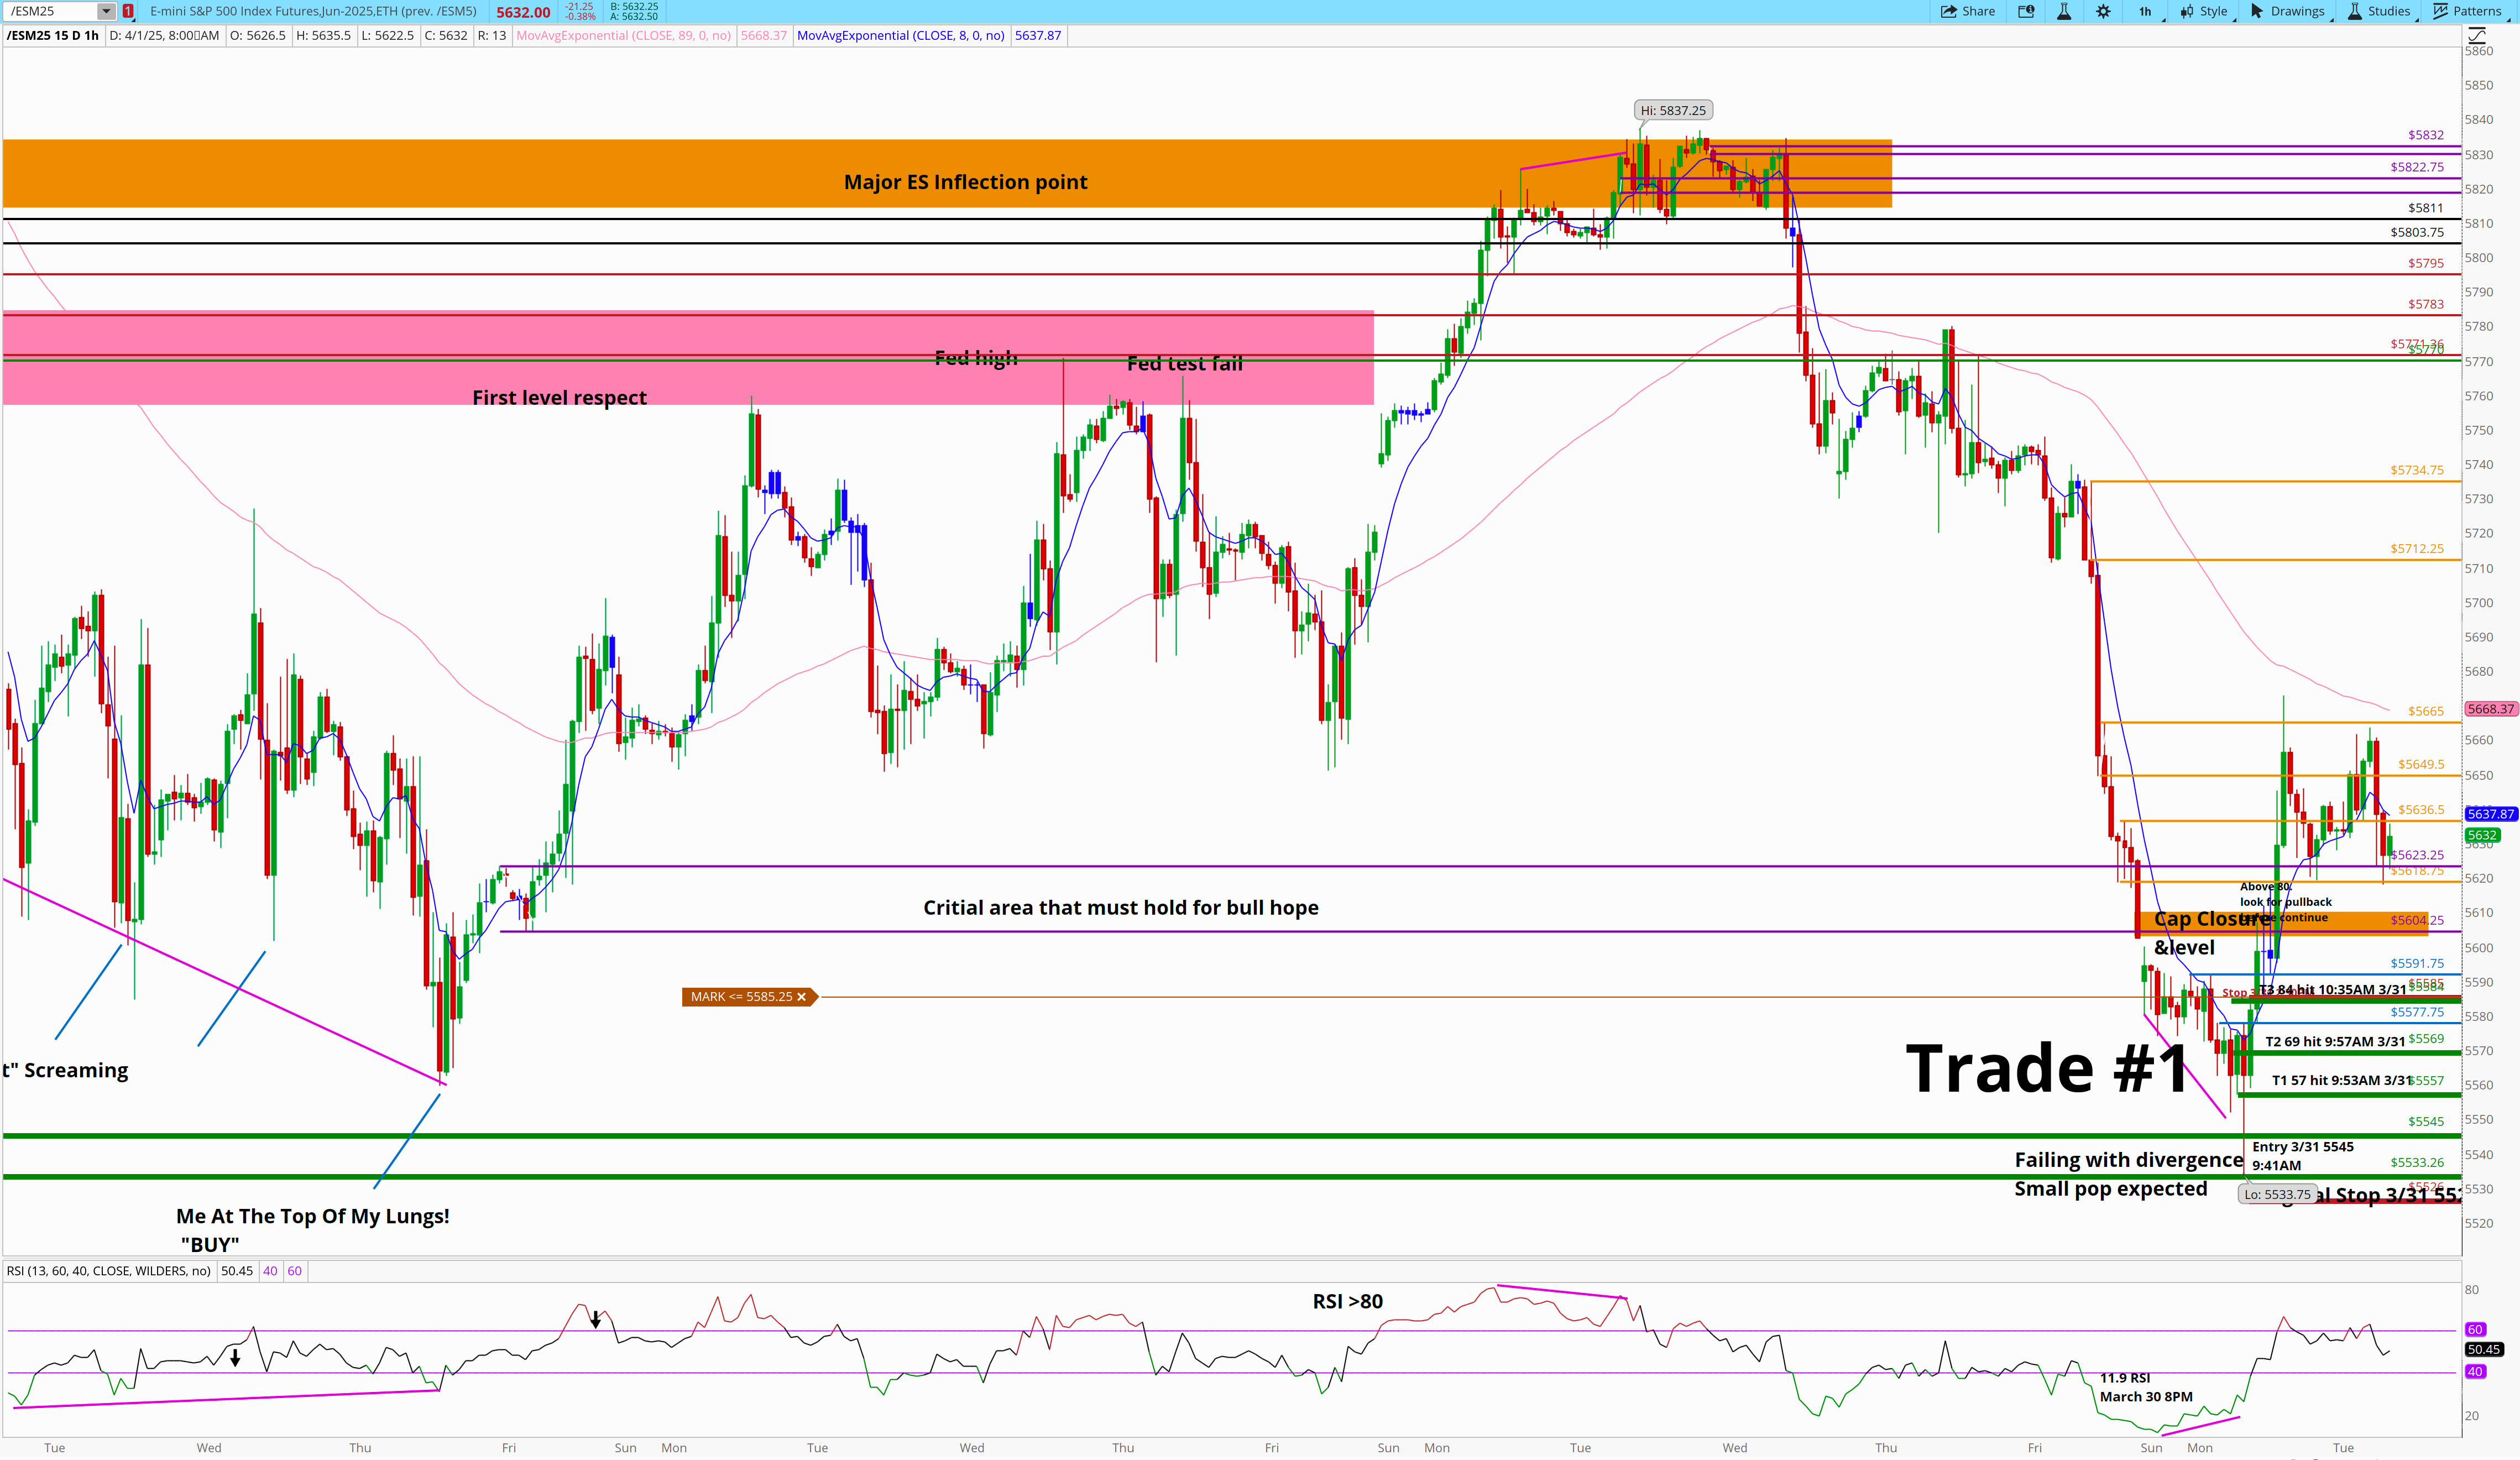
Something I’d like to point out…
In between the purple lines, you’ll see the words
“Critical area that much hold for bull hope”
Interesting to see the low yesterday at 8 and 9PM bounce from there and again this morning.
That is the reason we:
Leave critical areas on the chart (for a period of time)
Use critical areas as odds enhancers if we have additional support.
This is the staple example of a “price magnet” or when support turns into resistance or vis versa. We typically can see price use these areas 4/5 times before we move away from the level.
This is the 4th use here this AM. We saw the price consolidate and break the level Friday at 3PM. As ES found a bottom at our 5545 entry and took off, we tested the lower bound yesterday (after the morning rally) at around 1PM. Then we used it as support again at 9PM and now at 7AM.
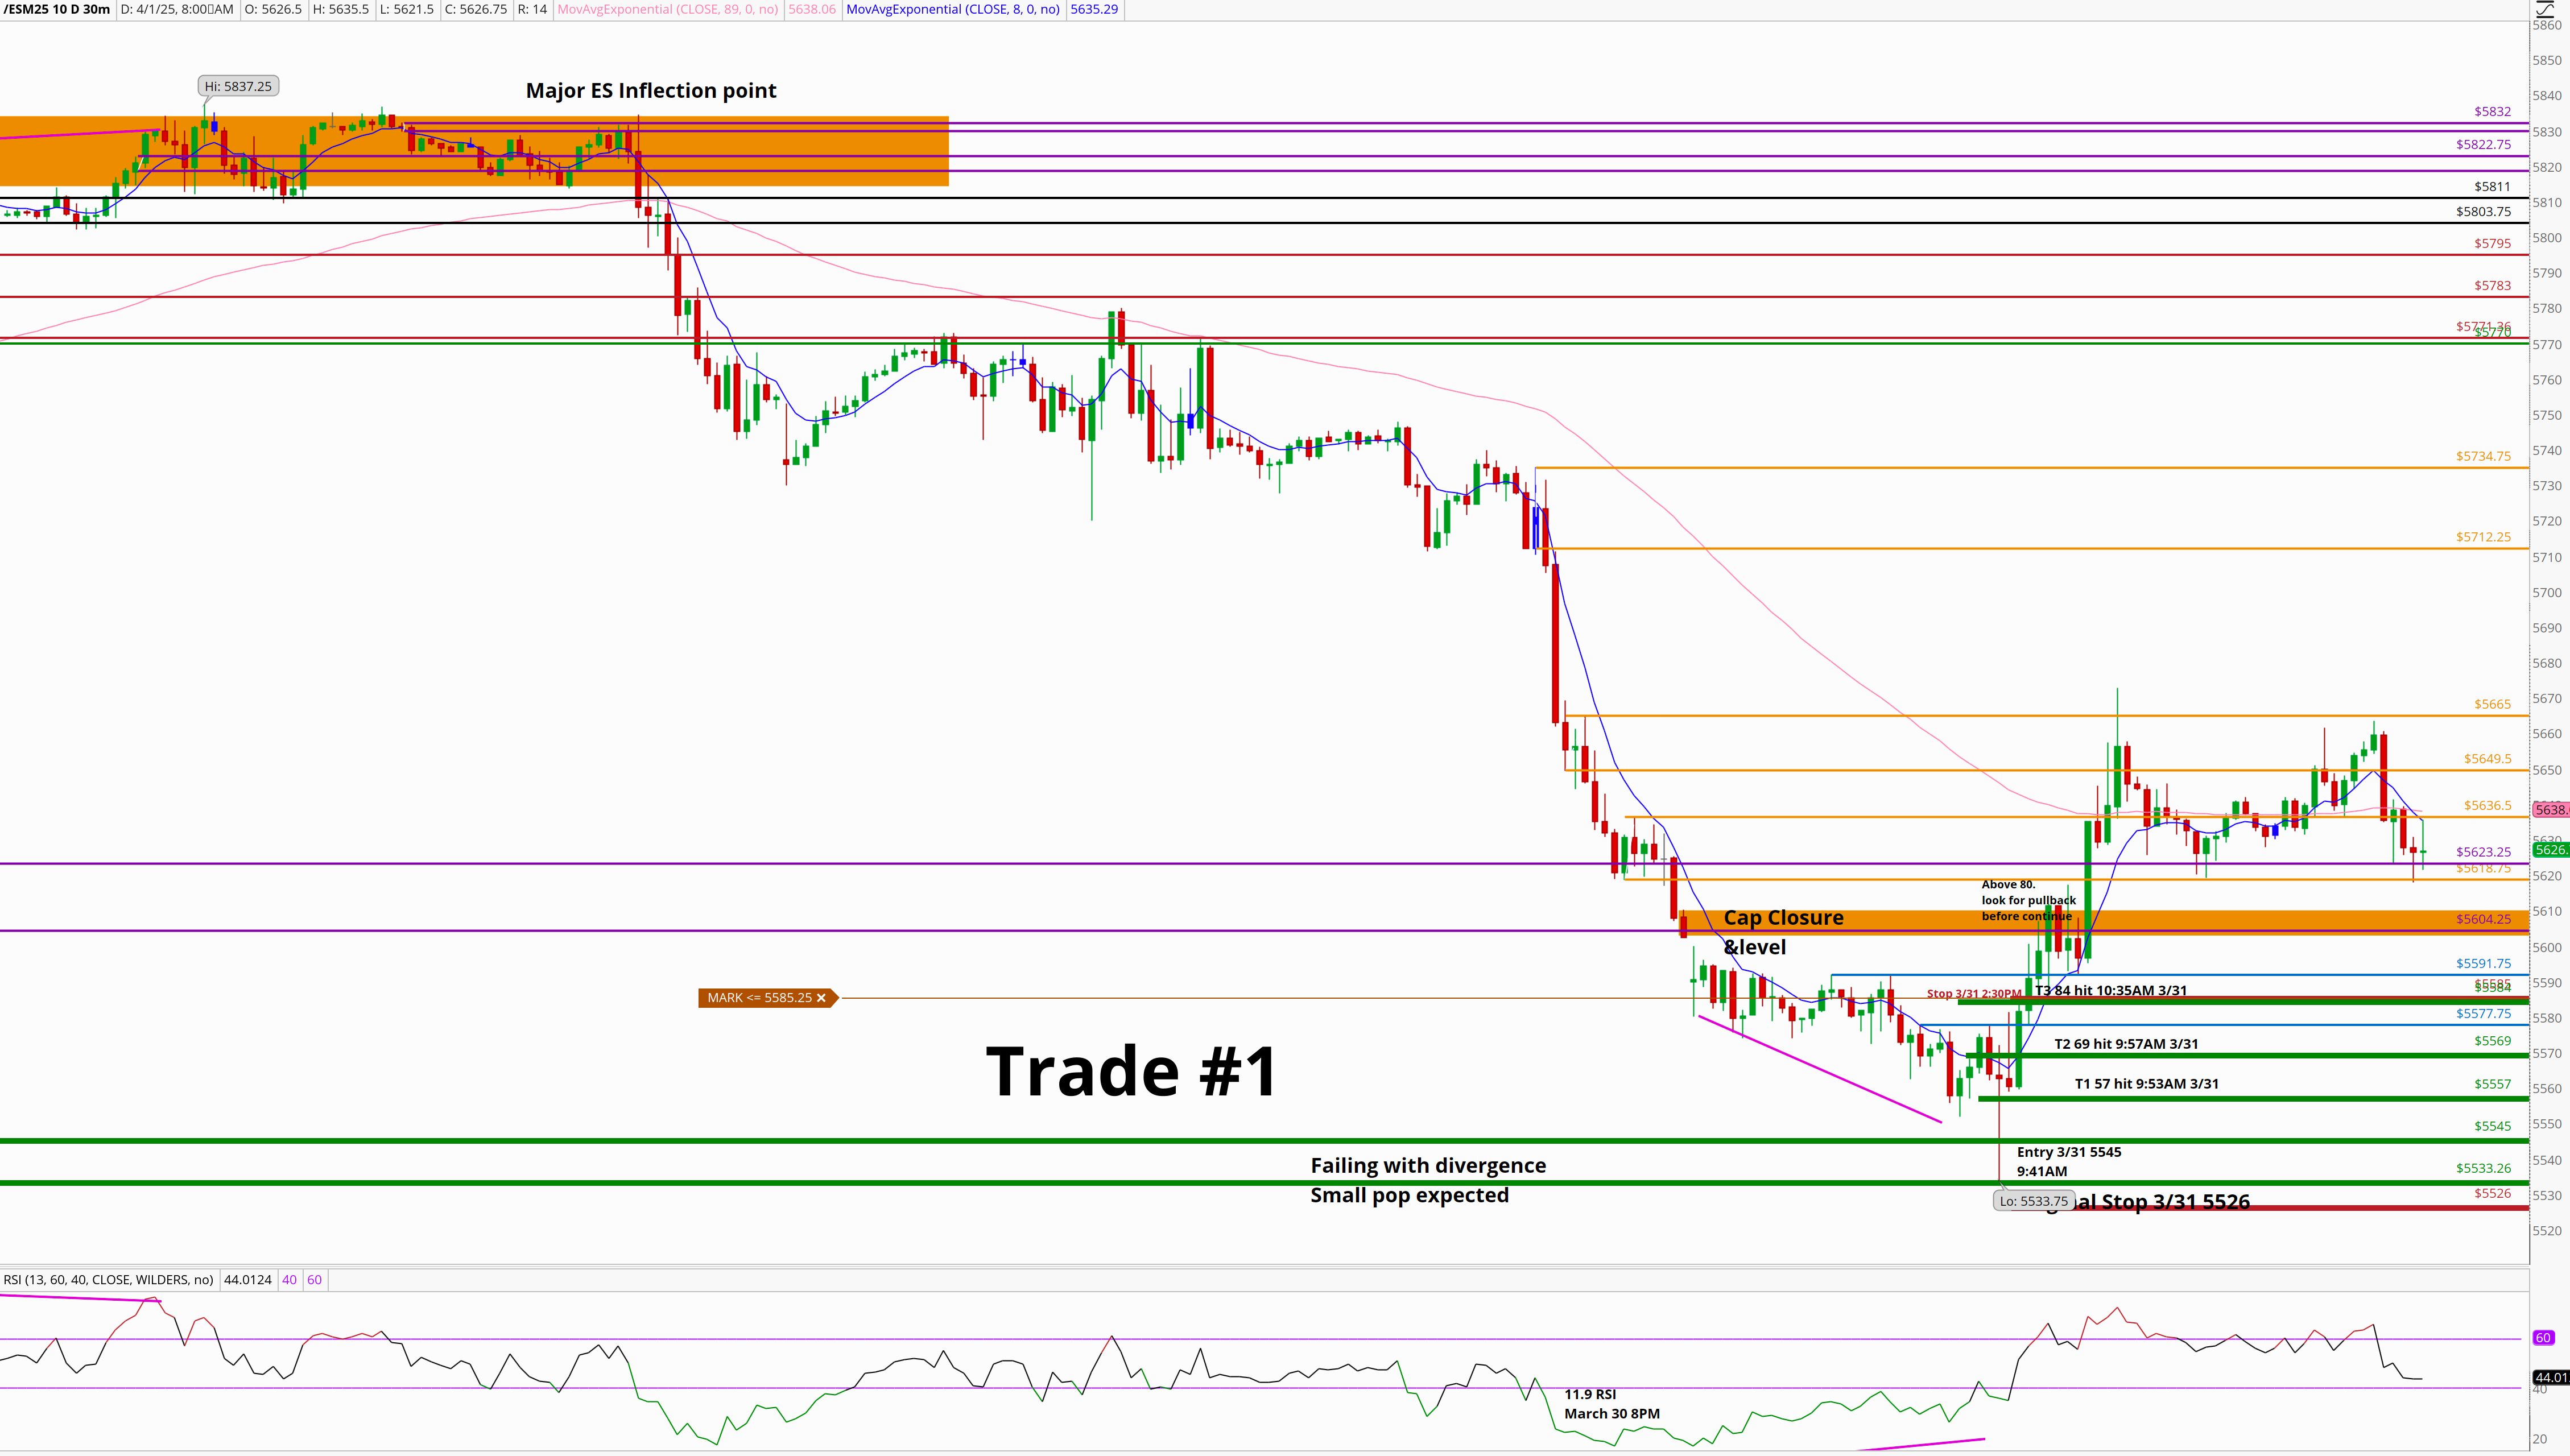
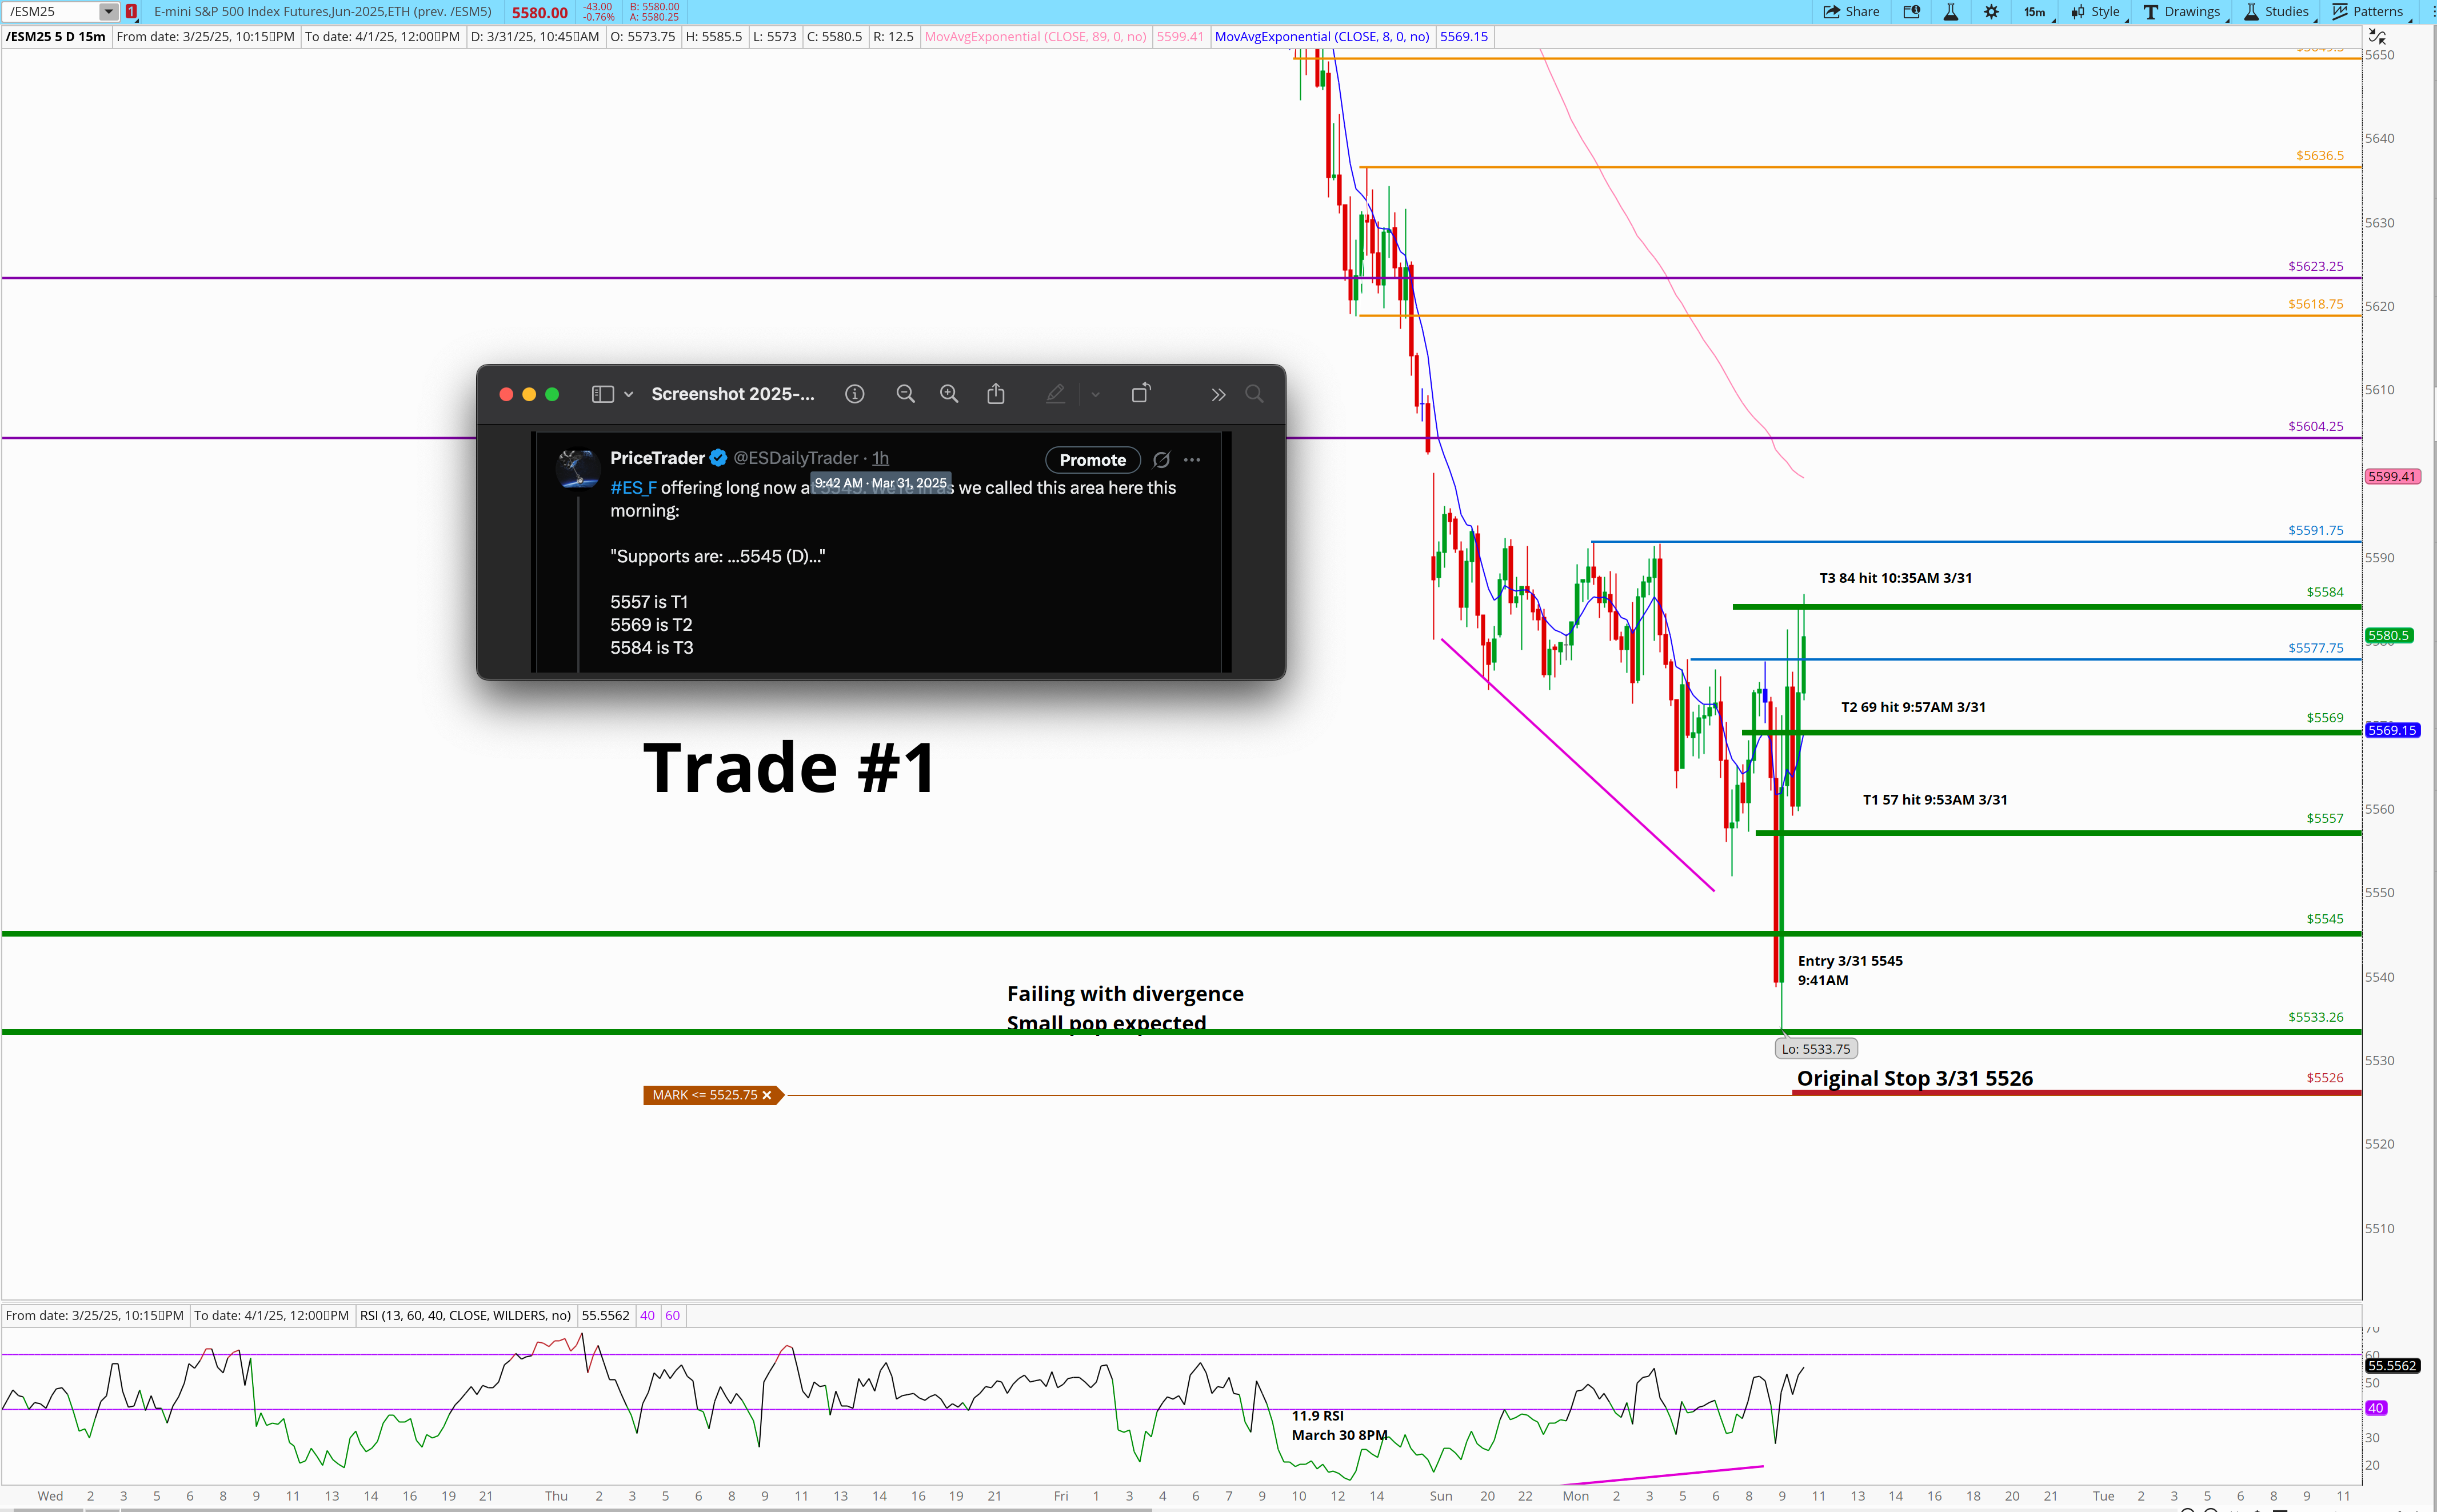
Let’s zoom into price action and explain yesterday’s trade in detail a bit more.
I spend most of my day examining ES and finding lines of support and resistance and have those marked on my chart as areas of interest. They are the same levels I share with ESDaily readers in the section below.
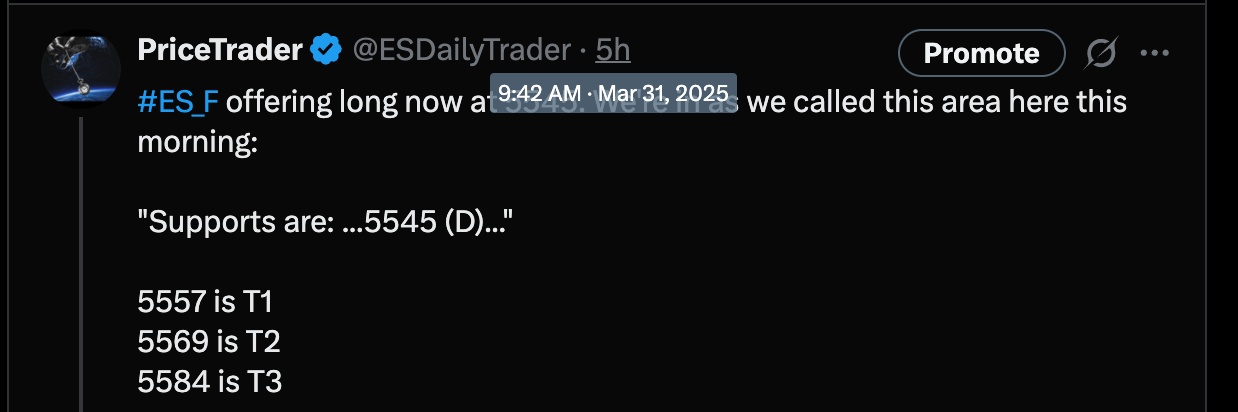
Yesterday AM I wrote:
“Supports are: 5574 (FBD & D), 5560, 5545 (D…)”
5574 FBD worked, 5560 was not taken because of the basing into the level. You can read about approach into level here and why it’s so important. The opportunity for me, cam when 7:30 was offered as a low before the open and we failed to get above 5577, failing to get above 5577 pre market was indicative of the fact ES had a bit more to selloff but that selloff would be short lived due to the volume of support and demand ES had beneath the 5550 level.
As 5545 entered into the level I bid it direct and was filled right at 5545 using a limit order.
Why did I bid direct? Well I didn’t have to, price did in fact go nearly 12 points further to the low of the range before ultimately turning, but we didn’t have a failed breakdown opportunity there. The opportunity was a level trackback, with small time frame divergence across multiple time frames and fresh, solid demand between 5545-5533. I noted on X that I felt I would be wrong about this long if ES hit ~5526:
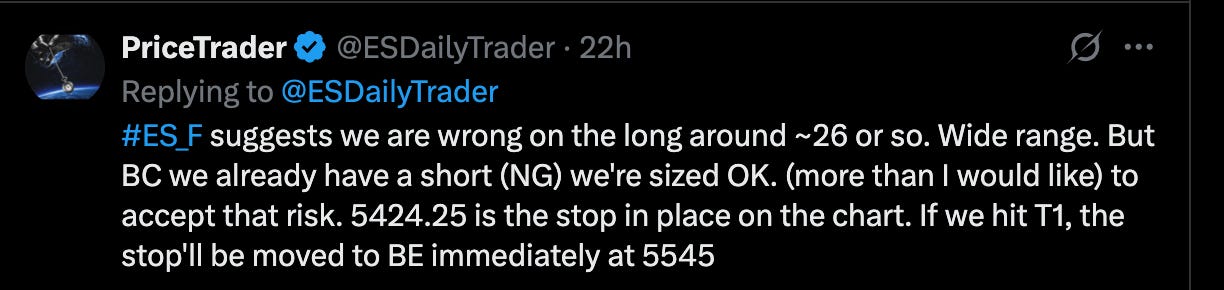
My job isn’t to predict where price is going:
It’s to take Grade A+ setups, and get out when I’m told I’m wrong. Because the range was wider than I wanted, we took less than a full position in accordance to our risk rules.
It worked out just fine.
The end result was a carbon copy derivative of my Core Strategy:
The all come from our Core Strategy here:
#3 I do not get to decide where Targets are. It’s just shy of next level resistance
#4 60-75% of contracts are to be taken at T1
#5 10-15% of contracts are to be taken at T2
#6 Always leave a runner if permitted
As price came into the 5545 level, we started to accept the low having a minor push to 5533. As price recovered the level, we saw momentum rush in the favor of bulls and as quickly as I could post I noted:
In quick order, ES rushed into our target profit range hitting T1 within 15 minutes and we were able to move our stop to Breakeven guaranteeing a profit:

We took 75% off for a 12 point gain and with just a short time, ES continued to rally from the buy price of 5545 to 5569.
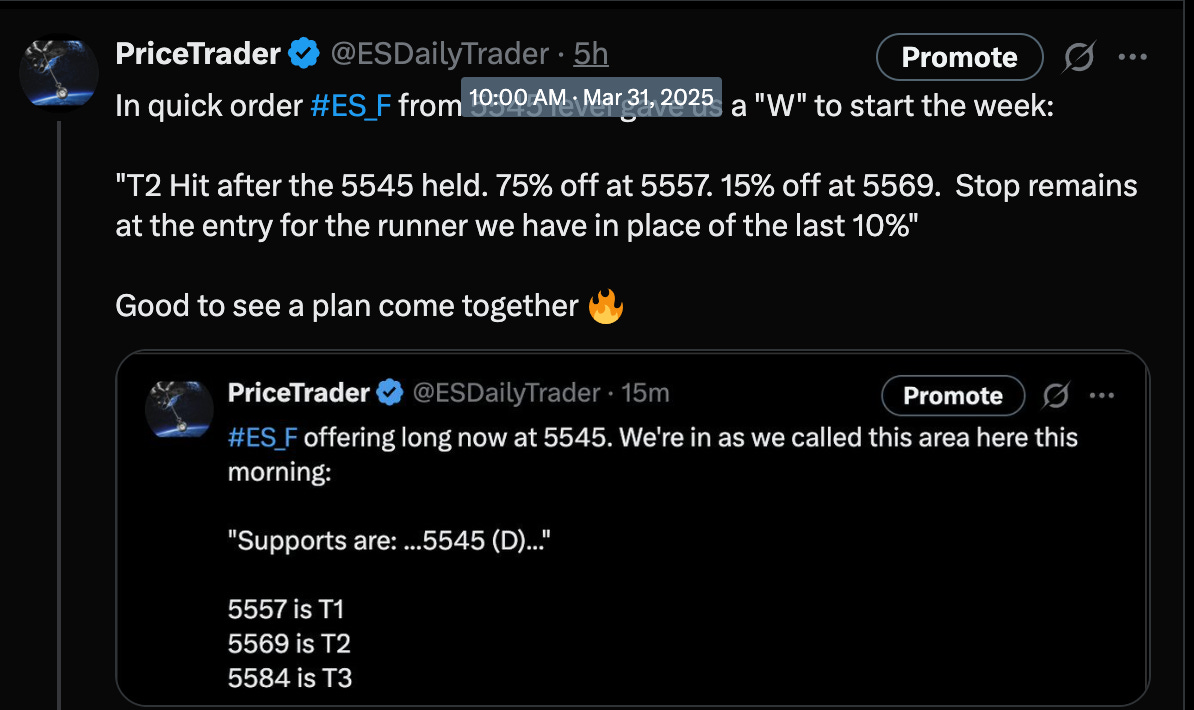
5569 was the consolidation point at which price oscillated for an hr before a MAJOR ES move incurred.
We continue to move up, hitting 5584 as a T3, at which point I took a remaining 5% target, and we’re holding our 5% runner.
Note: From the beginning of this letter I pointed out the “Critical area that much hold for bull hope” In between the purple lines. Price on those is 5604-5623.
I found it prudent to limit the risk, not swing for the fences, taking profits when they are due, by taking my targets until we got up to that point.
You can see it was the ultimate right decision as price did hold that ling and result in a 23.6% pullback (a Fib retracement) after the rally:
The Fib extension is in blue:
That’s all the bears got as we continued to rally into the close to reach a high of 5672.50, nearly 130 points from our entry just a few hours earlier.
The more than made up for the 2 losses we took March 26 by 3X and we’re now sitting on a runner, waiting for new opportunities.
We continue to move up, after hitting 5584 as a T3, at which point I took a remaining 5% target, and we’re holding our 5% runner.
The current stop on our 5545 entry is 5585.
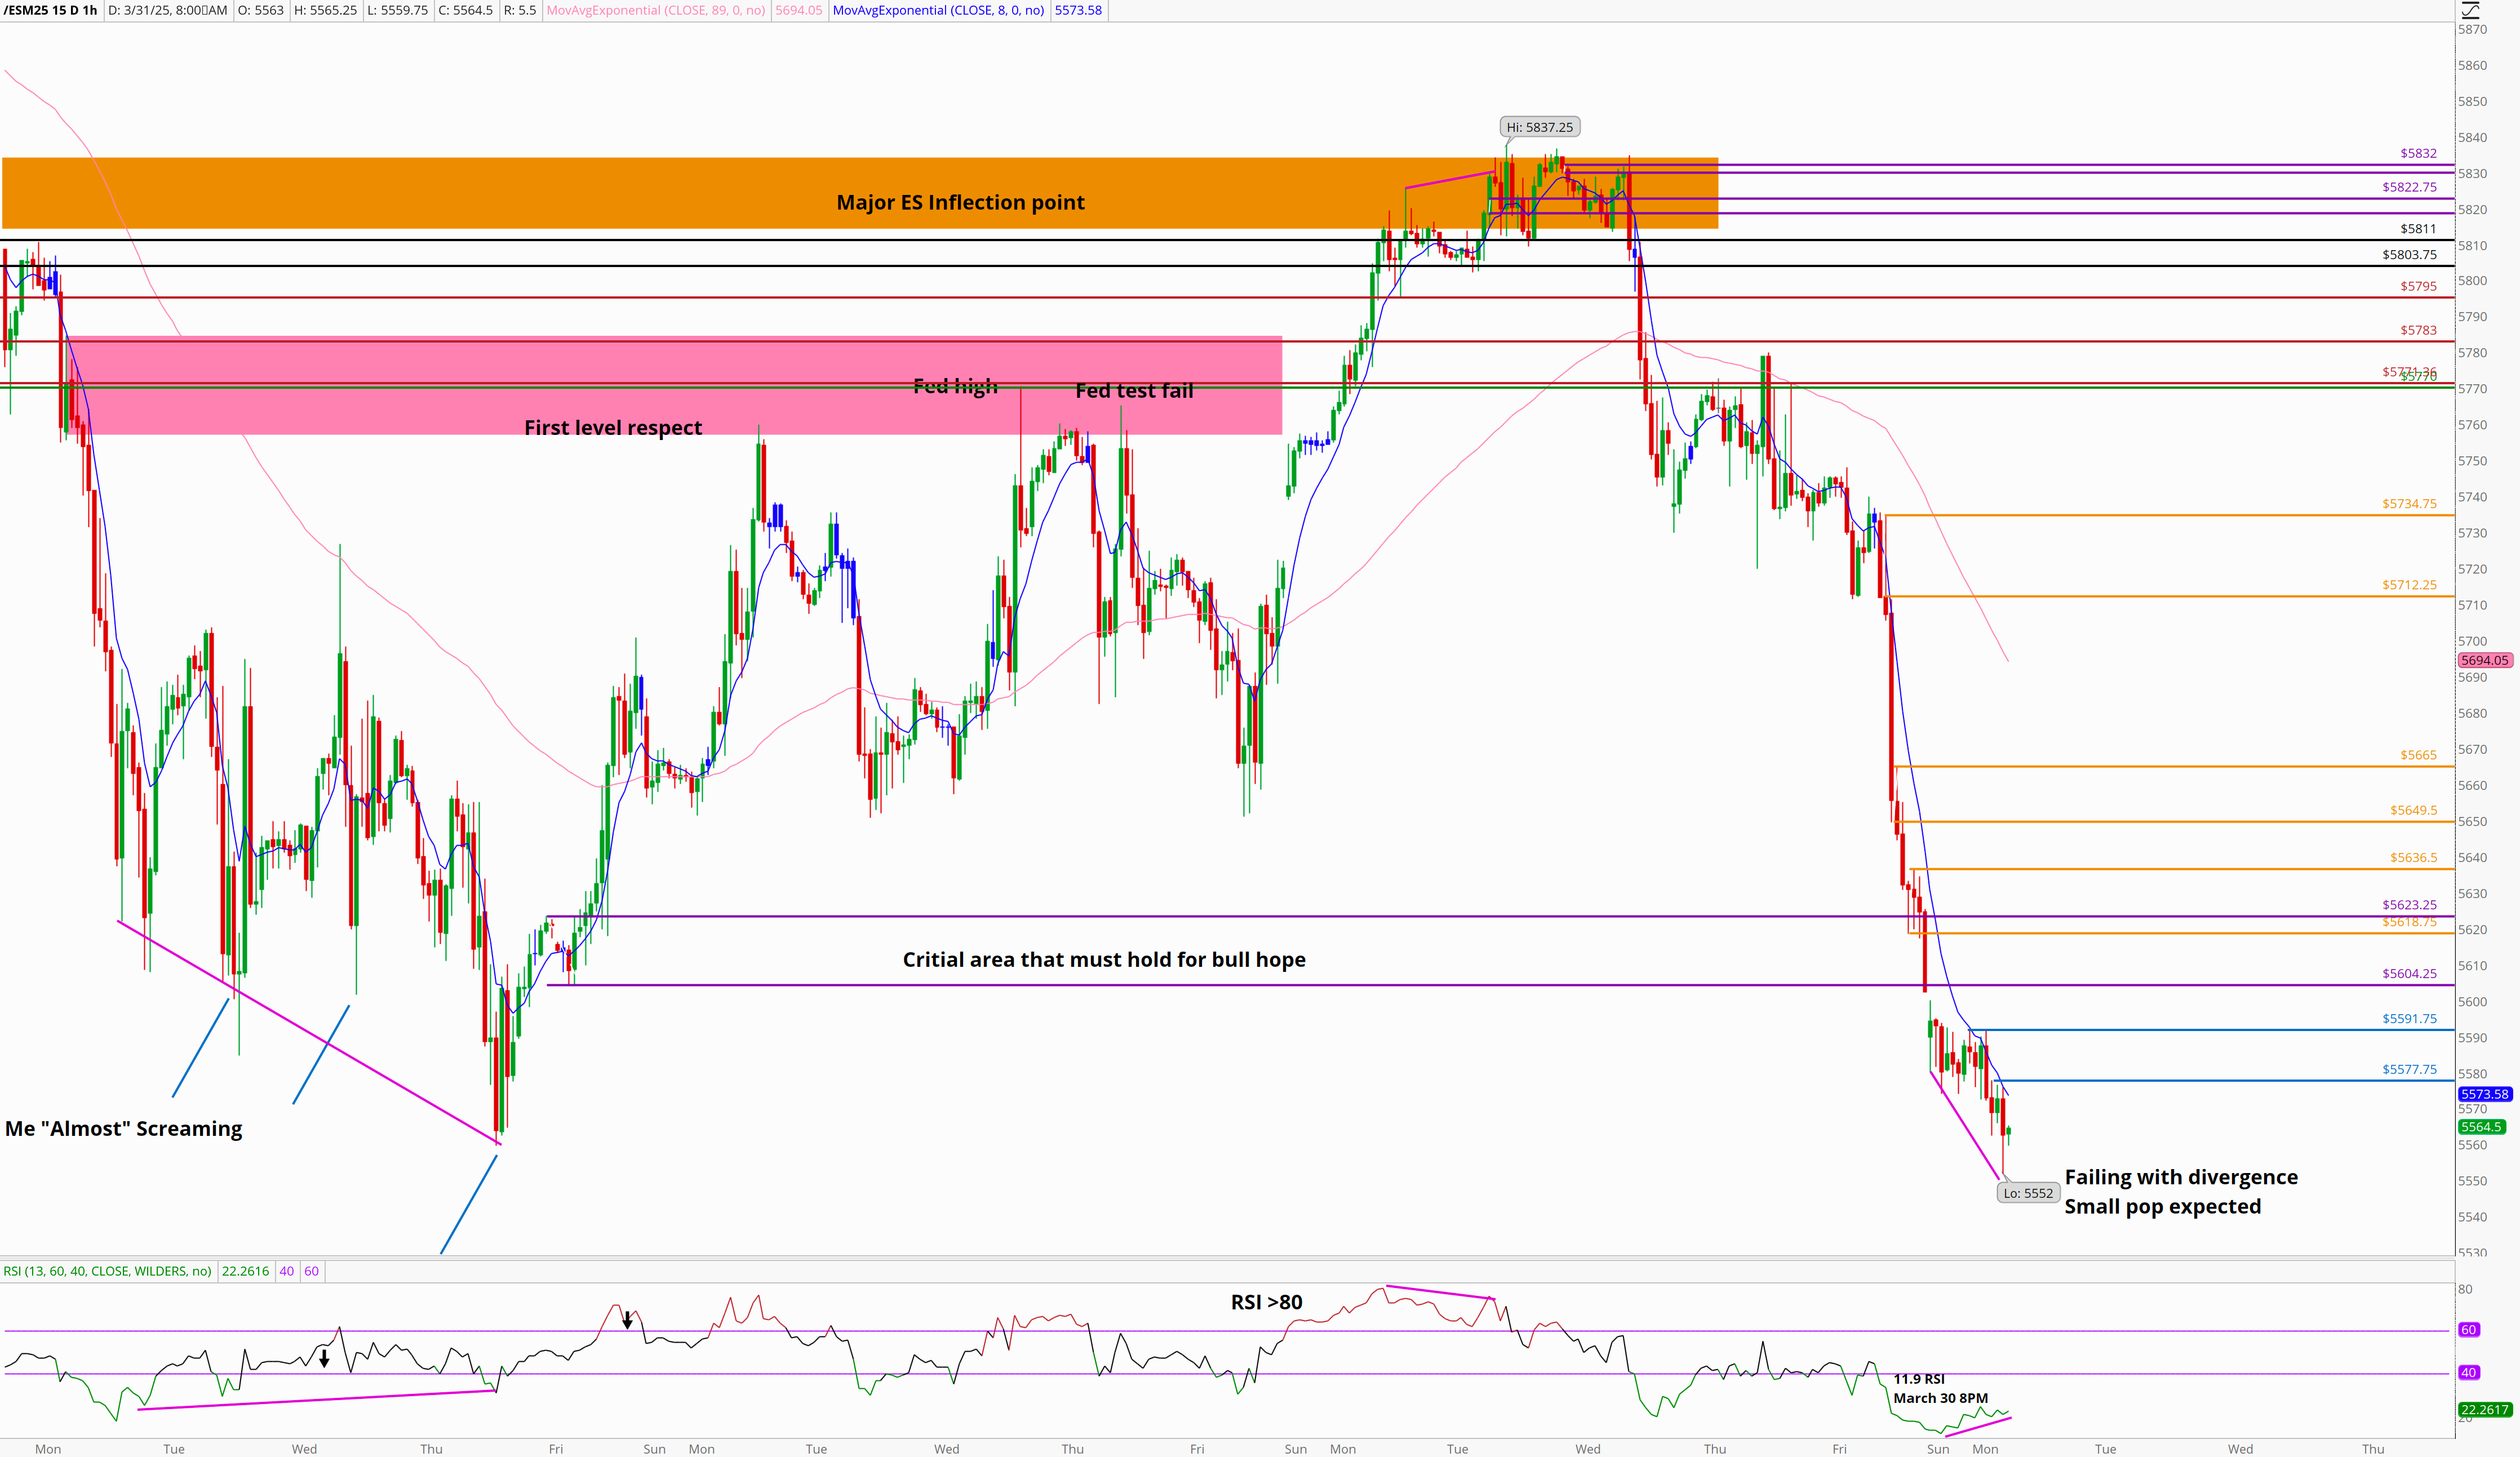
We saw this pullback coming.
And as ES went into the ES Major Inflection Point, we saw consolidation, price starting to diverge via the RSI, and we noted a pullback was likely:
Note from March 26 newsletter:
We now have two signs that a pullback may be coming
#1 The Negative Divergence indicated on the chart in pink lines. We have a higher high in price Monday at 3PM and lower momentum on the RSI.
#2 So far, we’ve failed to breach the 5836.50 high from 8PM last night.
We look to all the technicals and I’m literally 50/50 that we’re going to see another pullback, VS this being a continuation and we move above. Higher time frames suggest pullback, lower time frames suggest continuation.
As noted in 3/26 letter, we got it.
Here’s March 26
Here was March 31 AM pre market:
And here’s where we were at after updating the 5545 entry
As noted in this yesterday’s newsletter about the 5545 level:
Here’s the news data that may matter this week:
Not much in the way of news to break us out of this one way or the other this AM but we do have a solid week of news:
Tuesday April 1: ISM and JOLTS 10AM EST
Wednesday April 2: ASP Non Farm Payrolls 8:15AM EST
Thursday April 3: Unemployement Claims 8:30EST & ISM/PMI 10AM EST
Friday April 4: Average Hourly Earnings Non-Farm Employment ChangeUnemployment Rate 8:30AM
Will this 250 point selloff continue?
Does today’s 140 points from low to high hold?
Are we looking at shorts or long?
Let’s get to it.
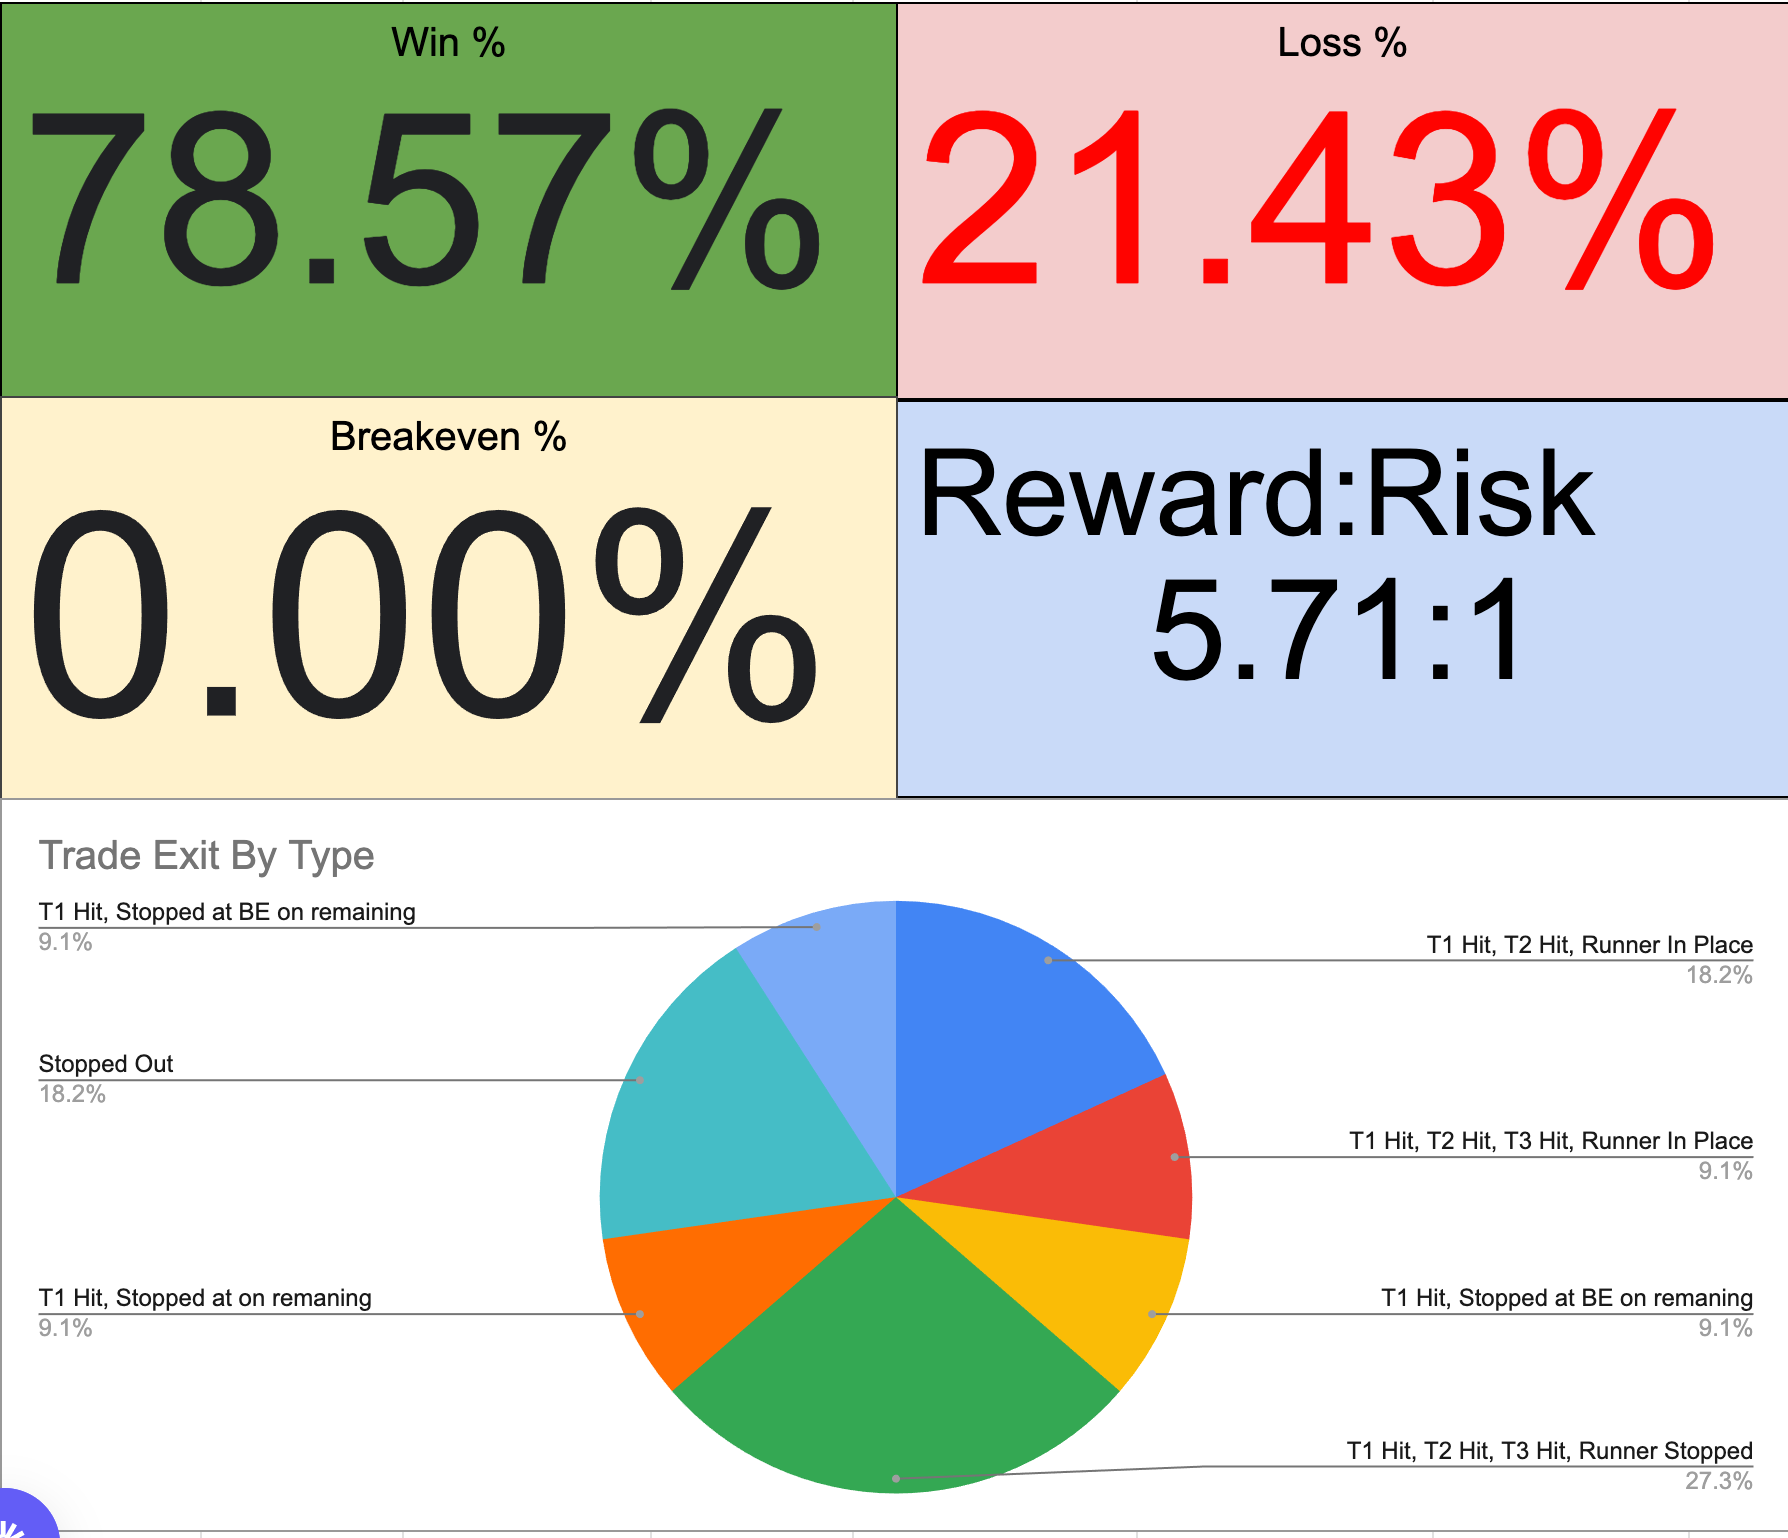
Here’s where we stand:
ESDaily Scoreboard
Keep reading with a 7-day free trial
Subscribe to ES Daily by PriceTrader to keep reading this post and get 7 days of free access to the full post archives.