
When Do Trends Change? How to Spot Reversals vs. Pullbacks in ES Futures
Identify trend reversals using RSI divergence, price structure, and supply/demand zones—featuring a real ES 45-min chart breakdown.

Note: Part 2: When Trends Change - A Look After When The Signal Occurs
This week’s ES price action has been one for the books—not because of tight structure or trap-filled ranges, but because of how clean and binary the move has been.
It’s been impressive.
After a 150-point rally in just 15 hours starting Sunday evening, price ripped higher all week without building any meaningful base.
This is expansion without structure.
As noted in this week’s ESDaily gameplans, this type of pure expansion is inherently fragile:
“Expansion without compression is fragile. The longer price runs without rest, the more binary the next move becomes—continuation or failure, nothing in between.”
There’s been no base-building, no meaningful pullbacks, and no sign of volume memory. Just straight-line price discovery. And while bulls have enjoyed the ride, many are now asking the most important question of the week:
“When does this change?”
ESDaily subscribers can find the highest probability opportunities here
Spotting Pullbacks vs. Real Reversals in ES
Understanding when a trend is actually shifting—rather than simply pulling back—is one of the most important skills a trader can develop.
The difference determines whether you’re entering a new directional move… or buying directly into a trap.
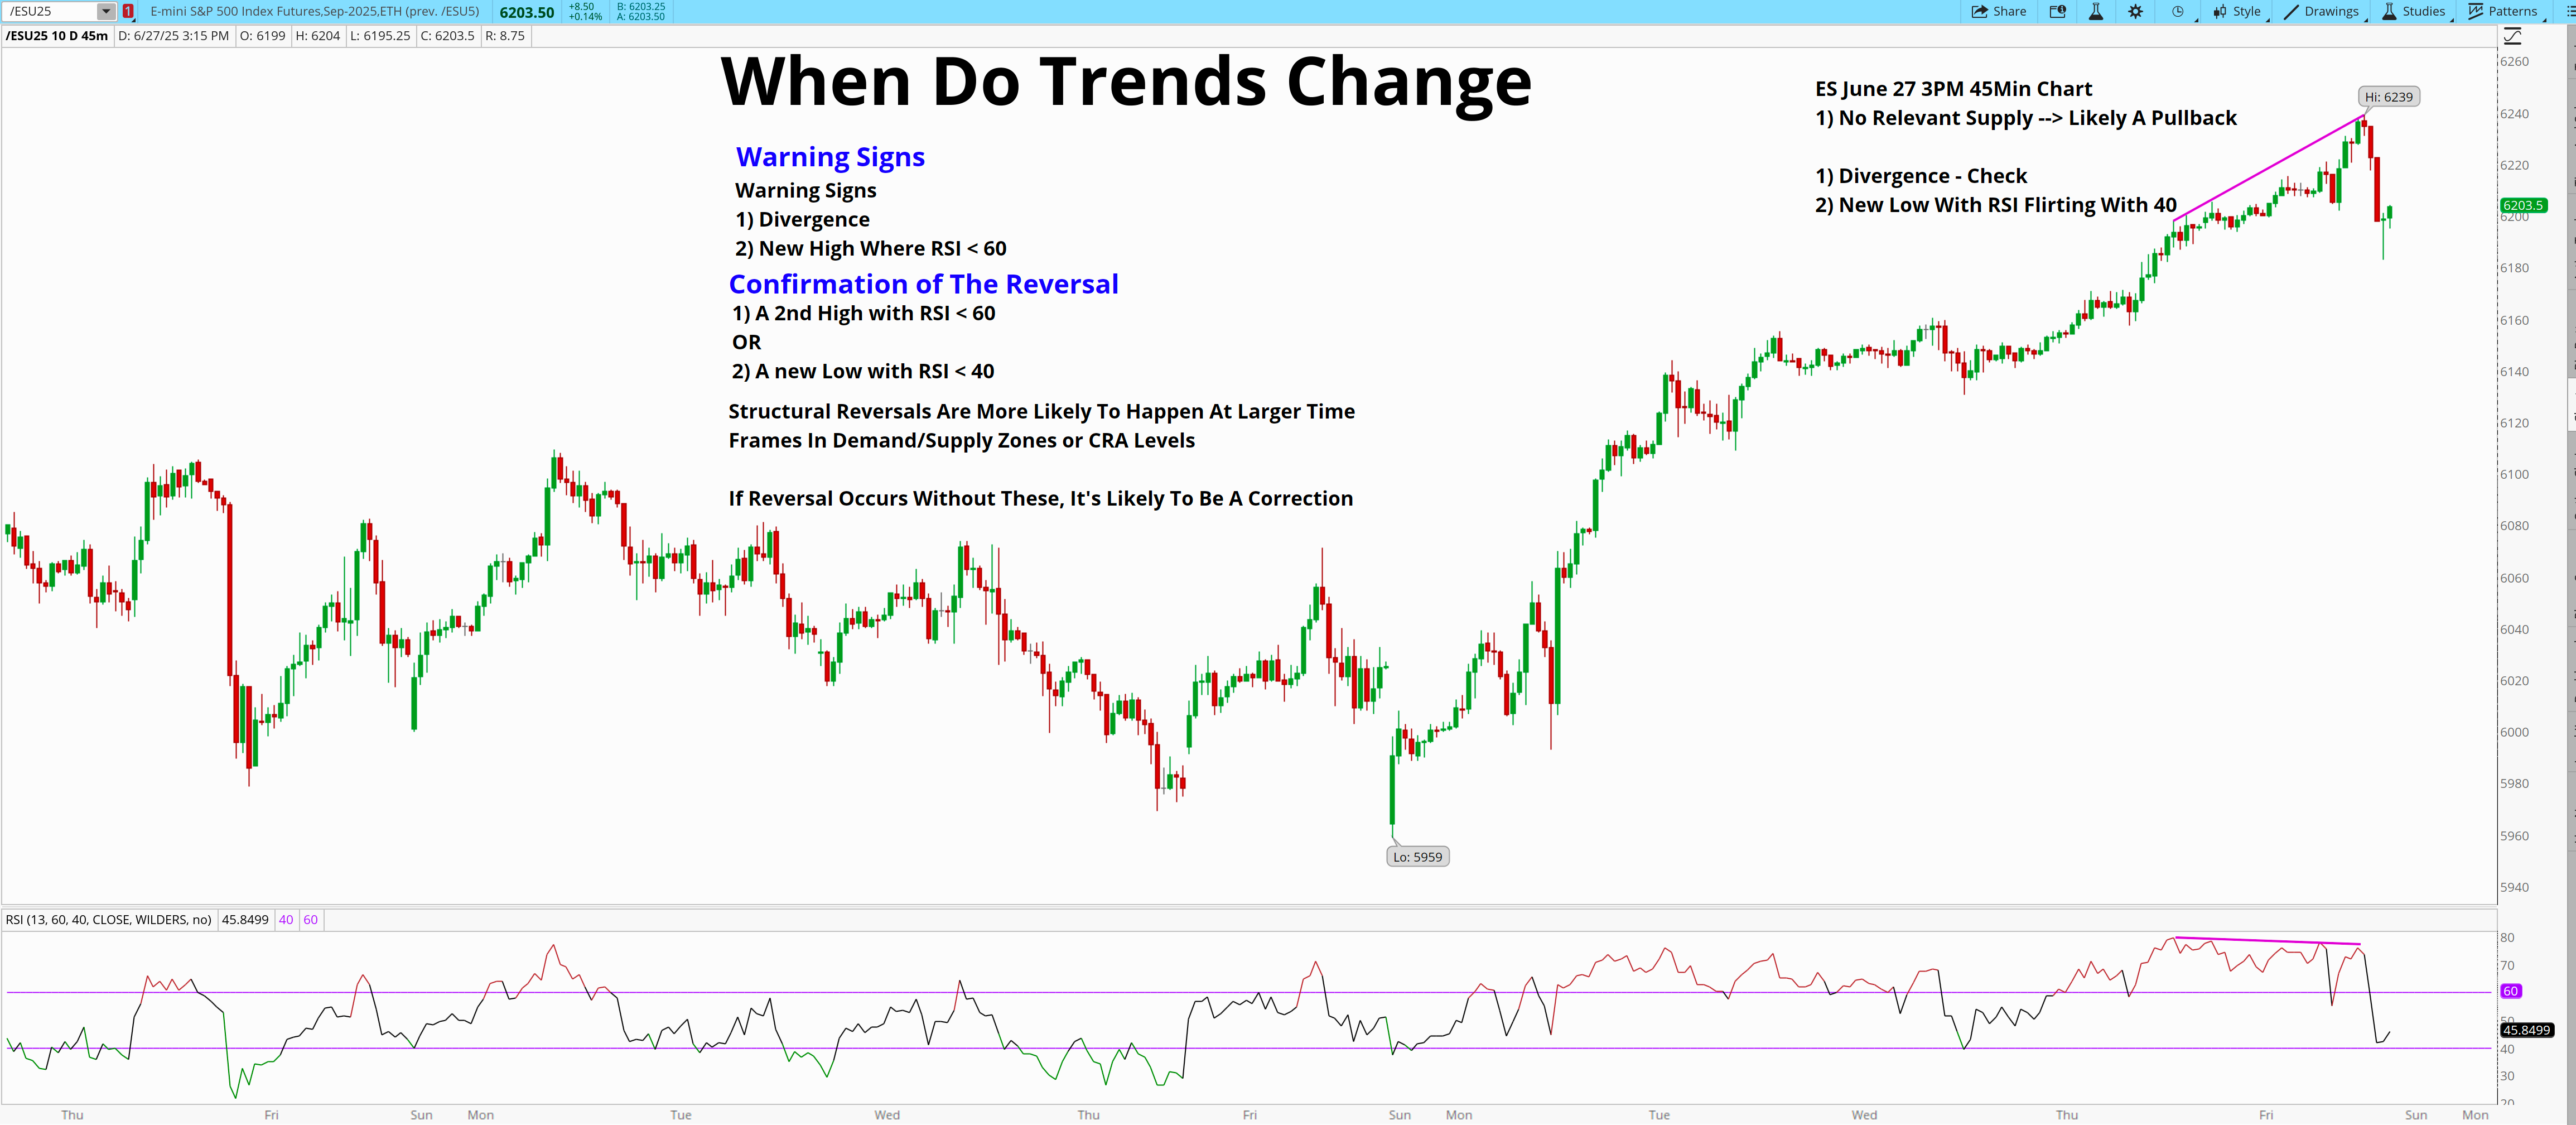
In this post, we’ll walk through a chart of today, June 27 chart of the S&P 500 E-mini futures (/ES), and break down the precise signs of potential trend reversal versus a simple correction.
Being that ES is having it’s first significant pullback all week (it’s waited until the last hour - literally) it’s a timely note.
Here’s a chart for you to read alongside:
The Big Idea: Corrections Are Not Reversals
Most intraday trends don't reverse immediately. They pause, correct, or retest levels before flipping structure. That’s why we separate the warning signs from the confirmation signals.
The difference is subtle but critical:
Corrections = temporary pauses, shakeouts, or dips in the trend.
Reversals = structural shifts supported by both price and momentum change.
Warning Signs of a Potential Reversal
Before any true trend change, we often see early warning signs. These aren’t confirmations—but they’re the first clues:
Divergence – When price makes a new high, but RSI does not. This signals waning momentum.
New High with RSI < 60 – Even if price makes a fresh high, weak momentum (RSI under 60) implies buyers are losing steam.
In the June 27 chart above, we clearly saw divergence near the high at 6239. RSI failed to confirm the move, providing our first yellow flag.
Confirmation of the Reversal
Warning signs alone aren’t enough. For confirmation of a real reversal, we need one of the following:
A second lower high, where RSI stays below 60. This confirms the rally is failing to gain strength.
A new lower low where RSI drops under 40. This signals strong bearish momentum and a likely trend shift.
On the chart, as price pulled off the high, we saw a new low with RSI flirting with 40—suggesting confirmation might be underway.
But there’s more context to consider.
Context Matters: Supply/Demand, Critical Reclaim Areas, & Larger Time Frames
According to the framework:
“Structural reversals are more likely to happen at larger time frames, in demand/supply zones or CRA levels.”
In other words, trend changes don’t occur in isolation.
They tend to happen at key levels—especially ones that have been tested over time and represent a consensus area of value (like prior demand zones or CRAs—Critical Reclaim Areas).
If price reverses without hitting a supply or demand zone, it’s more likely a correction than a structural change.
🟢 In this case (June 27, 3PM, 45-min ES chart), the note says:
“No relevant supply → Likely a pullback.”
That means despite the RSI drop and divergence, price hasn’t yet reached a strong enough supply zone to anchor a real reversal. That makes this move more likely to be a healthy dip within a broader trend.
Final Thoughts
Successful trend trading means knowing when to lean in and when to step back.
I use confluence in my trading to help eliminate the emotion.
By combining momentum signals like RSI divergence with structural levels like demand zones and CRAs, you can dramatically improve your odds of catching real trend shifts—while avoiding costly fade attempts.
Is this a structural change… or just a breath before the next move?
For Part 2 Go Here: Part 2: When Trends Change - A Look After When The Signal Occurs