
When the Environment Changes - March 25

It’s only in retrospect that markets reveal when the environment has changed.
While traders tend to look for clear signals…. something definitive like a break, a headline, or a catalyst… the reality is that regime shifts rarely present themselves in such a clean or isolated way.
More often, they emerge through a gradual erosion of what once worked.
Trades that previously extended begin to stall.
Momentum that once followed through begins to fade.
What had been consistently rewarded starts, quietly at first, to be penalized.
That process appears to be well underway.
The best example of this is not found in macro first, but in execution.
Over the past several weeks, the number of Failed Breakdown setups that initially worked, but failed to transition into continuation, has increased meaningfully.
Here’s what I mean:

On March 1st, the FBD at 6881 reacted appropriately, but could not extend into new highs. The following day, the same occurred at 6843. These were not failed trades in the traditional sense. Yes, they produced movement.
That distinction matters.
These were not failed trades.
They were failed transitions.
In stronger environments, these types of setups do not simply resolve imbalance. They build on it. They reclaim, hold, and push into new highs. What we saw instead was something different. Movement without progression. Reaction without continuation.
By March 3rd, the pattern repeated at 6807.
The market rallied sharply into 6950, but once again failed to build on that strength.
Another lower high.
Another inability to expand.
Three FBDs in sequence, all producing movement, none producing trend. That is not a setup issue.
That is an environment issue.
The 8/89 cross on the 4-hour marked the structural shift, but the evidence was already there. What followed confirmed it. Lower lows formed. Rallies became shorter, less decisive, and increasingly contained. The move lower into March 8th was not a surprise—it was a release. The market had attempted multiple times to re-establish higher structure and failed. The repricing that followed was simply the consequence of that failure.
The week of March 12th introduced balance, but not strength. A low formed at 6631, and price rotated between 6700 and 6807. In isolation, that range might suggest accumulation. In context, it suggested hesitation. The market was no longer trending higher, but it was not yet resolving lower. It was pausing.
That pause resolved the following week.
From March 18th through March 23rd, ES declined approximately 400 points.
The move was not continuous, but it was directional.
Bounces occurred, but they lacked duration. Only one produced meaningful extension. The rest were abosrbed. This asymmetry….where downside moves are decisive and upside moves are corrective… It’s a characteristic of a market undergoing major repricing.
The reaction to headlines reinforces this interpretation. When news of “great” talks surfaced, price responded. But the response did not hold. It was faded quickly, and more than half of the move was given back. In stronger environments, positive news extends price. In weaker ones, it provides liquidity.
The latter appears to be the case here.
See What I Mean Here:
The 89/8 EMA crossed and and each time it was tested (5 so far), it has been rejected.

Not once has the market demonstrated the ability to reclaim and hold above it. This is not a matter of coincidence. It is a reflection of persistent supply at that level.
RSI provides an additional layer of confirmation.
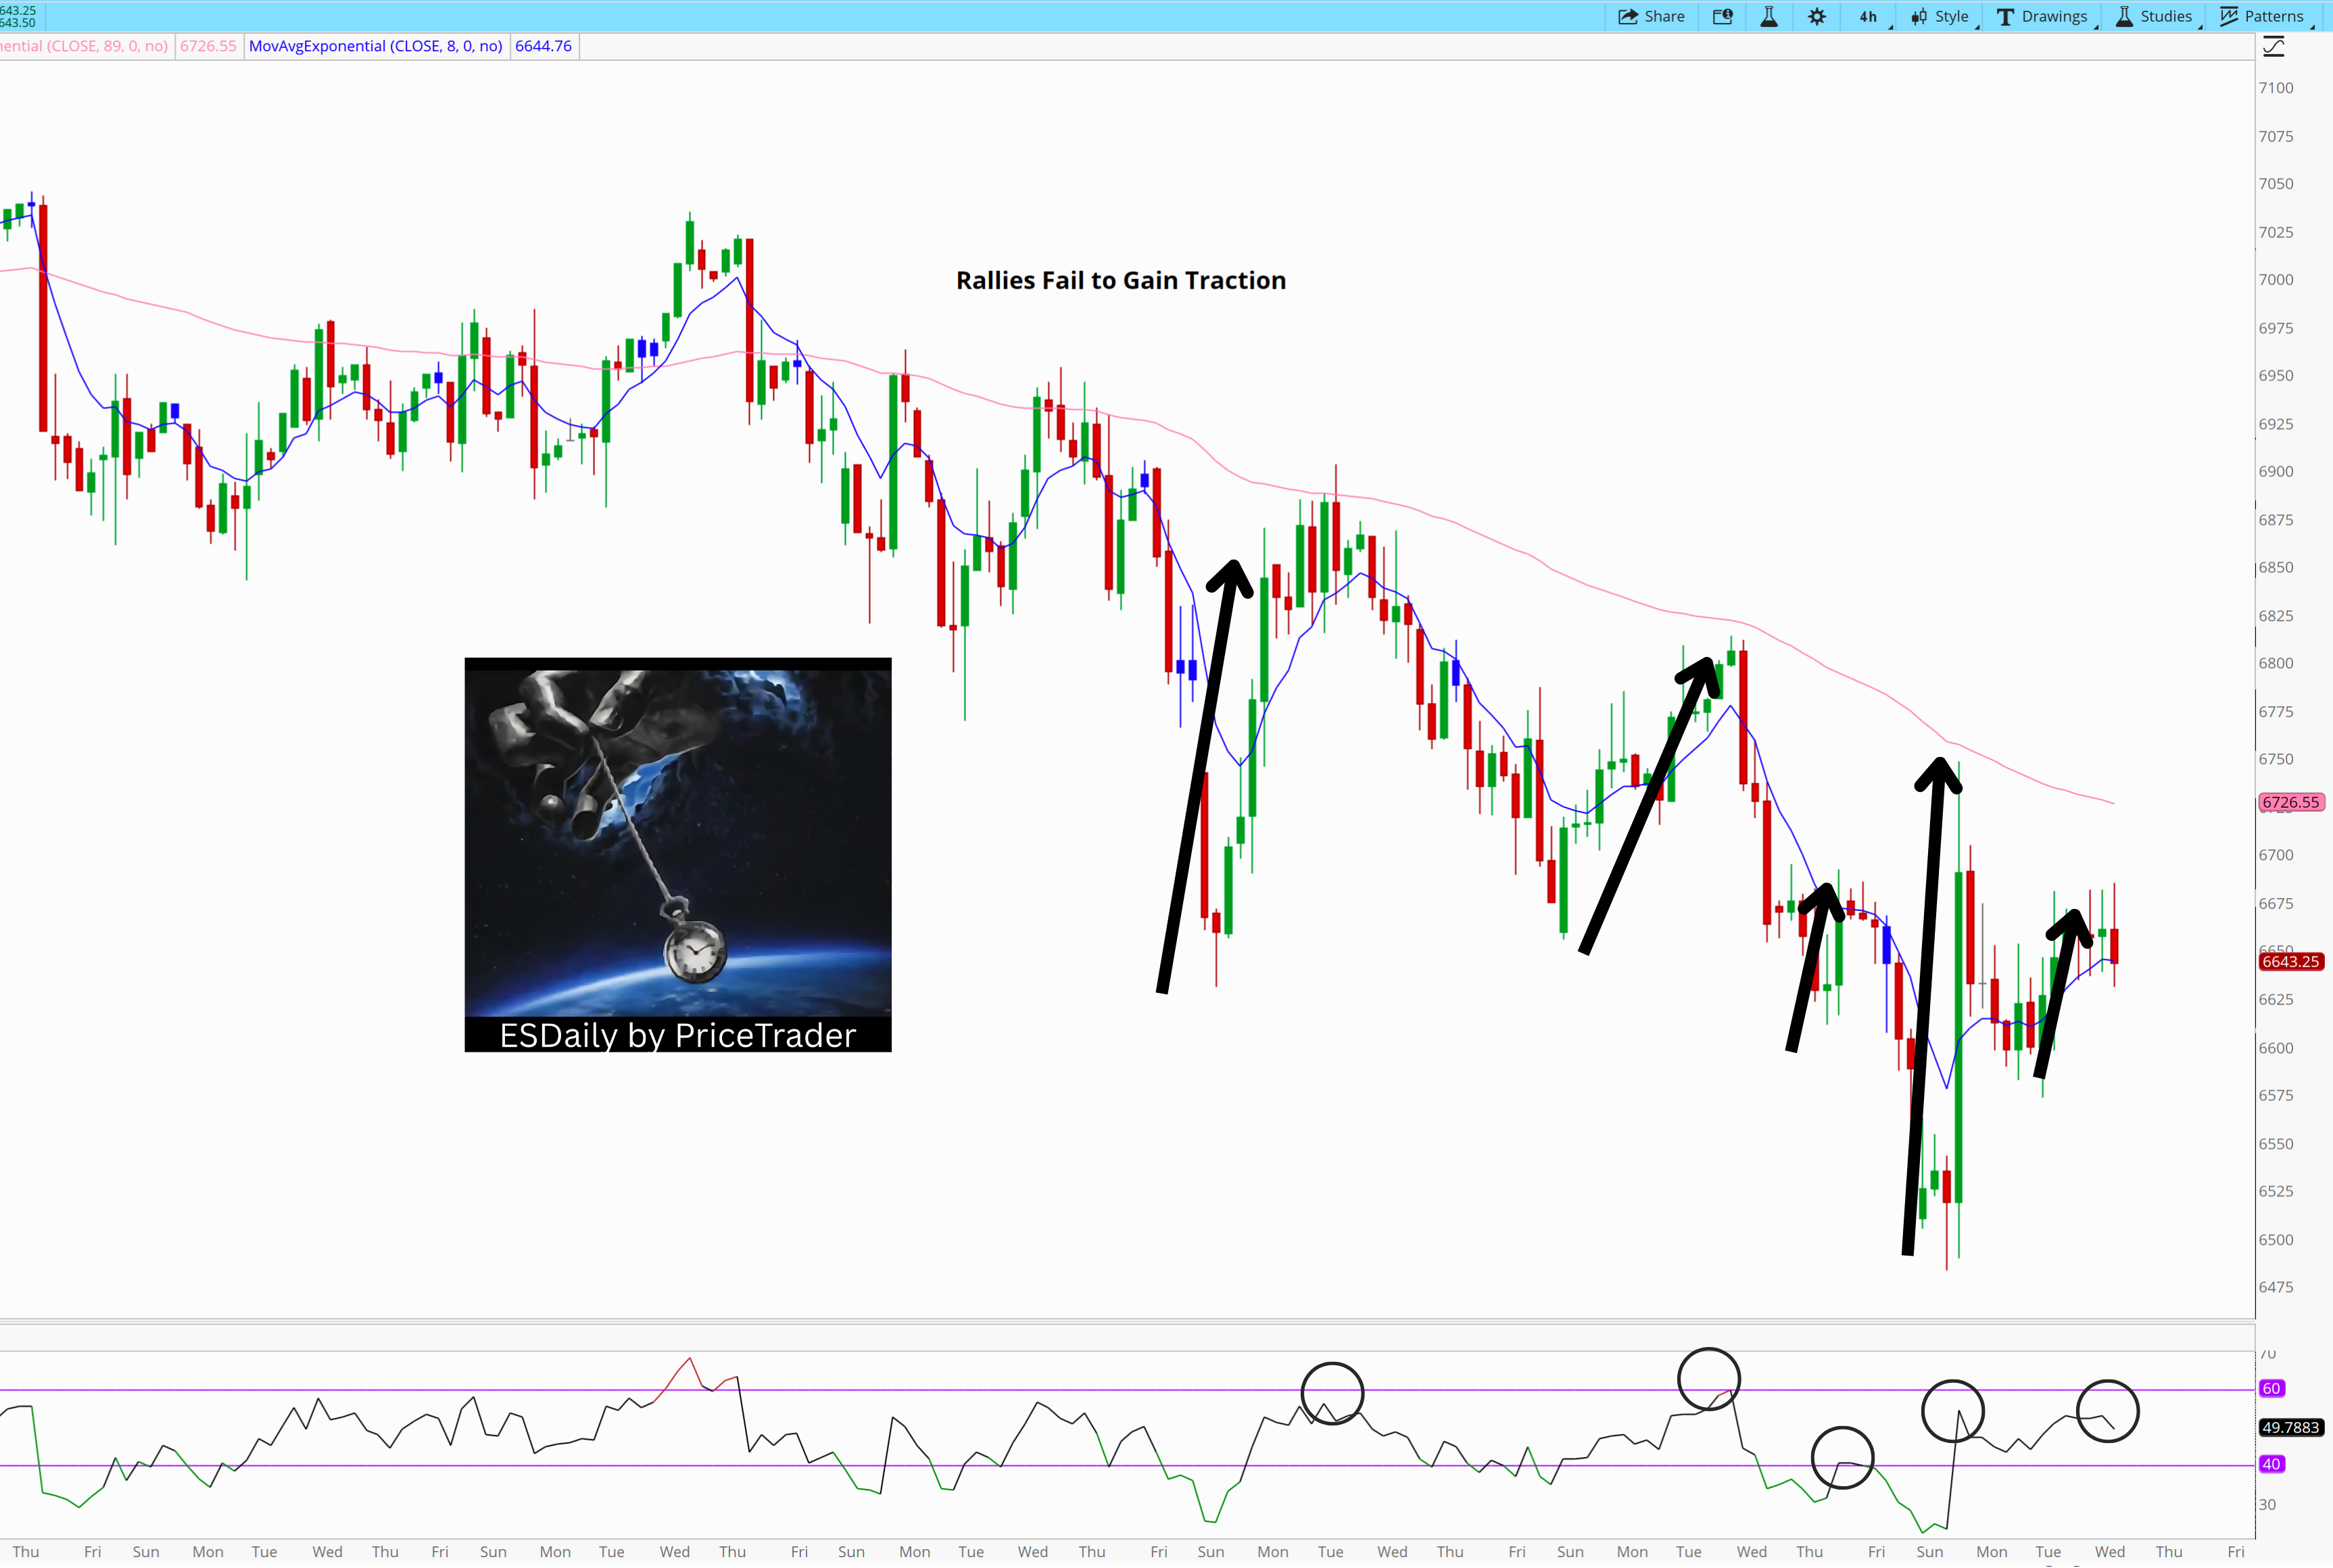
RSI confirms the shift. On the 4-hour timeframe, RSI is no longer operating in a bullish range. It struggles to hold above 60 and repeatedly compresses back toward 40. Even the sharp move from 6483 to 6680 failed to sustain elevated readings. Momentum appears, but it does not persist. That is not strength. That is reaction.
Structure, momentum, and behavior….
The conclusion is difficult to ignore.
To understand why, it becomes necessary to step back.
Over the past several months, the dominant driver of markets has shifted from one centered on liquidity and growth toward one increasingly constrained by energy and geopolitics.
The most significant of these is oil.
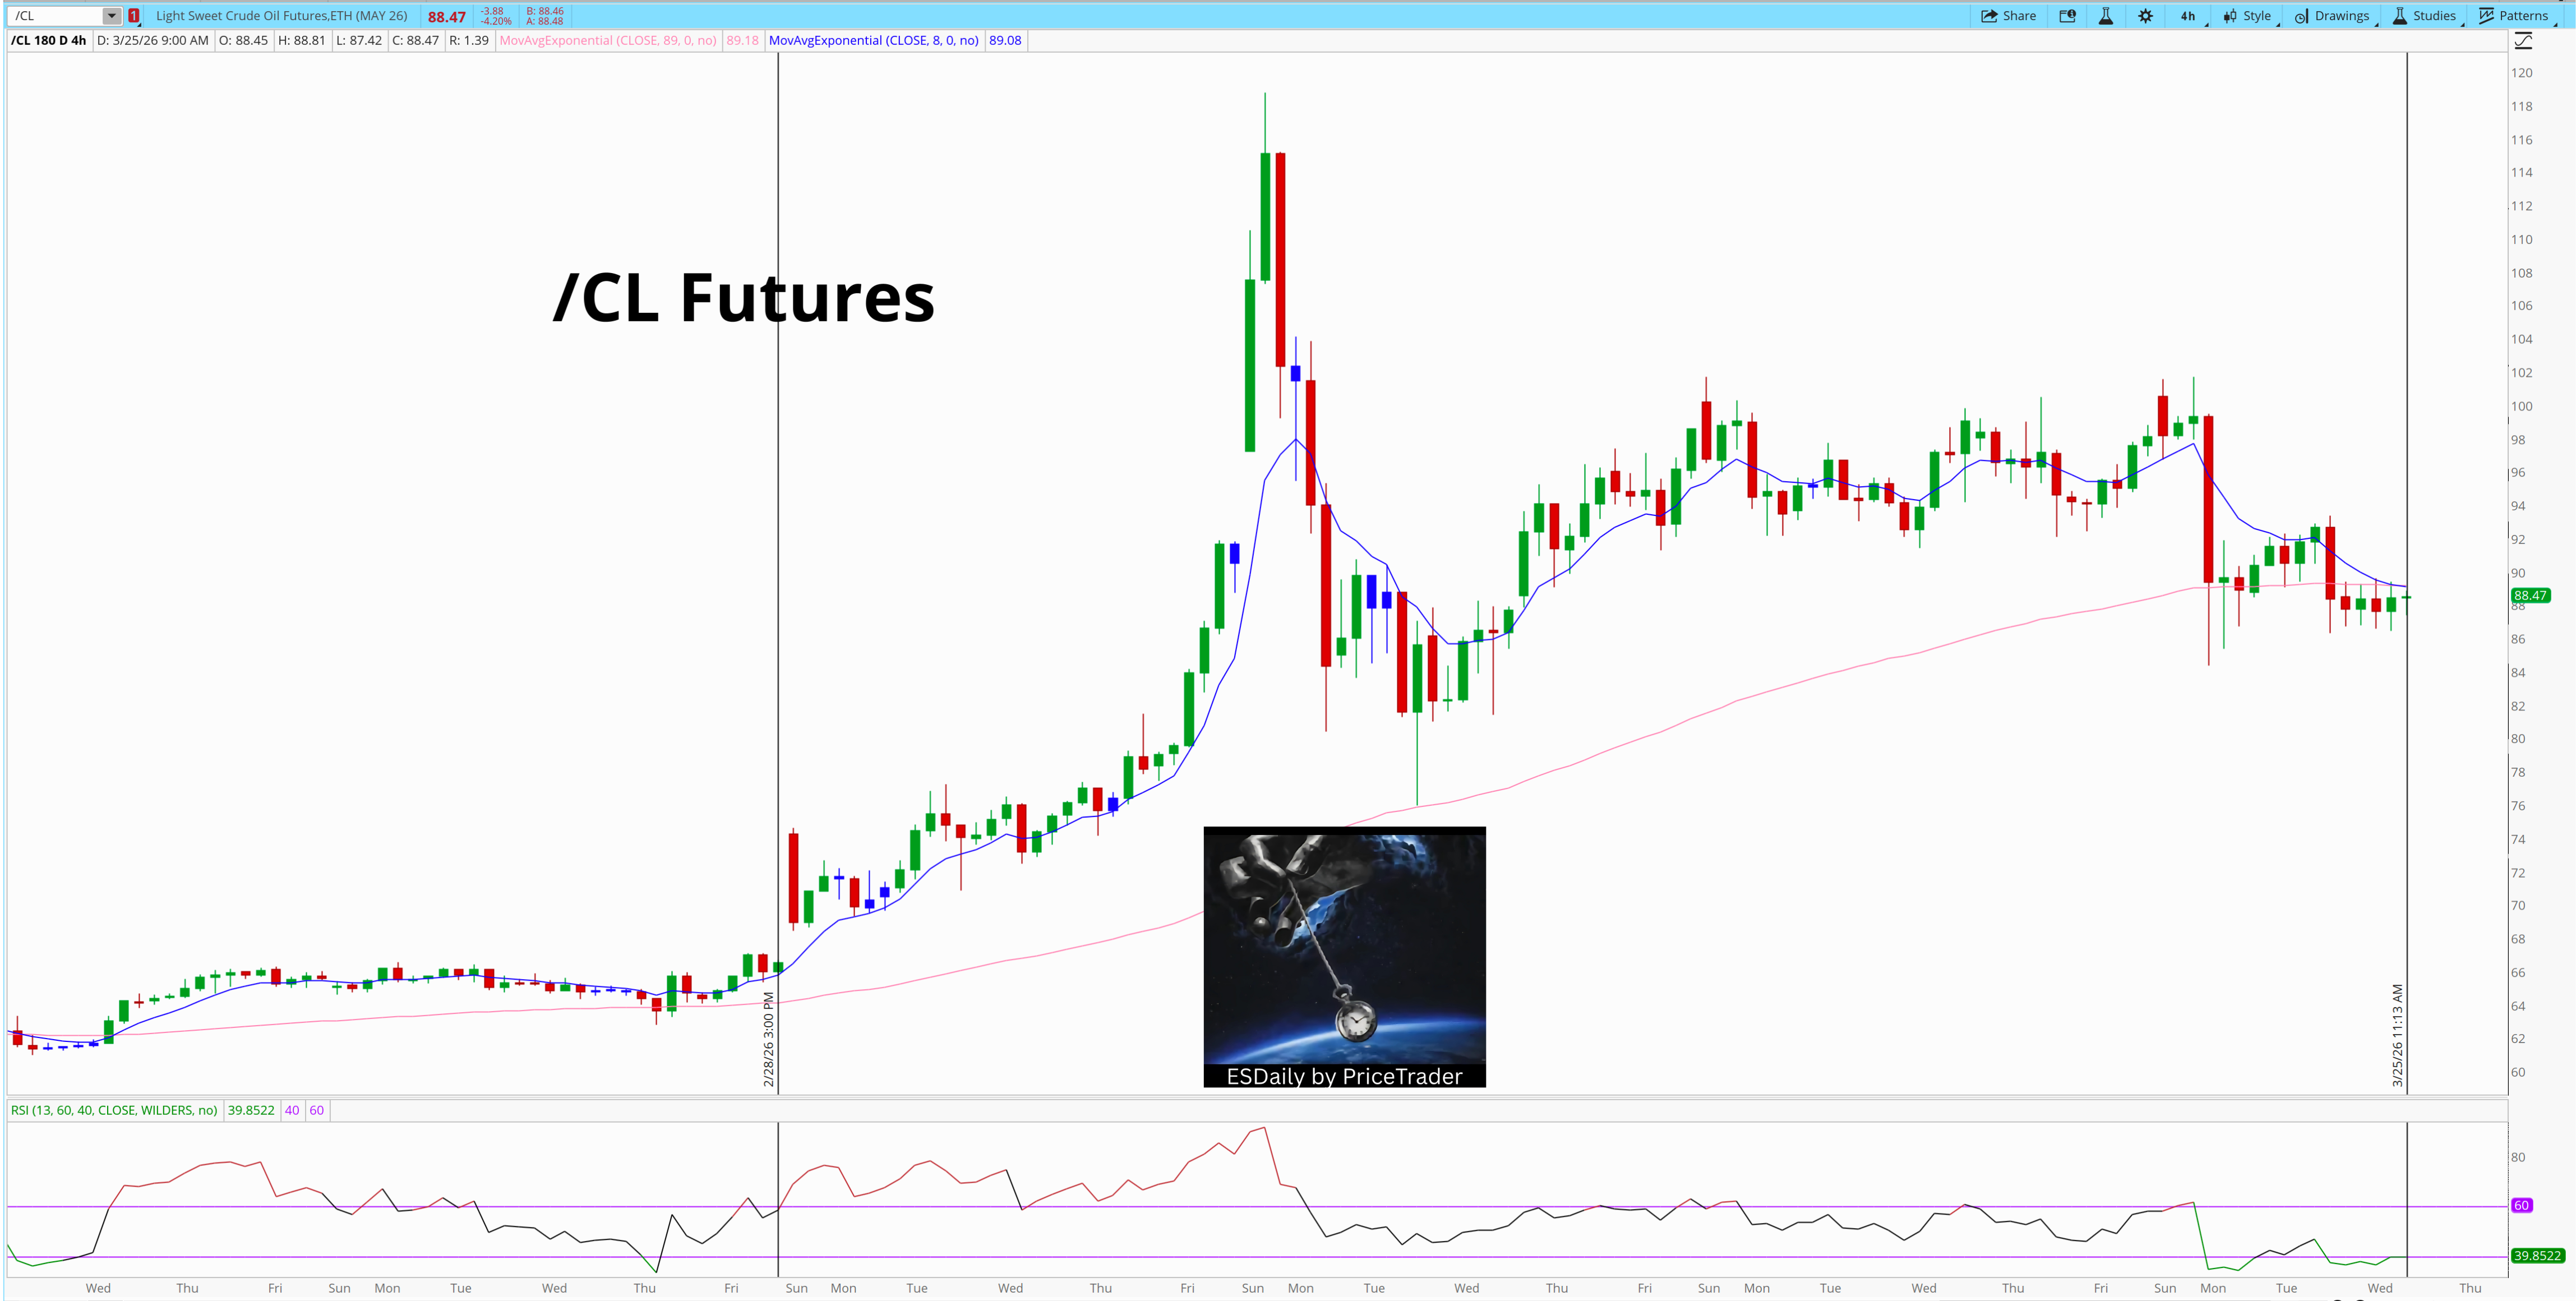
The escalation between the United States and Iran has introduced risk into one of the most critical points in the global energy system, the Strait of Hormuz, through which roughly 20% of global oil supply flows. The response in crude markets has been immediate and sustained. Both WTI and Brent have repriced higher, and more importantly, have remained elevated.
Here’s WTI Crude
Here’s Brent Crude
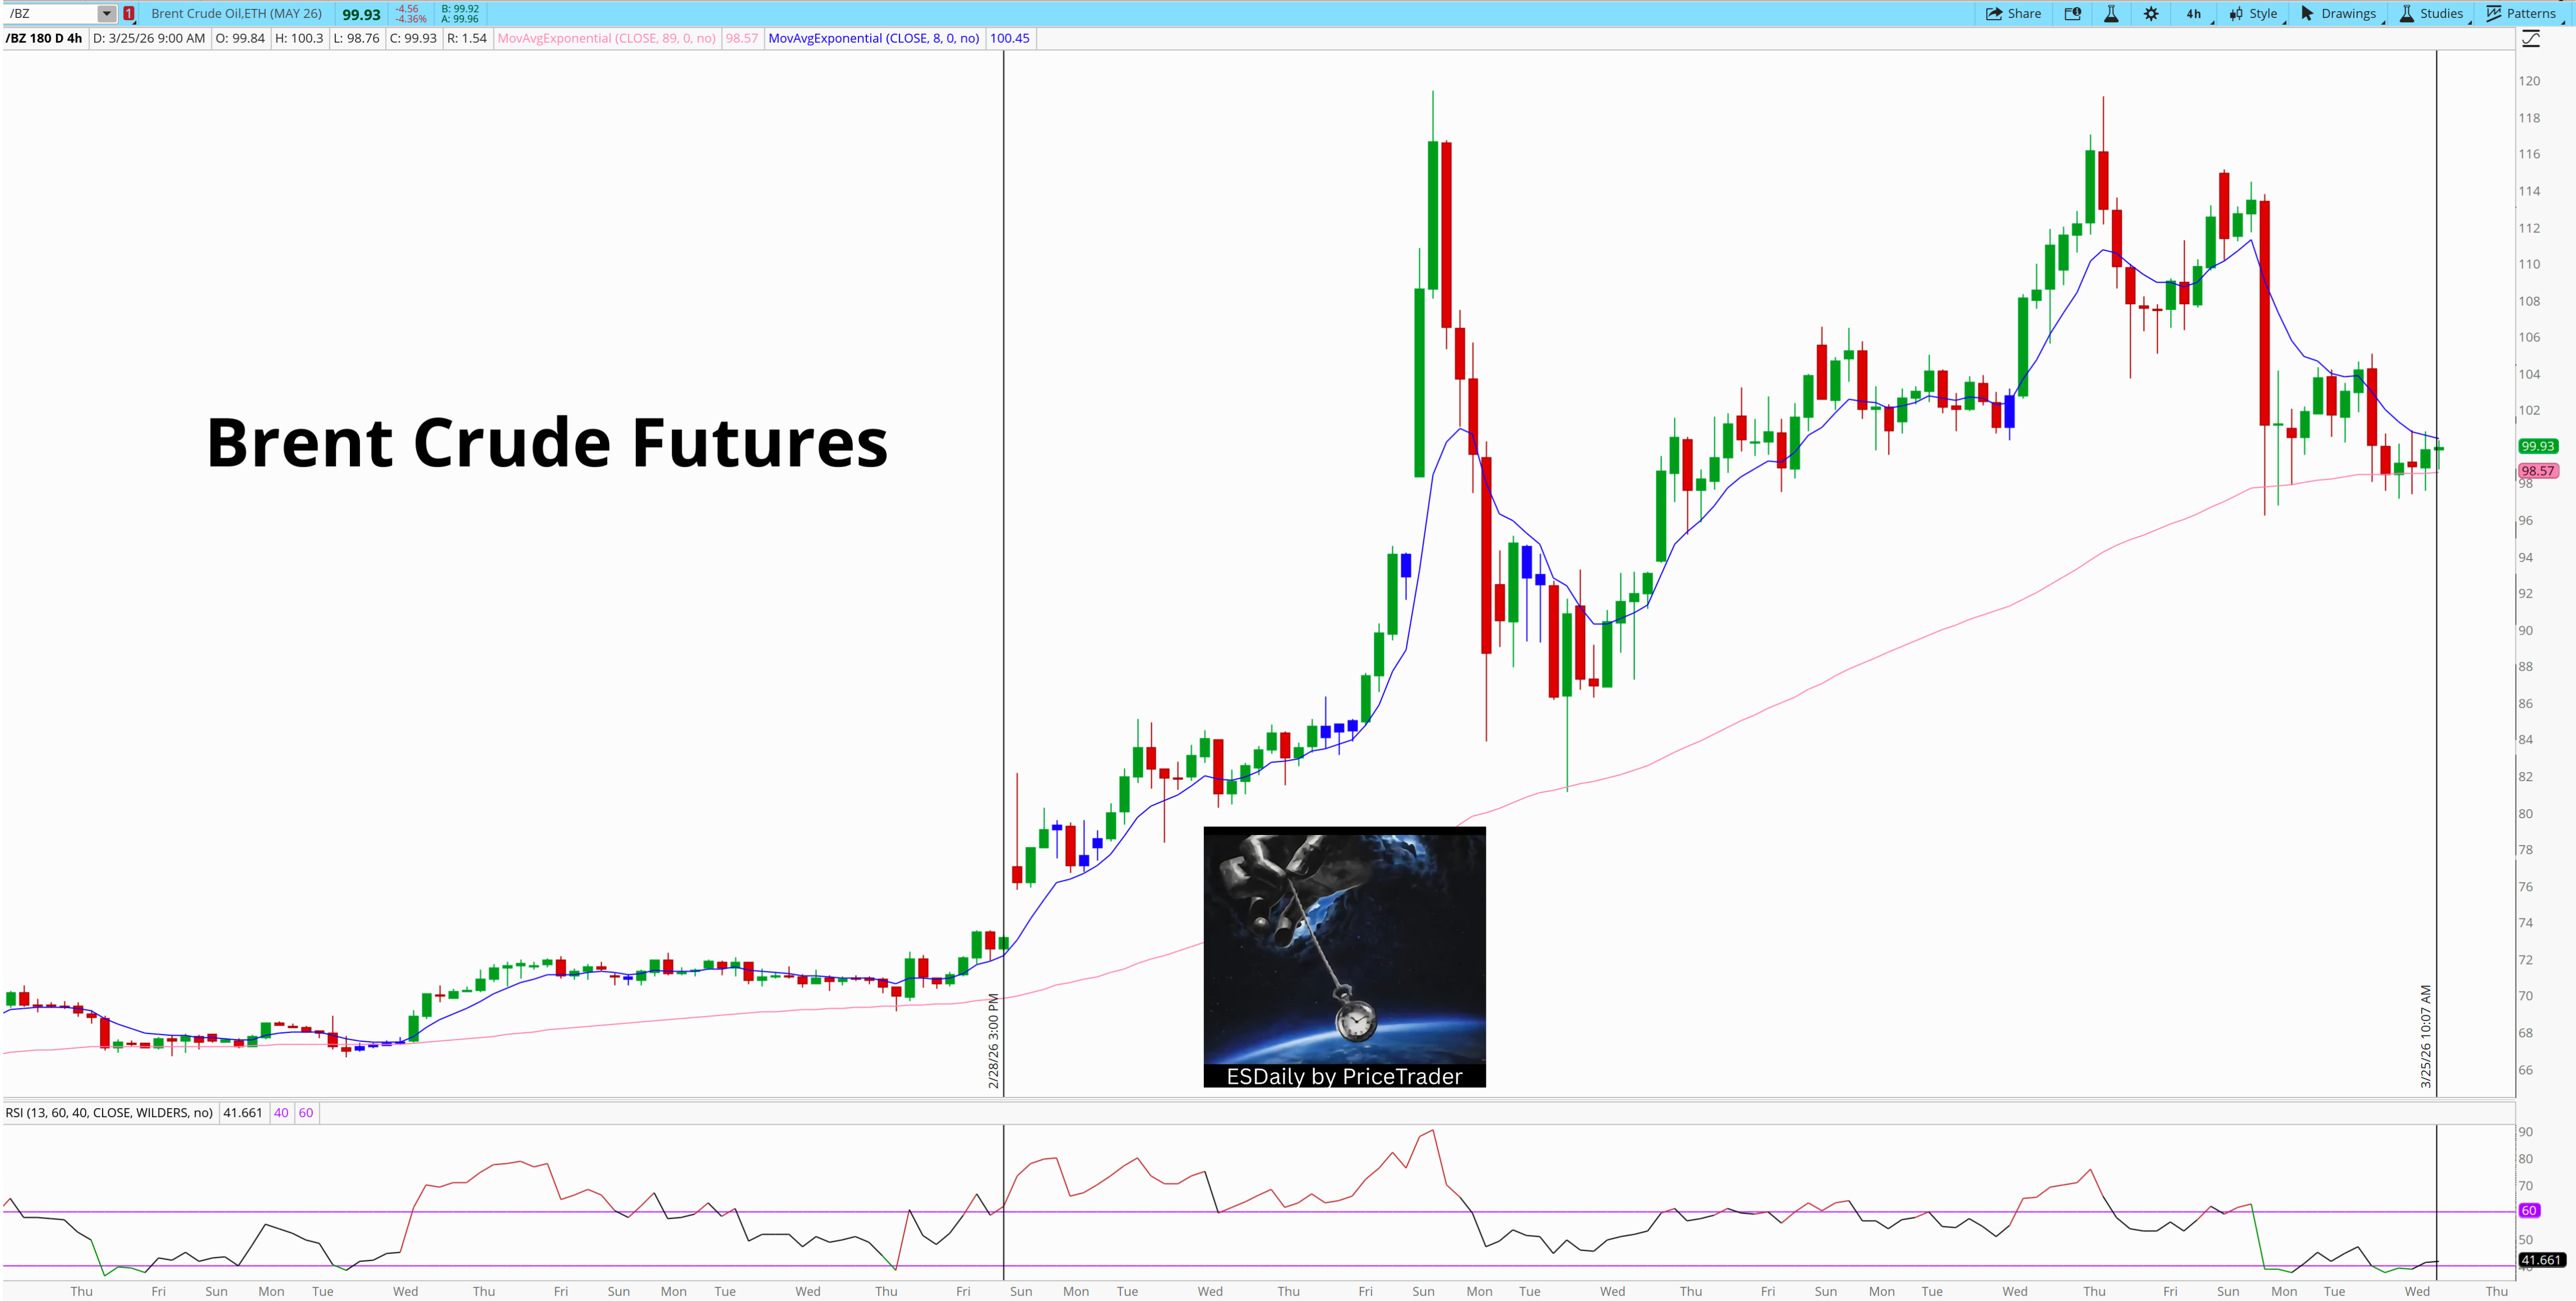
Importantly, prices have remained elevated.
That persistence matters. Elevated oil is not simply a commodity move. It is a constraint on the system. It increases costs, pressures inflation expectations, and reduces flexibility for policy. At the same time, the U.S. dollar has strengthened. This is not incidental. As the world’s largest energy producer and exporter, the United States is less sensitive to external supply shocks.
The U.S. dollar (/DX) has strengthened.
This is a critical piece of the puzzle.
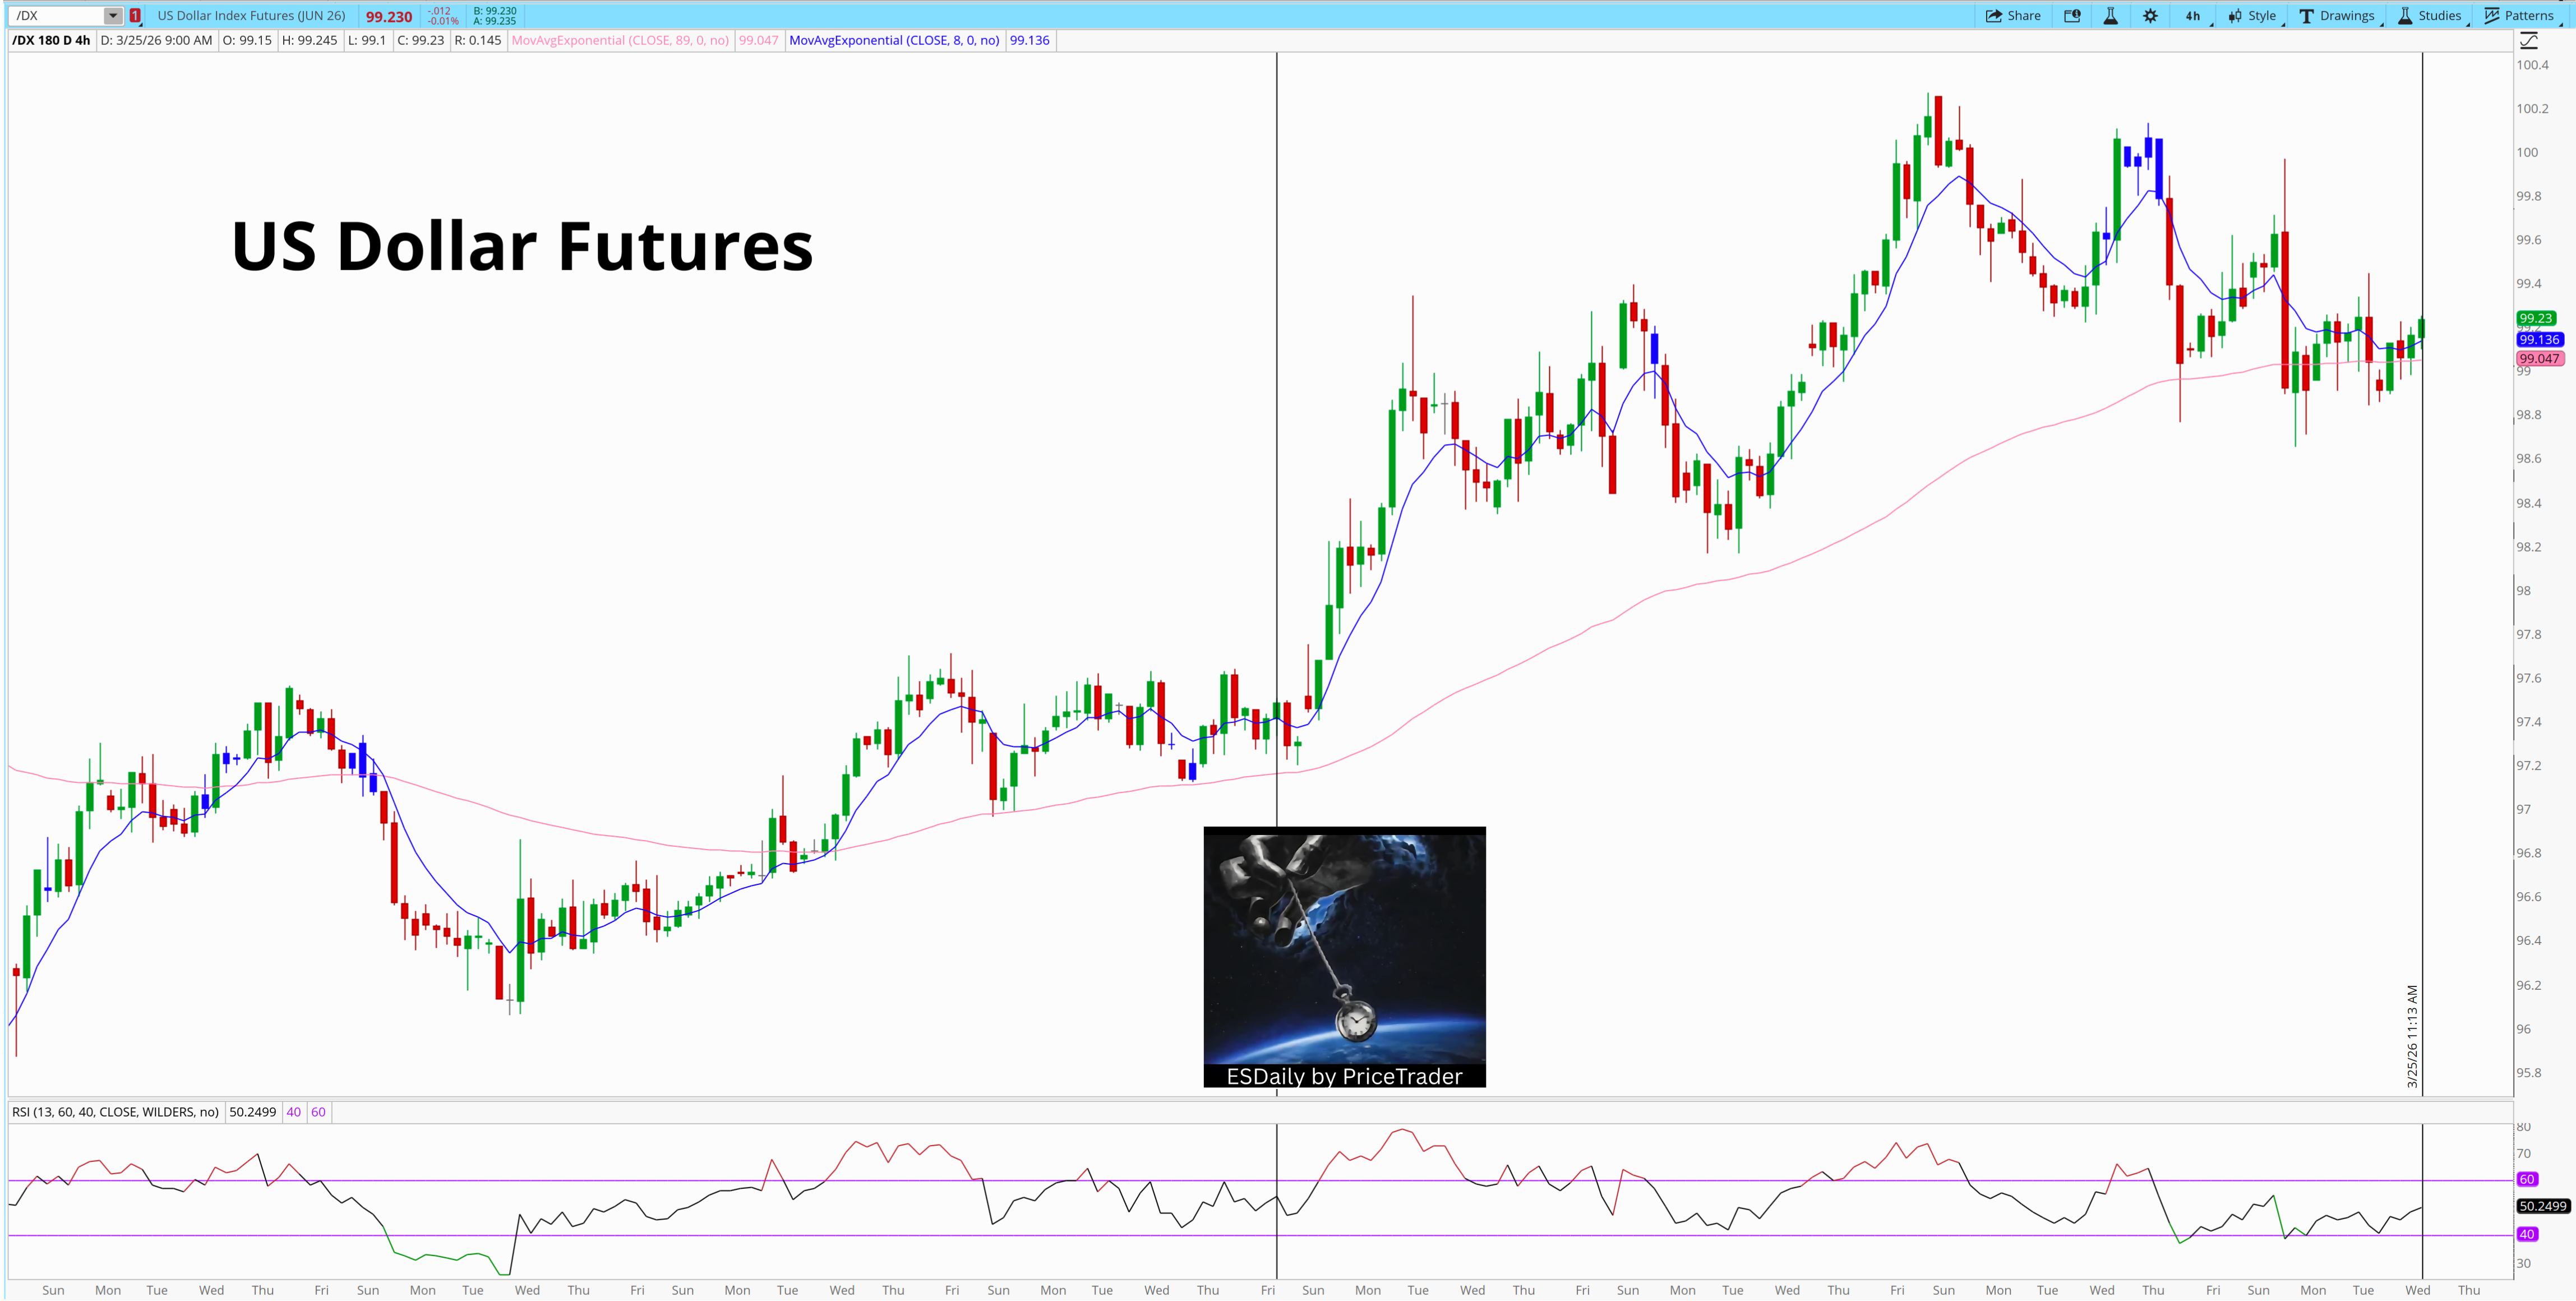
The United States (as a major exporter) is less sensitive to external supply shocks than many of its global counterparts.
Because oil is denominated in dollars, higher oil prices increase global demand for USD.
The result is a strengthening dollar in conjunction with rising oil… this combination is a recipe that tightens global financial conditions.
This tightening is not limited to currency markets.
It manifests across asset classes.
Higher oil contributes to elevated inflation expectations, which in turn complicates the Federal Reserve’s ability to ease policy.
A stronger dollar increases the cost of capital globally.
What’s Going To Happen With the War?
🤷♂️ Who knows?
I certainly do not.
But I do know this:
Iran is a “do or die society”…
U.S. is a “do until the vote count gets hit” society.
Iran will defend itself to the death of every last soldier. It will fight with $200 oil and force financial pressure anywhere it can.
I noted in my buddy Le Shrub’s chat:
“Do we think Oil from $70 to $120 back to $90 is the reality of the conflict in Iran? Is Iran really going to wave a white flag in the face of “annihilation.”
I doubt it.
The U.S. not rely on oil coming out of the Straight of Hormuz:
But China does.
Pakistan does.
India does.
Japan does. Many European countries are impacted by this.
Several billion end users are impacted by less oil leaving the Straight.
The strain on these countries will be pushed across every single asset class.
So while $120 was perhaps an early headfake, a sustained problem with 20% of the world’s oil will result in sustained higher prices.
Together, these forces reduce the capacity for growth to expand.
The move in ES from approximately 7100 to the mid-6600s can be understood as a repricing of these conditions.
In such environments, price behavior tends to follow a recognizable pattern.
This is precisely what we observe across the current structure.
At present, price is trading at 6661, positioned directly beneath the 6676–6690 region. This area represents the underside of the prior breakdown and has consistently acted as resistance. Below, at 6611, lies the origin of the most recent upward impulse. These two levels define the immediate structure of the market
Daily
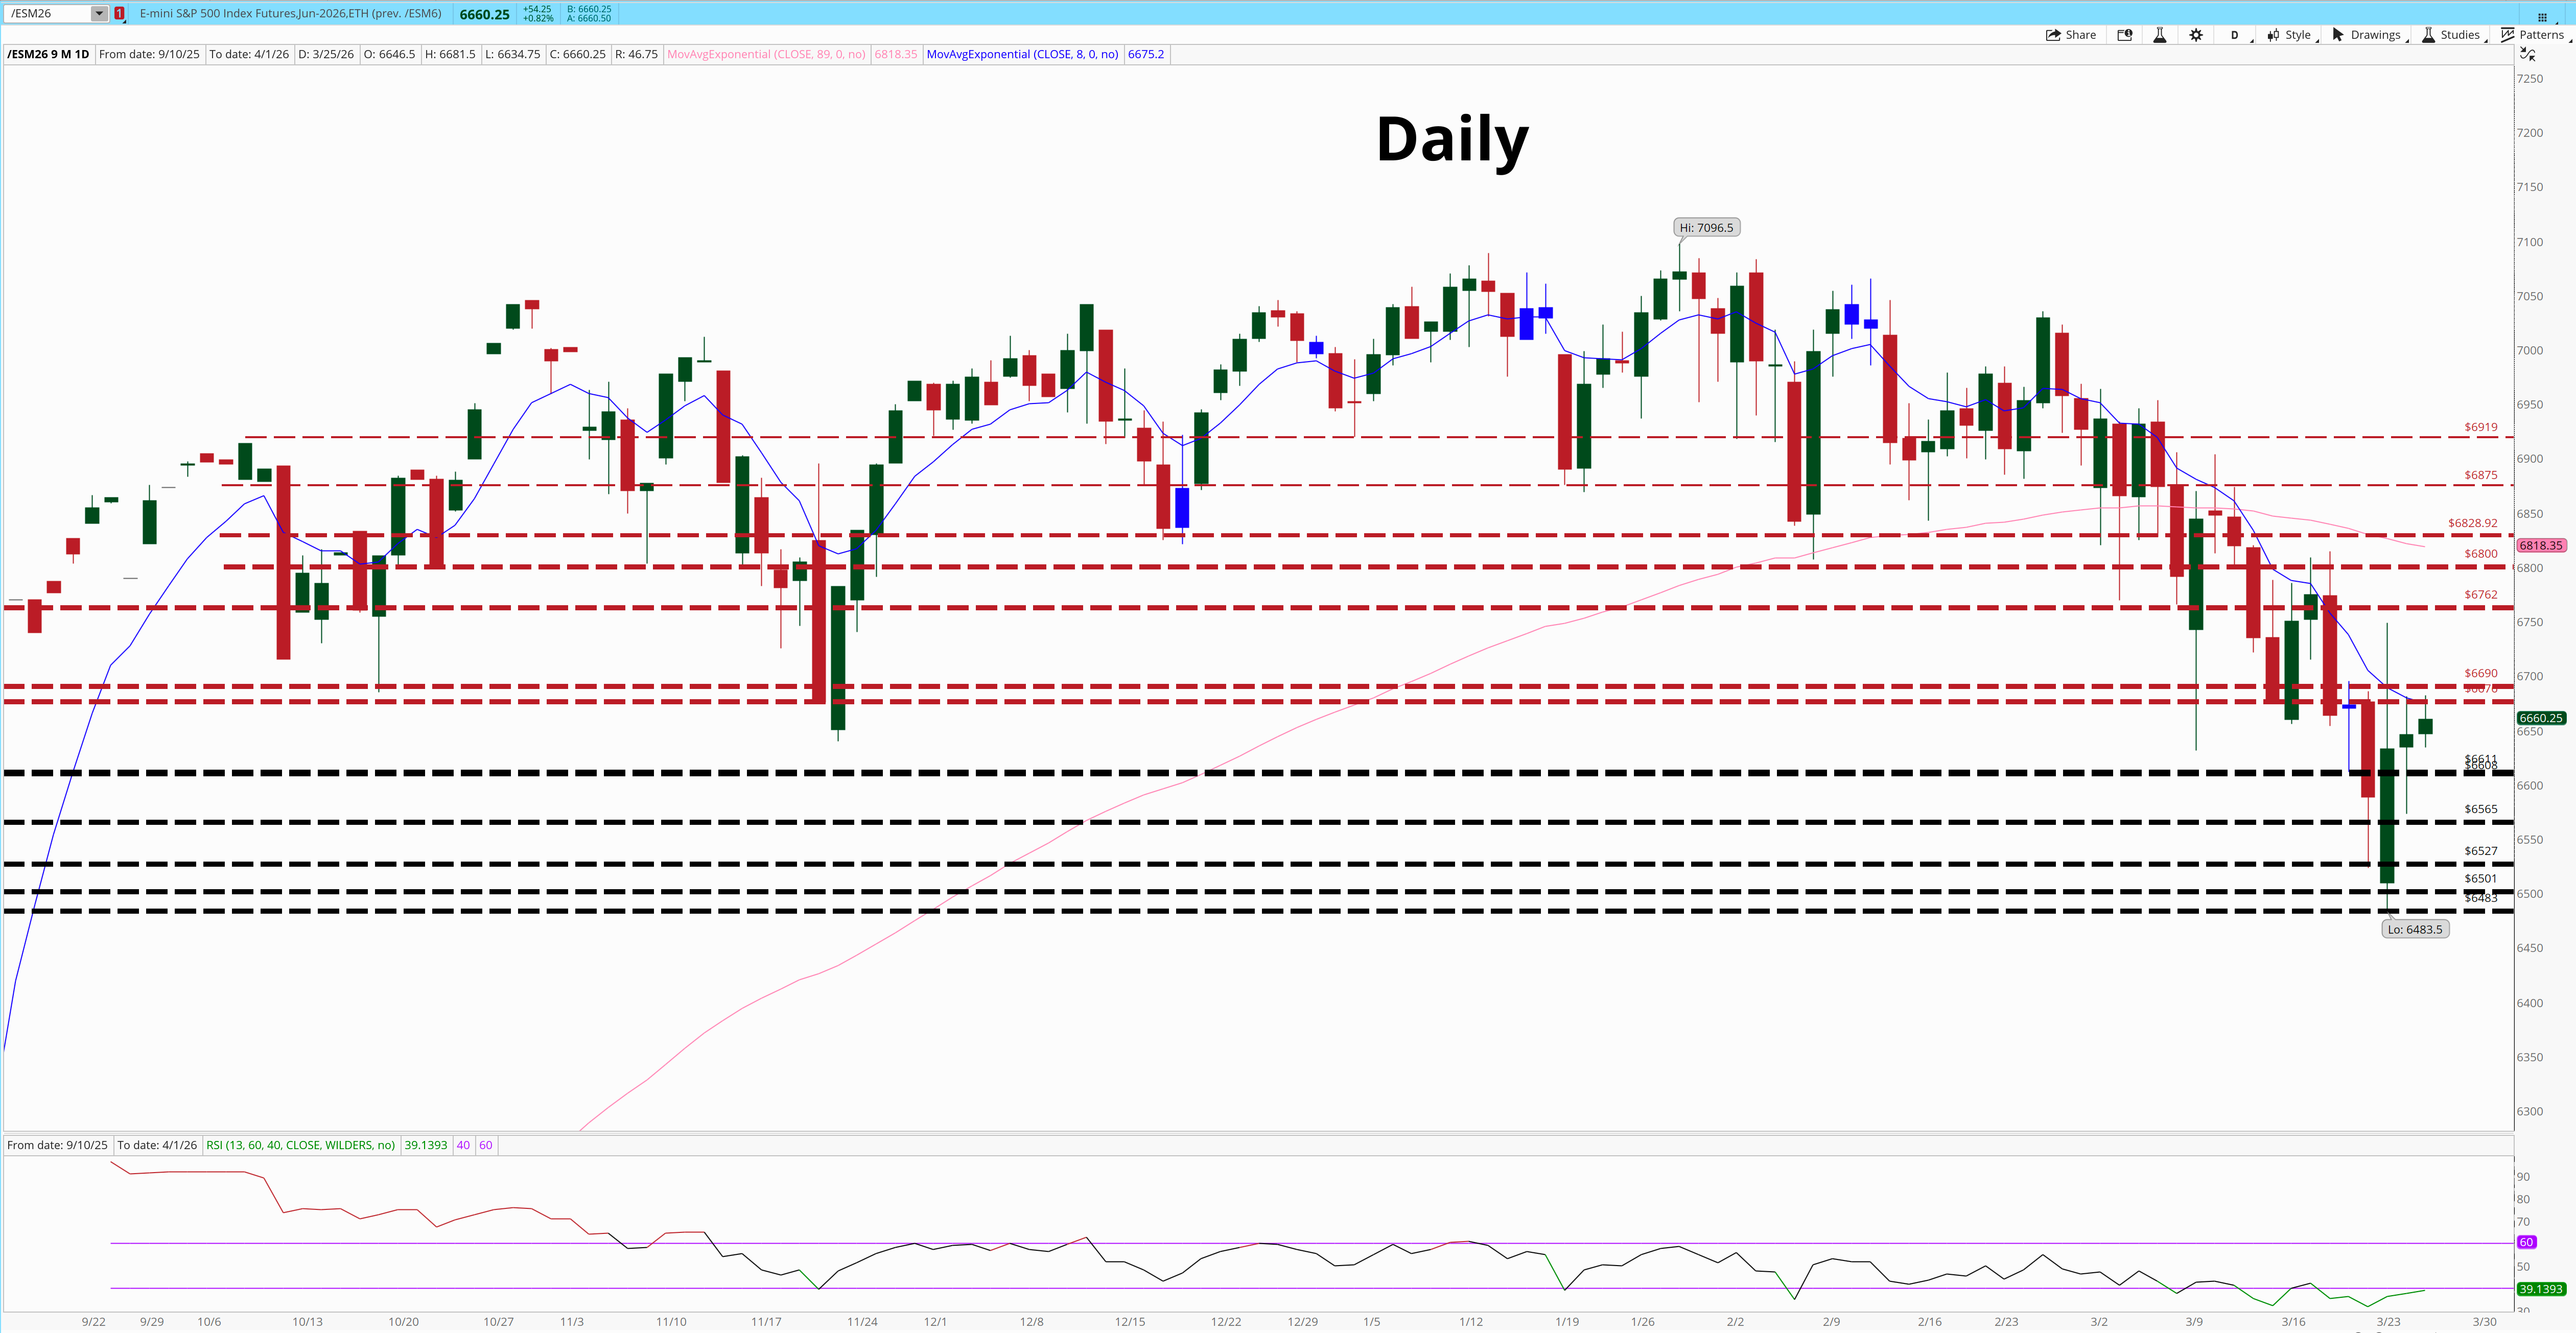
The Daily chart is no longer ambiguous.
What had previously been a series of higher highs supported by orderly pullbacks has transitioned into a structure defined by failure. Not violent failure, but persistent inability to reclaim prior areas of strength. The highs near 7096 now sit as a clear reference point. Everything since has failed to challenge them in any meaningful way.
The sequence that followed that top has been telling. Each attempt to stabilize has occurred at progressively lower levels, and more importantly, each rally has lacked both duration and participation (as noted above).
The recent move into the mid-6600s is not an isolated decline, but part of a broader progression of lower highs and lower lows. What stands out is not just price, but the character; expansion lower, hesitation higher.
RSI reinforces this shift.
On the Daily, RSI has broken out of its prior bullish range and is now consistently operating below the midpoint. Attempts to reclaim strength have been short-lived, with momentum failing before reaching prior highs. This is consistent with a transition from an expansion regime to one of compression and rebalancing.
In stronger environments, RSI holds elevated levels and uses pullbacks as resets.
Here, it struggles to sustain strength, suggesting that rallies are being sold rather than accumulated.
It suggests that the path of least resistance has shifted.
4 Hr
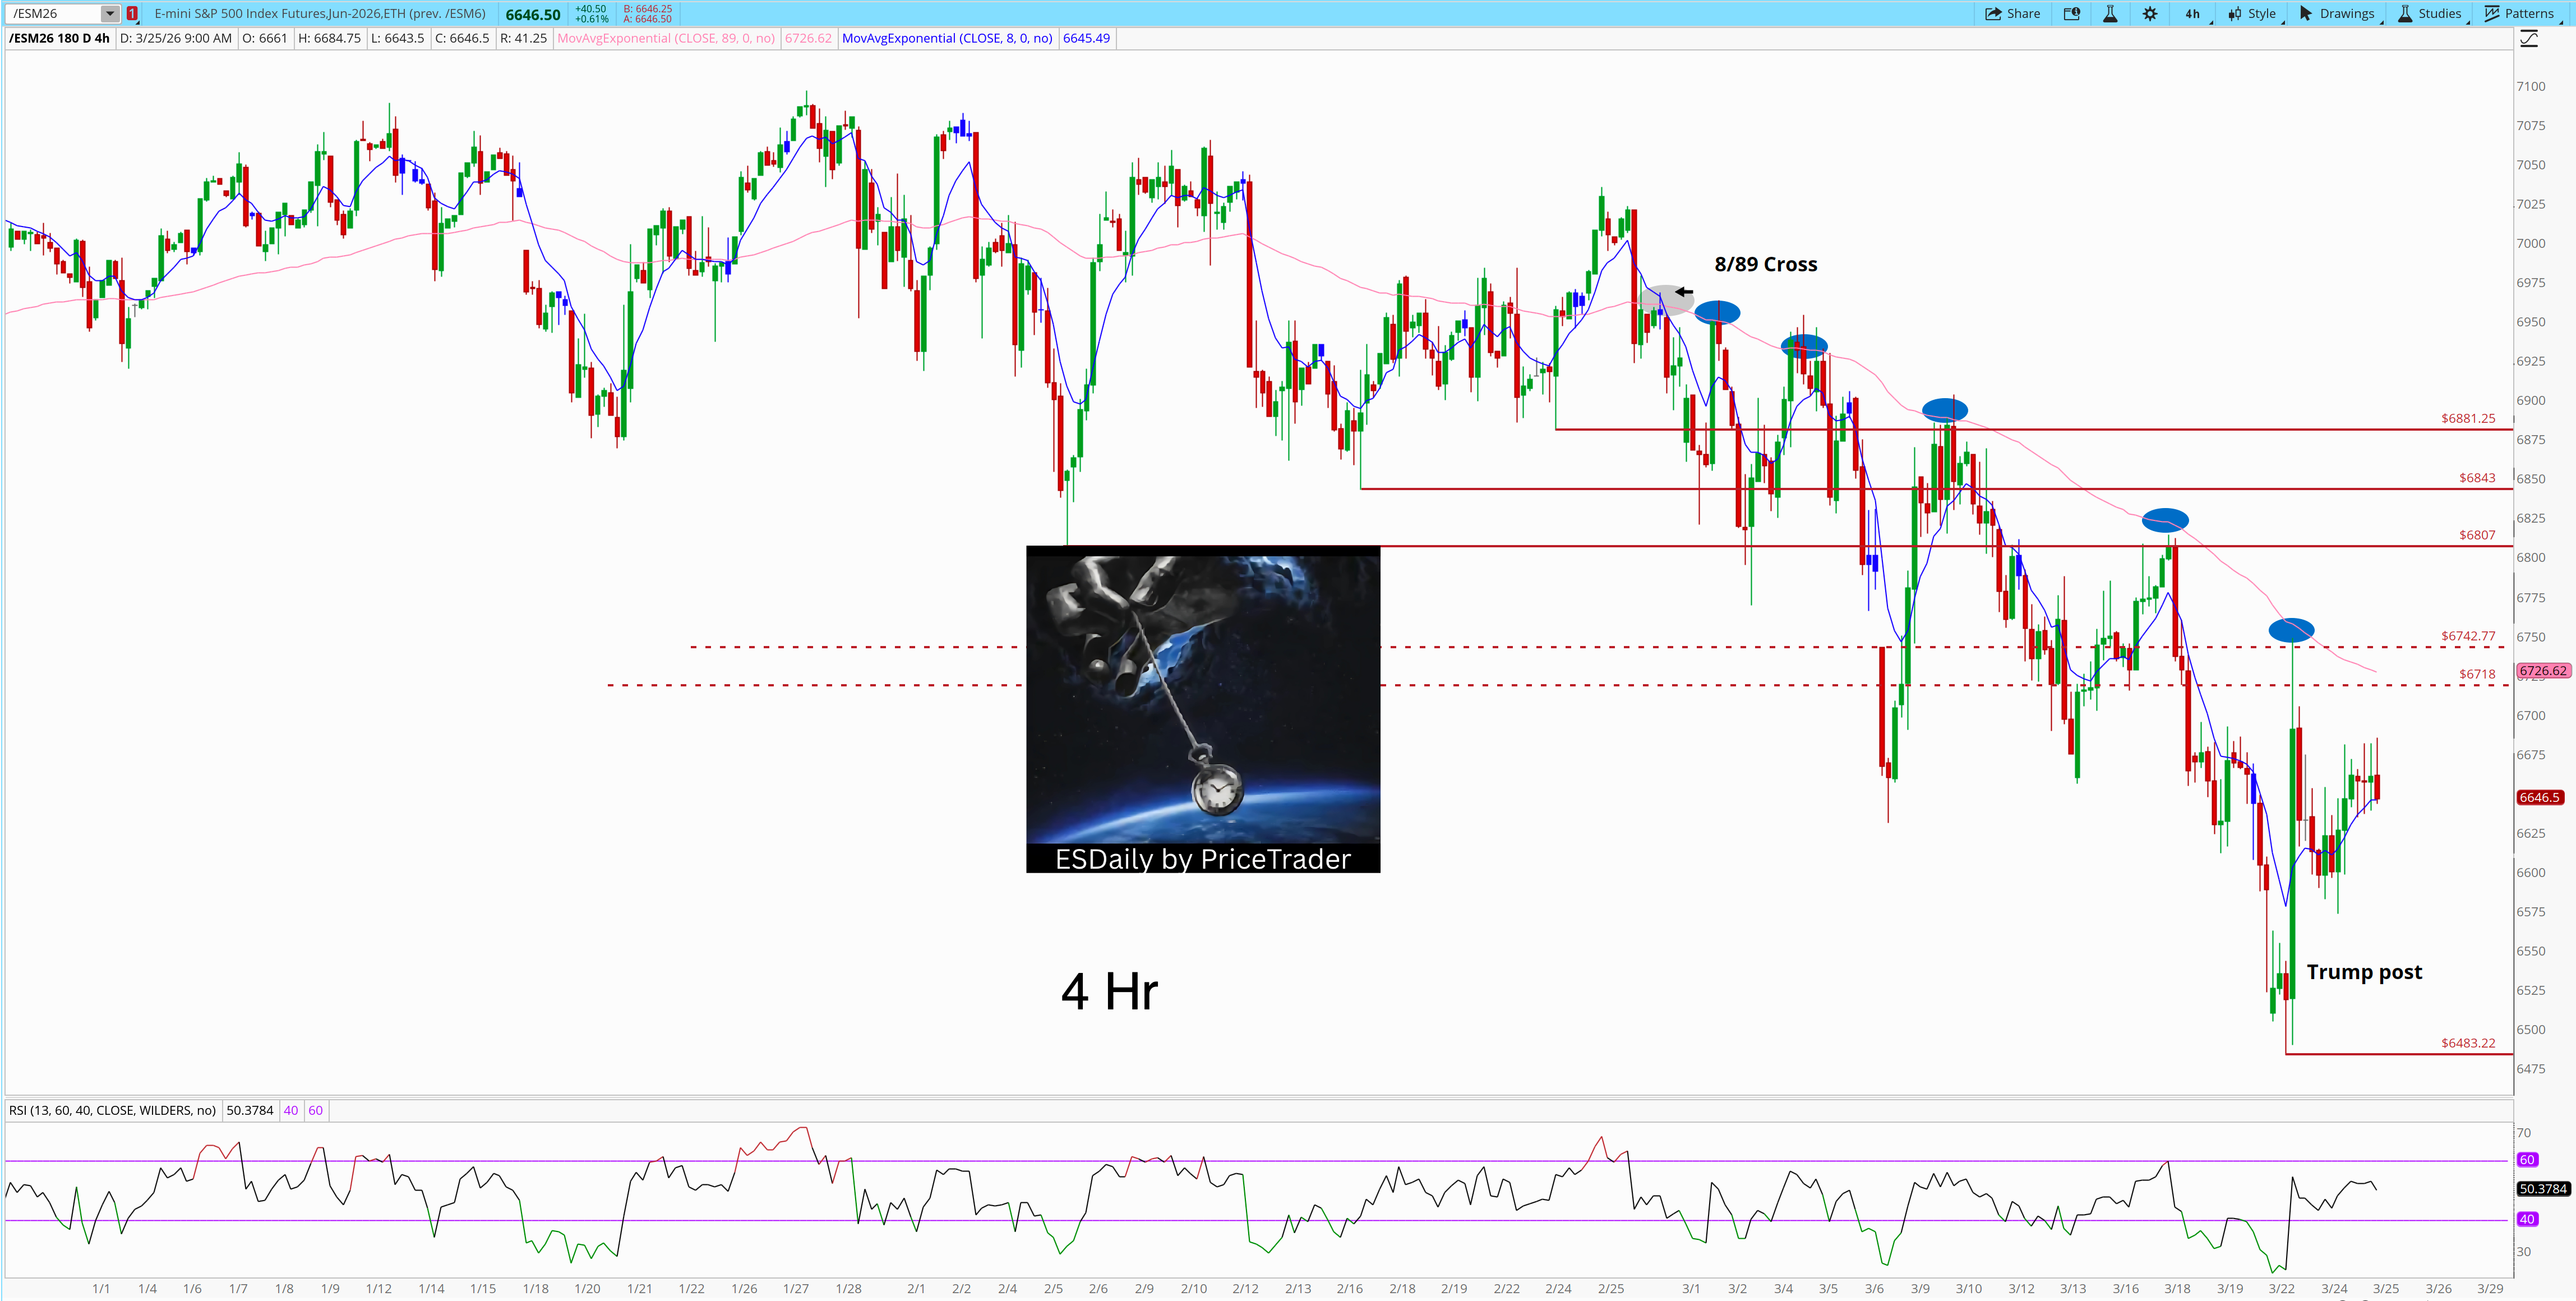
The most important development here is the repeated rejection at the 89 EMA.
Five separate attempts to reclaim that level have failed, each one producing a lower high and leading to a continuation lower. This is not random behavior. It is a clear indication that supply is consistently stepping in at a defined location.
The 8/89 cross marked the structural shift, but what followed confirmed it. Price did not simply move below the averages, it stayed below them.
Every rally since has been corrective in nature, overlapping and lacking momentum.
At the same time, downside moves have been more decisive.
RSI on the 4-hour has established a bearish range. It struggles to sustain above 60 and repeatedly finds support near 40 before breaking lower. It is consistent with short-covering or reactive buying, not sustained demand.
What is particularly notable is the consistency of this pattern.
45 Min
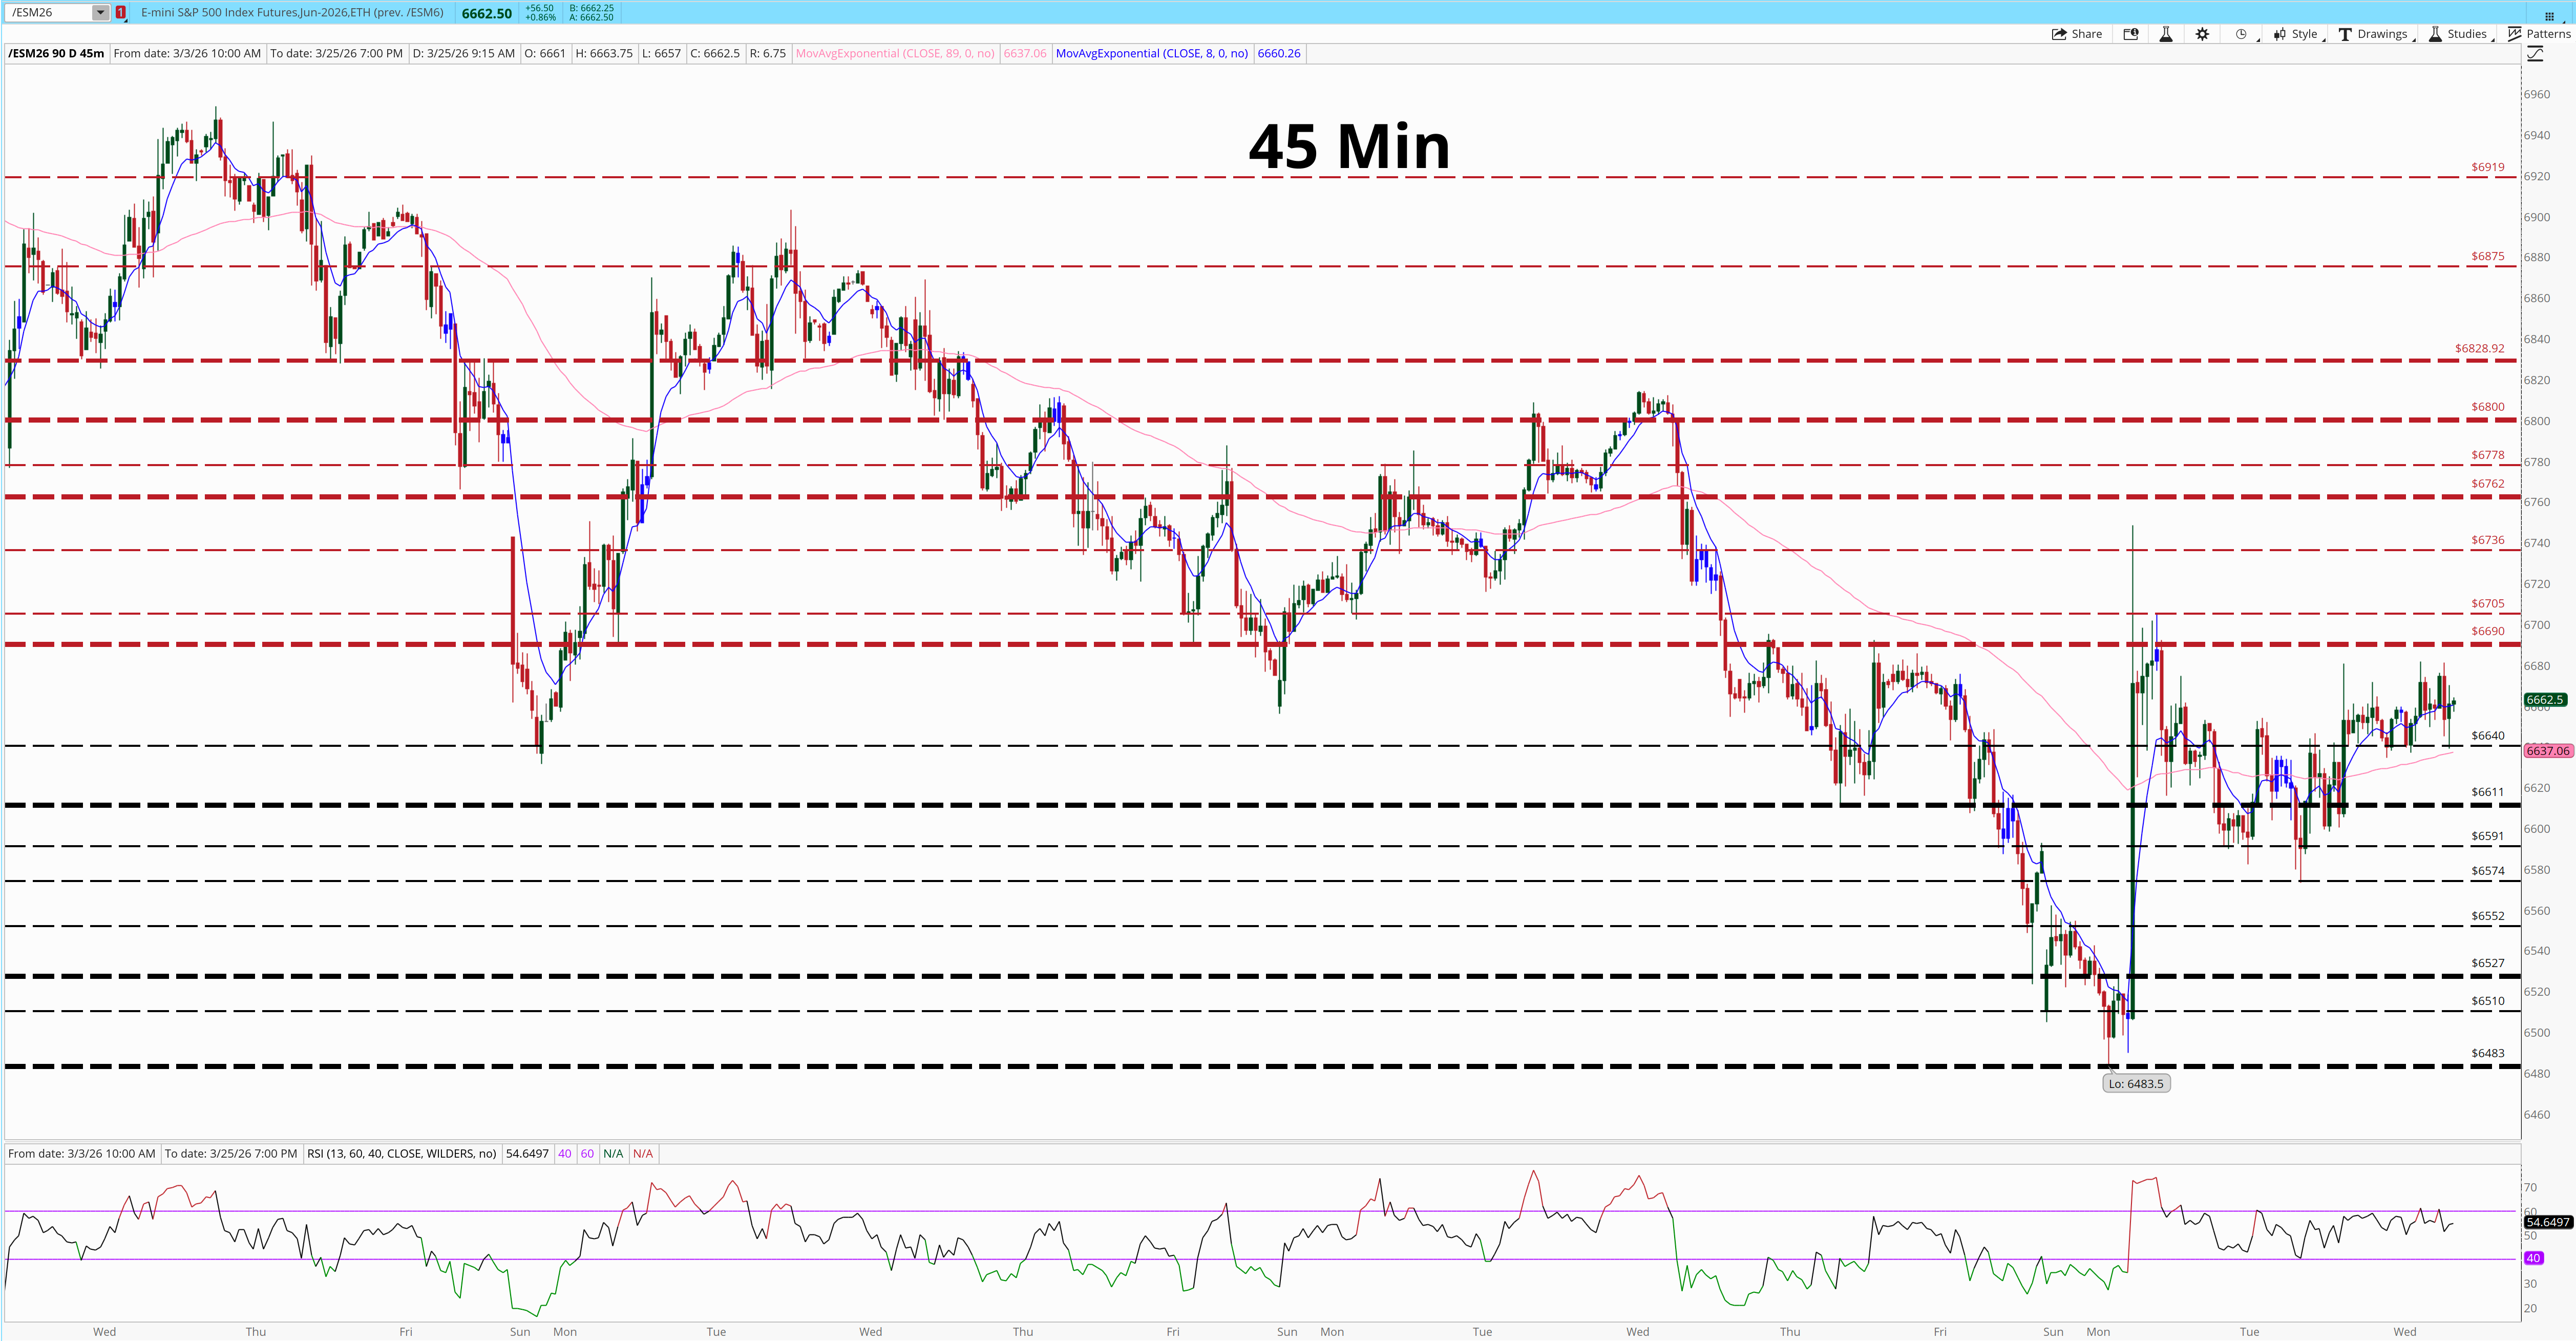
This timeframe shows the transition from impulsive movement to corrective rotation with unusual clarity. The move from 6483 to 6680 was sharp, vertical, and largely one-sided. It was the kind of move that typically signals either a shift in positioning or a temporary imbalance.
However, what followed did not confirm continuation.
Instead, price began to rotate.
That rotation has been defined by overlapping candles, failed pushes higher, and repeated rejections at incremental levels. The market is moving, but it is not progressing. Again, each attempt to extend is met with supply before meaningful expansion can occur.
RSI here continues to reflects this loss of momentum. Rather than sustaining higher readings during rallies, it oscillates around the midpoint, failing to establish a clear directional bias. This type of RSI behavior is typical of range-bound or corrective environments.
The 45-minute also highlights the importance of location.
Price is currently sitting just beneath a cluster of resistance levels, with each minor push higher encountering friction. The lack of follow-through at these levels suggests that buyers are not yet willing to commit aggressively.
What This Environment Does to Price
If the inputs have changed, then the behavior must change with it.
That is the part most people miss.
They recognize something feels different… but they continue to trade as if nothing has changed. They continue to expect continuation where the environment no longer supports it. They continue to treat reactions as signals of strength, rather than what they are…..temporary imbalances inside a system that is tightening.
When oil rises and remains elevated, and when the dollar strengthens alongside it, the system becomes less forgiving. Period.
Liquidity does not disappear, but it becomes selective.
Participation does not vanish, but it becomes conditional.
And price, rather than expanding cleanly, begins to fragment.
That fragmentation shows up in very specific ways.
Downside moves accelerate. They move quickly because repricing happens faster than accumulation. When the market needs to adjust to new information like higher energy costs and tighter financial conditions, it does so abruptly.
That is why the declines we have seen have been sharp, directional, and difficult to interrupt.
Upside, by contrast, loses clarity. Rallies begin to overlap. They move, but they do not progress. Each push higher encounters supply sooner than expected. What would previously have been continuation becomes hesitation. What would previously have been expansion becomes rotation.
This is where the behavior of FBDs becomes critical.
In an expansion regime, failed breakdowns do not simply bounce, they extend. They reclaim, build acceptance, and drive into new highs. That is what continuation looks like when the system is supportive.
In a constrained regime, they still trigger. They still produce a reaction. But they fail to transition into trend. They resolve the imbalance, and then they stall. That is exactly what we have seen repeatedly over the past several weeks.
The setup did not break.
The environment did.
This is not random noise..
And once you understand that, the expectations must change.
You stop assuming continuation.
You stop rewarding midrange trades.
You stop chasing movement simply because it exists.
Instead, you begin to anchor everything to location.
You recognize that rallies into supply are opportunities to evaluate failure, even short, or hedge, not to add strength.
You recognize that support must prove itself, not be assumed. And most importantly, you recognize that not every move deserves participation.
Because in this type of environment, the edge is not in activity.
It is in selectivity.
Here’s what I’m looking at Wednesday March 25
📊 Likely Supports for March 25
High-Priority: 6611, 6565, 6527, 6492
Medium-Priority: 6640, 6591, 6574, 6552, 6542, 6534, 6510
📈 Likely Resistances for March 25
High-Priority: 6676, 6690, 6762, 6790, 6800
Medium-Priority: 6684, 6705, 6736, 6752, 6778
The question, then, is not where price will go, but how it will behave at these levels.
If price fails to establish acceptance above 6676–6690, the recent advance is likely to be interpreted as corrective, with a return toward 6611 as the natural progression. That is the low risk shorting opportunity here.
A failure at 6611 would further reinforce the bearish structure, opening the path to lower levels.
In environments characterized by transition, the cost of misinterpretation is high.
Patterns that worked in prior regimes may no longer be reliable.
Indicators may produce signals that are less actionable.
At this point…
At this point, the question is not direction.
It is environment.
Because the market is still moving. It is still offering opportunity. But the way those moves develop has changed, and that change is now consistent enough to matter.
Rallies are no longer building.
Continuation is no longer assumed.
And when those two things shift, everything else follows.
Oil is elevated.
The dollar is firm.
That combination tightens the system, and when the system tightens, price becomes less forgiving. Moves resolve, but they do not extend. Strength appears, but it does not persist. What used to trend now rotates.
That is the environment.
Location is not enough. Reaction is not enough.
Only acceptance matters.
And until price can prove it can move higher and hold…
The burden of proof remains.