
Same Levels, New Intentions – June 2 – ESDaily Gameplan
Structure didn’t change — behavior did.

Monday June 1, 2025
Structure didn’t change — behavior did.
We’ve been here before.
Literally — these levels haven’t changed.
But what they meant last week wasn’t the same as what they meant the week before. It doesn’t mean they’ll mean the same this week.
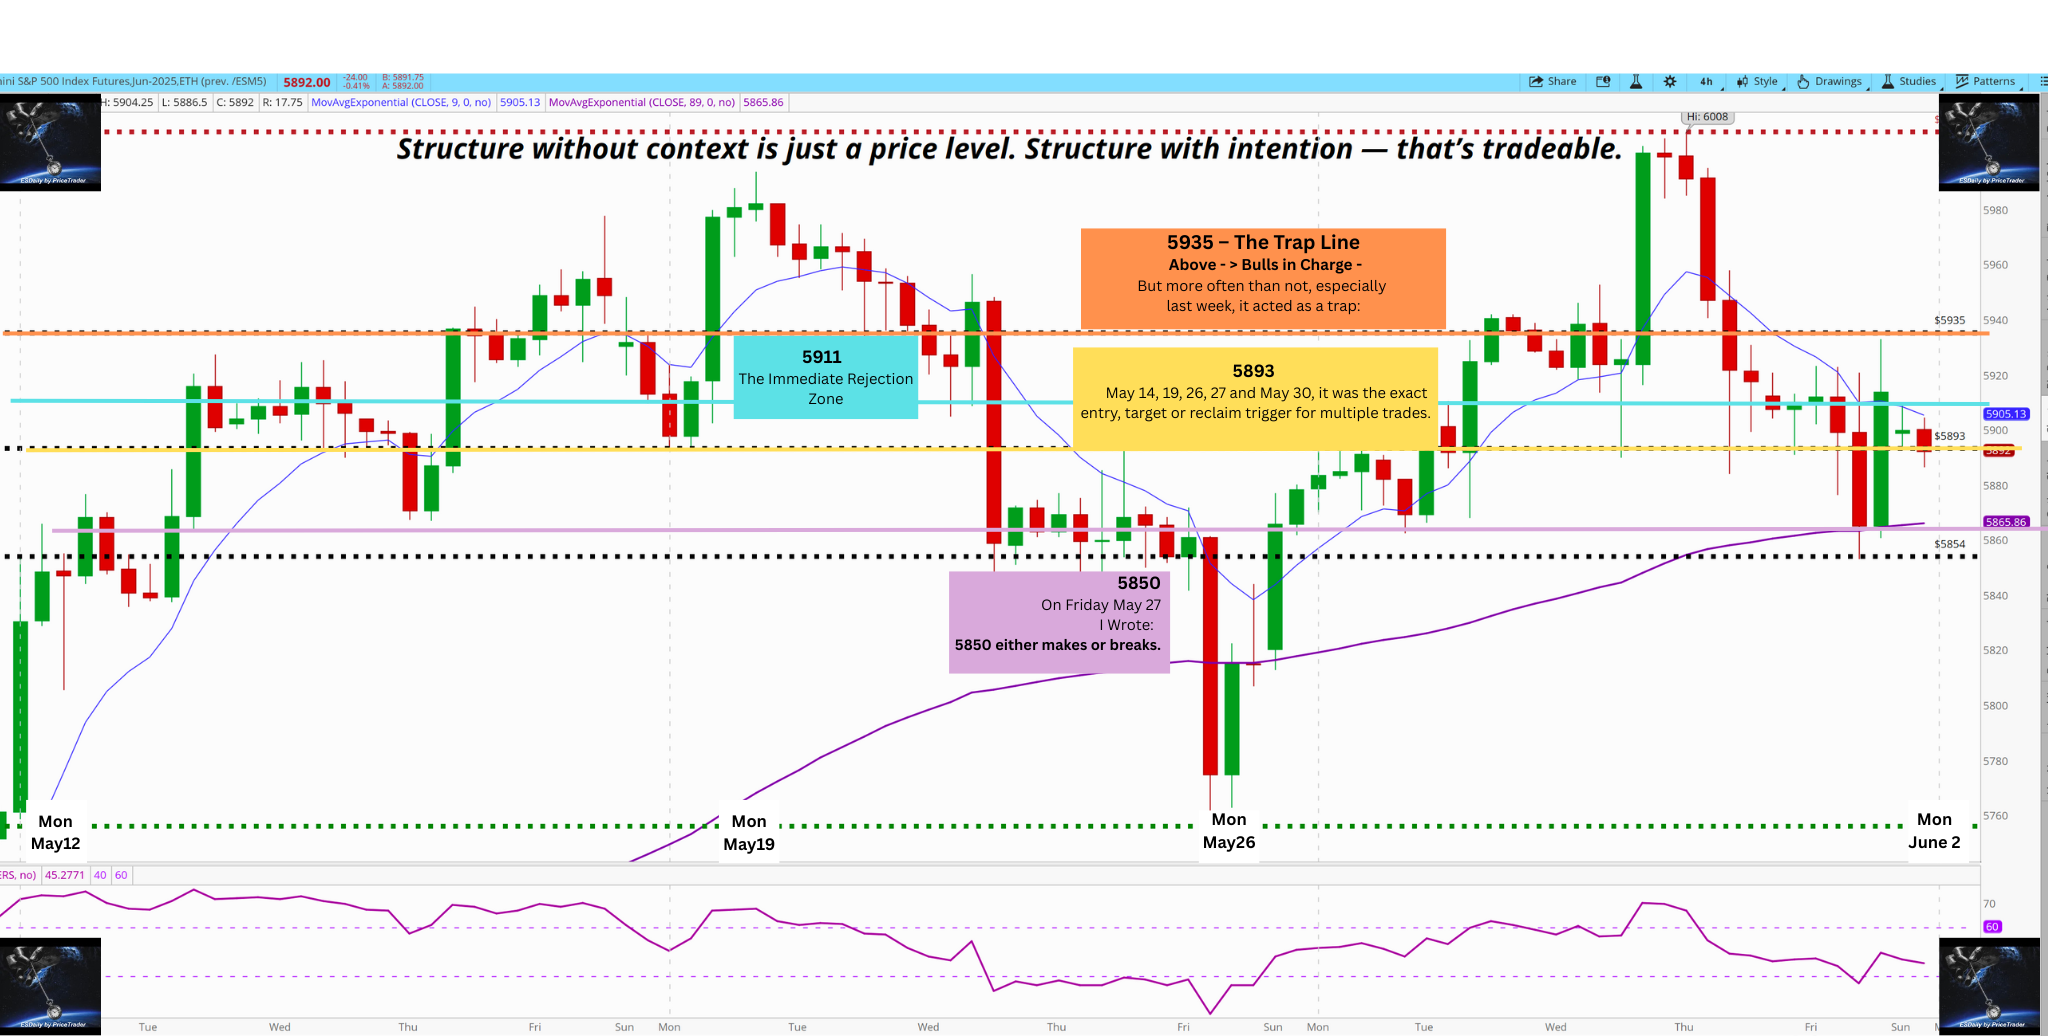
Structure without context is just a price level.
Structure with intention — that’s tradeable.
Take a look at the zones we traded around Friday:
We know them. We’ve mapped them.
But over the past few sessions, they started acting differently.
👉 5850 — The Battleground
This level’s been tested more times than any other the past two weeks.
On May 21, it held and launched a 150-point rally.
On May 27, you wrote:
“If 5850 holds, bulls have a shot. If it goes, nothing but air. 5850 makes or breaks”
Since then, 5850’s done both — held, failed, reclaimed, failed again.
It’s not a level that gives direction — it’s a level that asks a question.
When it holds, structure builds.
When it fails, liquidity gets hunted.
On Friday, 5850 held. But just barely. And that alone told us what kind of day it was.
👉 5878 — The Trap Door
Held as resistance on May 12 → support on May 15 → resistance again on May 22.
Then flipped to support again on May 26, May 27, and early on May 30.
You’ve called it a “line in the sand” — and on Friday, it did its job… until it didn’t.
Buyers defended it twice. But after the failure to hold 5893 and rejection at 5911, all eyes shifted back here.
Once it cracked — no hesitation. The flush confirmed the shift.
👉 5893 — The Magnet
This has been the rotational anchor since May 14.
We’ve hovered around it on nearly every trading day — sometimes reclaiming, sometimes rejecting.
When 5893 holds, structure builds. When it fails, we fade.
On Friday, we reclaimed it early, pushed higher… but failed hard in the middle of the session. That failure unraveled the tape.
👉 5911 — The Hinge
A true decision level.
Reclaiming 5911 has triggered continuation multiple times since May 15.
But just as often, it’s rejected — and each rejection has stopped bulls cold.
That happened again Friday. We poked just above… and got stuffed.
Momentum reversed immediately, and the long setups evaporated.
👉 5935 — The Trap Line
It’s been a bull bait level since May 21.
Reclaimed? Yes. Held? Rarely.
On May 22–24, it capped upside.
On May 28–30, it became the ultimate test: does demand mean anything?
That line played out over and over.
Price reclaimed 5935 just long enough to pull in buyers
I’ve written about these levels over and over the past few weeks — not because they’re magic numbers, but because they reflect how the market organizes itself around liquidity.
They’ve shown up in nearly every Gameplan since mid-May.
And not just mentioned — mapped, traded, reviewed, respected.
They’re spots where intent reveals itself — where traps are sprung, structure is confirmed, and traders either get aligned… or get caught.
Knowing the levels isn’t optional.
It’s the job.
So what did we get Friday?
We started with strength.
Price flushed early into 5884 — a level mapped in the Gameplan — and held.
Not just held, but reclaimed. The bid was clean, the structure was there, and the first long setup triggered off the 5893 reclaim, right into a push toward 5913.
That was the moment.
If 5911 could’ve held, bulls might’ve built something.
But it didn’t. Price poked above — then failed. Hard.
And that was the tell.
Momentum cracked.
Structure gave way.
We rotated straight back down through 5893 — the magnet — and into 5878, the trap door.
Buyers tried to hold it. Twice.
But once it broke, there was no hesitation.
But the session wasn’t done.
As we flushed beneath 5854, the major final long zone of the day activated.
One more failed breakdown. One more reclaim.
We were ready.
We bought it.
And price ripped: 5873 → 5880 → 5891.75.
All mapped.
All from structure.
Each from a different level — each telling us something about the character of the day.
This wasn’t just a directional move.
It was the market walking through each zone with intention.
Fail. Trap. Flush. Reclaim. Trigger.
Let’s break them down.
Click Links Below To Scroll To Sections
💡 Intro
📊 💥 Trade Review and Market Action - Previous Session
📊 Trade Reviews From Last Several Sessions
📍 Current Open Position(s)
📈 Overnight Activity
🧠 Trade Rules
🏆 ESDaily Scoreboard
✍️ The Next Piece - Today’s Opportunities/Gameplan
🙏 Important Notes
Note: We’ve edited the newsletter format and added a scroll link to the newsletter sections. Substack doesn’t provide native Scroll To Section links. These work on desktop and may be glitchy on mobile/inside email. Thank you for your feedback.
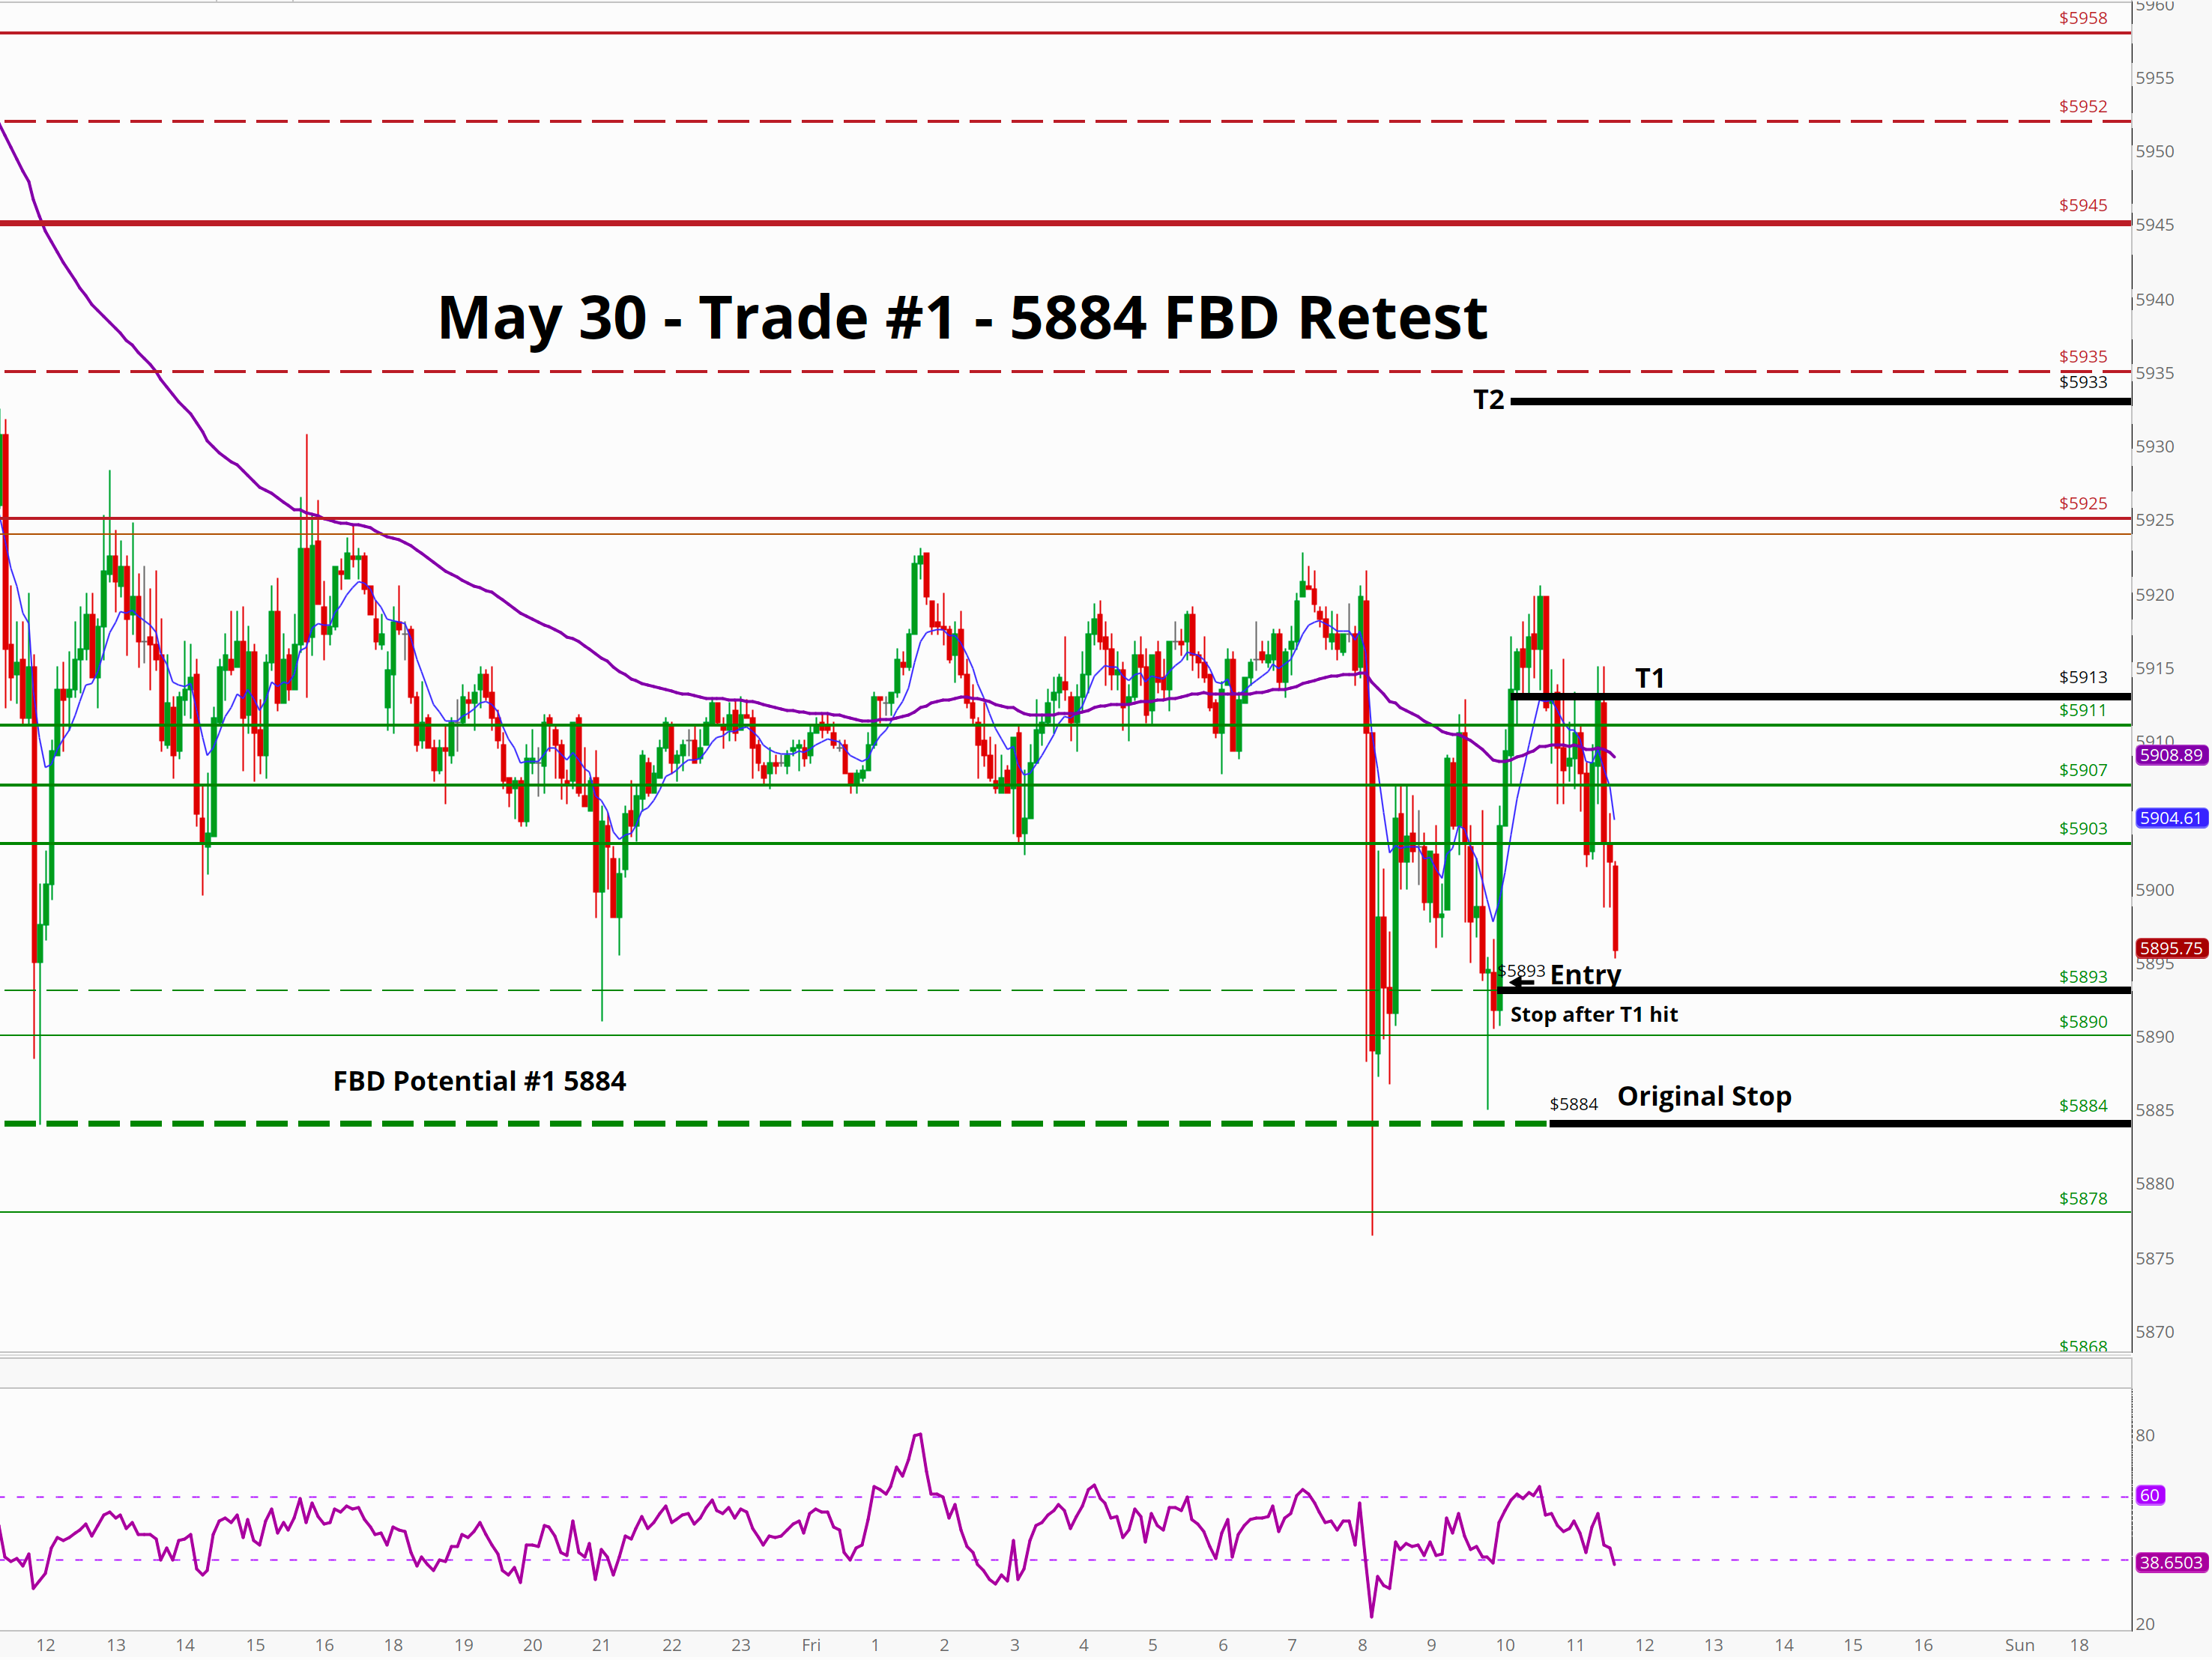
📊💥Trade Review — May 30, 2025 - 3 Trades
Trade #1 – 5893 Long off 5884 Reclaim
Here’s what I wrote in the AM Newsletter “Sell First, Hunt Later”
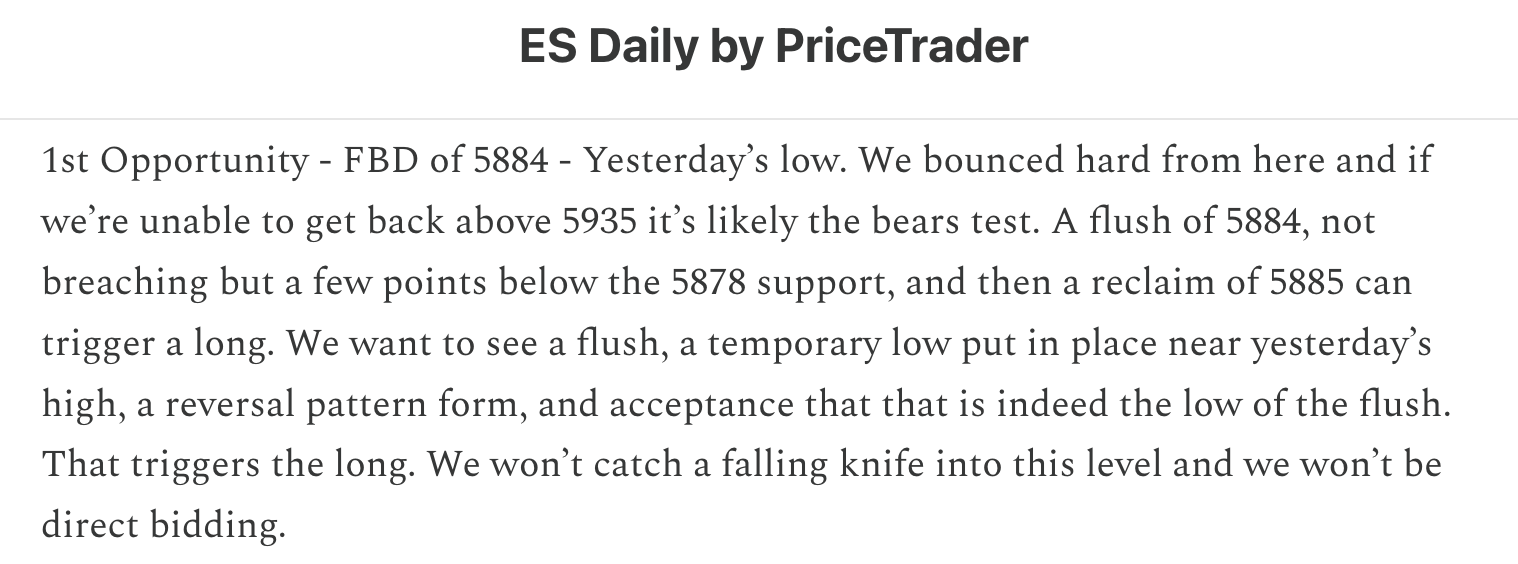
The first setup showed up early — and clean. And it showed up twice.
We opened soft, flushed into the 5884 zone, and then quickly reclaimed. I was dealing with things happening at the office, and I wasn’t able to capture the first attempt. But a little later, we came back and reset the structure.
At 10:32 I offered my entry live on X.
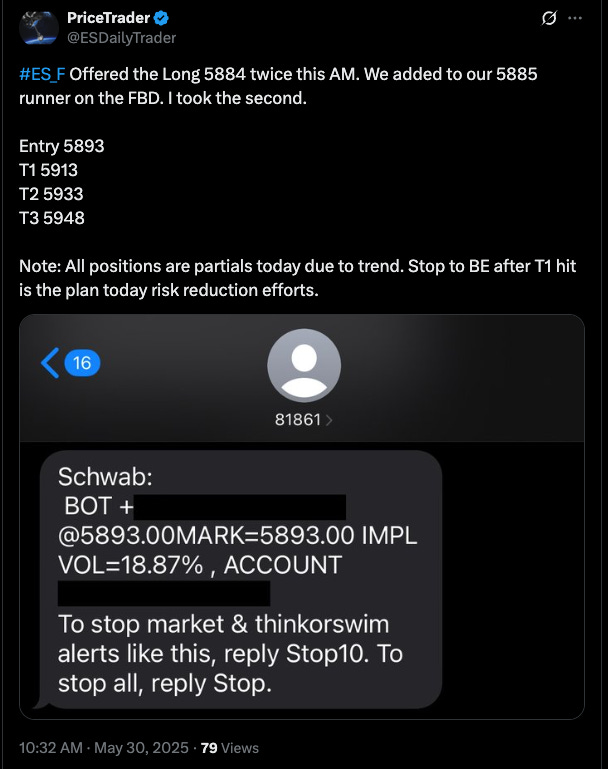
A second attempt of 5884 after a flush, with structure forming right back above 5893, the magnet level.
I didn’t need more confirmation.
I took the trade: long at 5893.
Structure looked good, and momentum supported the bid.
I called it partial size — “trend risk” — because I didn’t love the overnight pressure, but the setup was textbook.
Within minutes, price moved right into my first target: 5913.
That was a level I’d mapped earlier in the week, and the reaction confirmed it — sellers stepped in hard.
I took profits there. Locked in the win and offered the receipts here on X.
I wrote this upon entry:
“Stop to BE after T1 hit is the plan today risk reduction efforts.”
And when 5920 gave way… the tape shifted.
We didn’t get continuation — and I didn’t need to force it.
The trade did its job. Reclaim the zone. Hit the target. Then it fell and hit our stop out.
Fast. Clean. No hesitation.
It didn’t break the day open, but it opened the door.
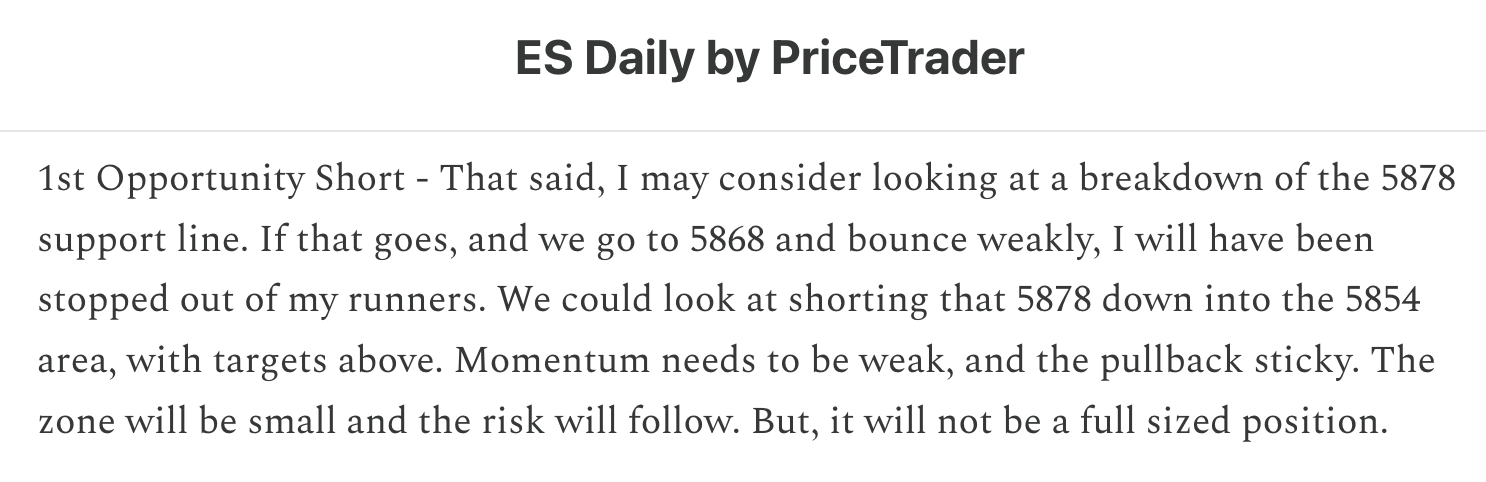
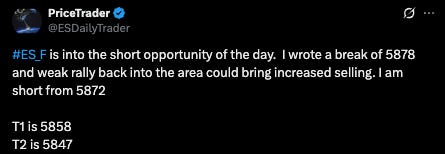
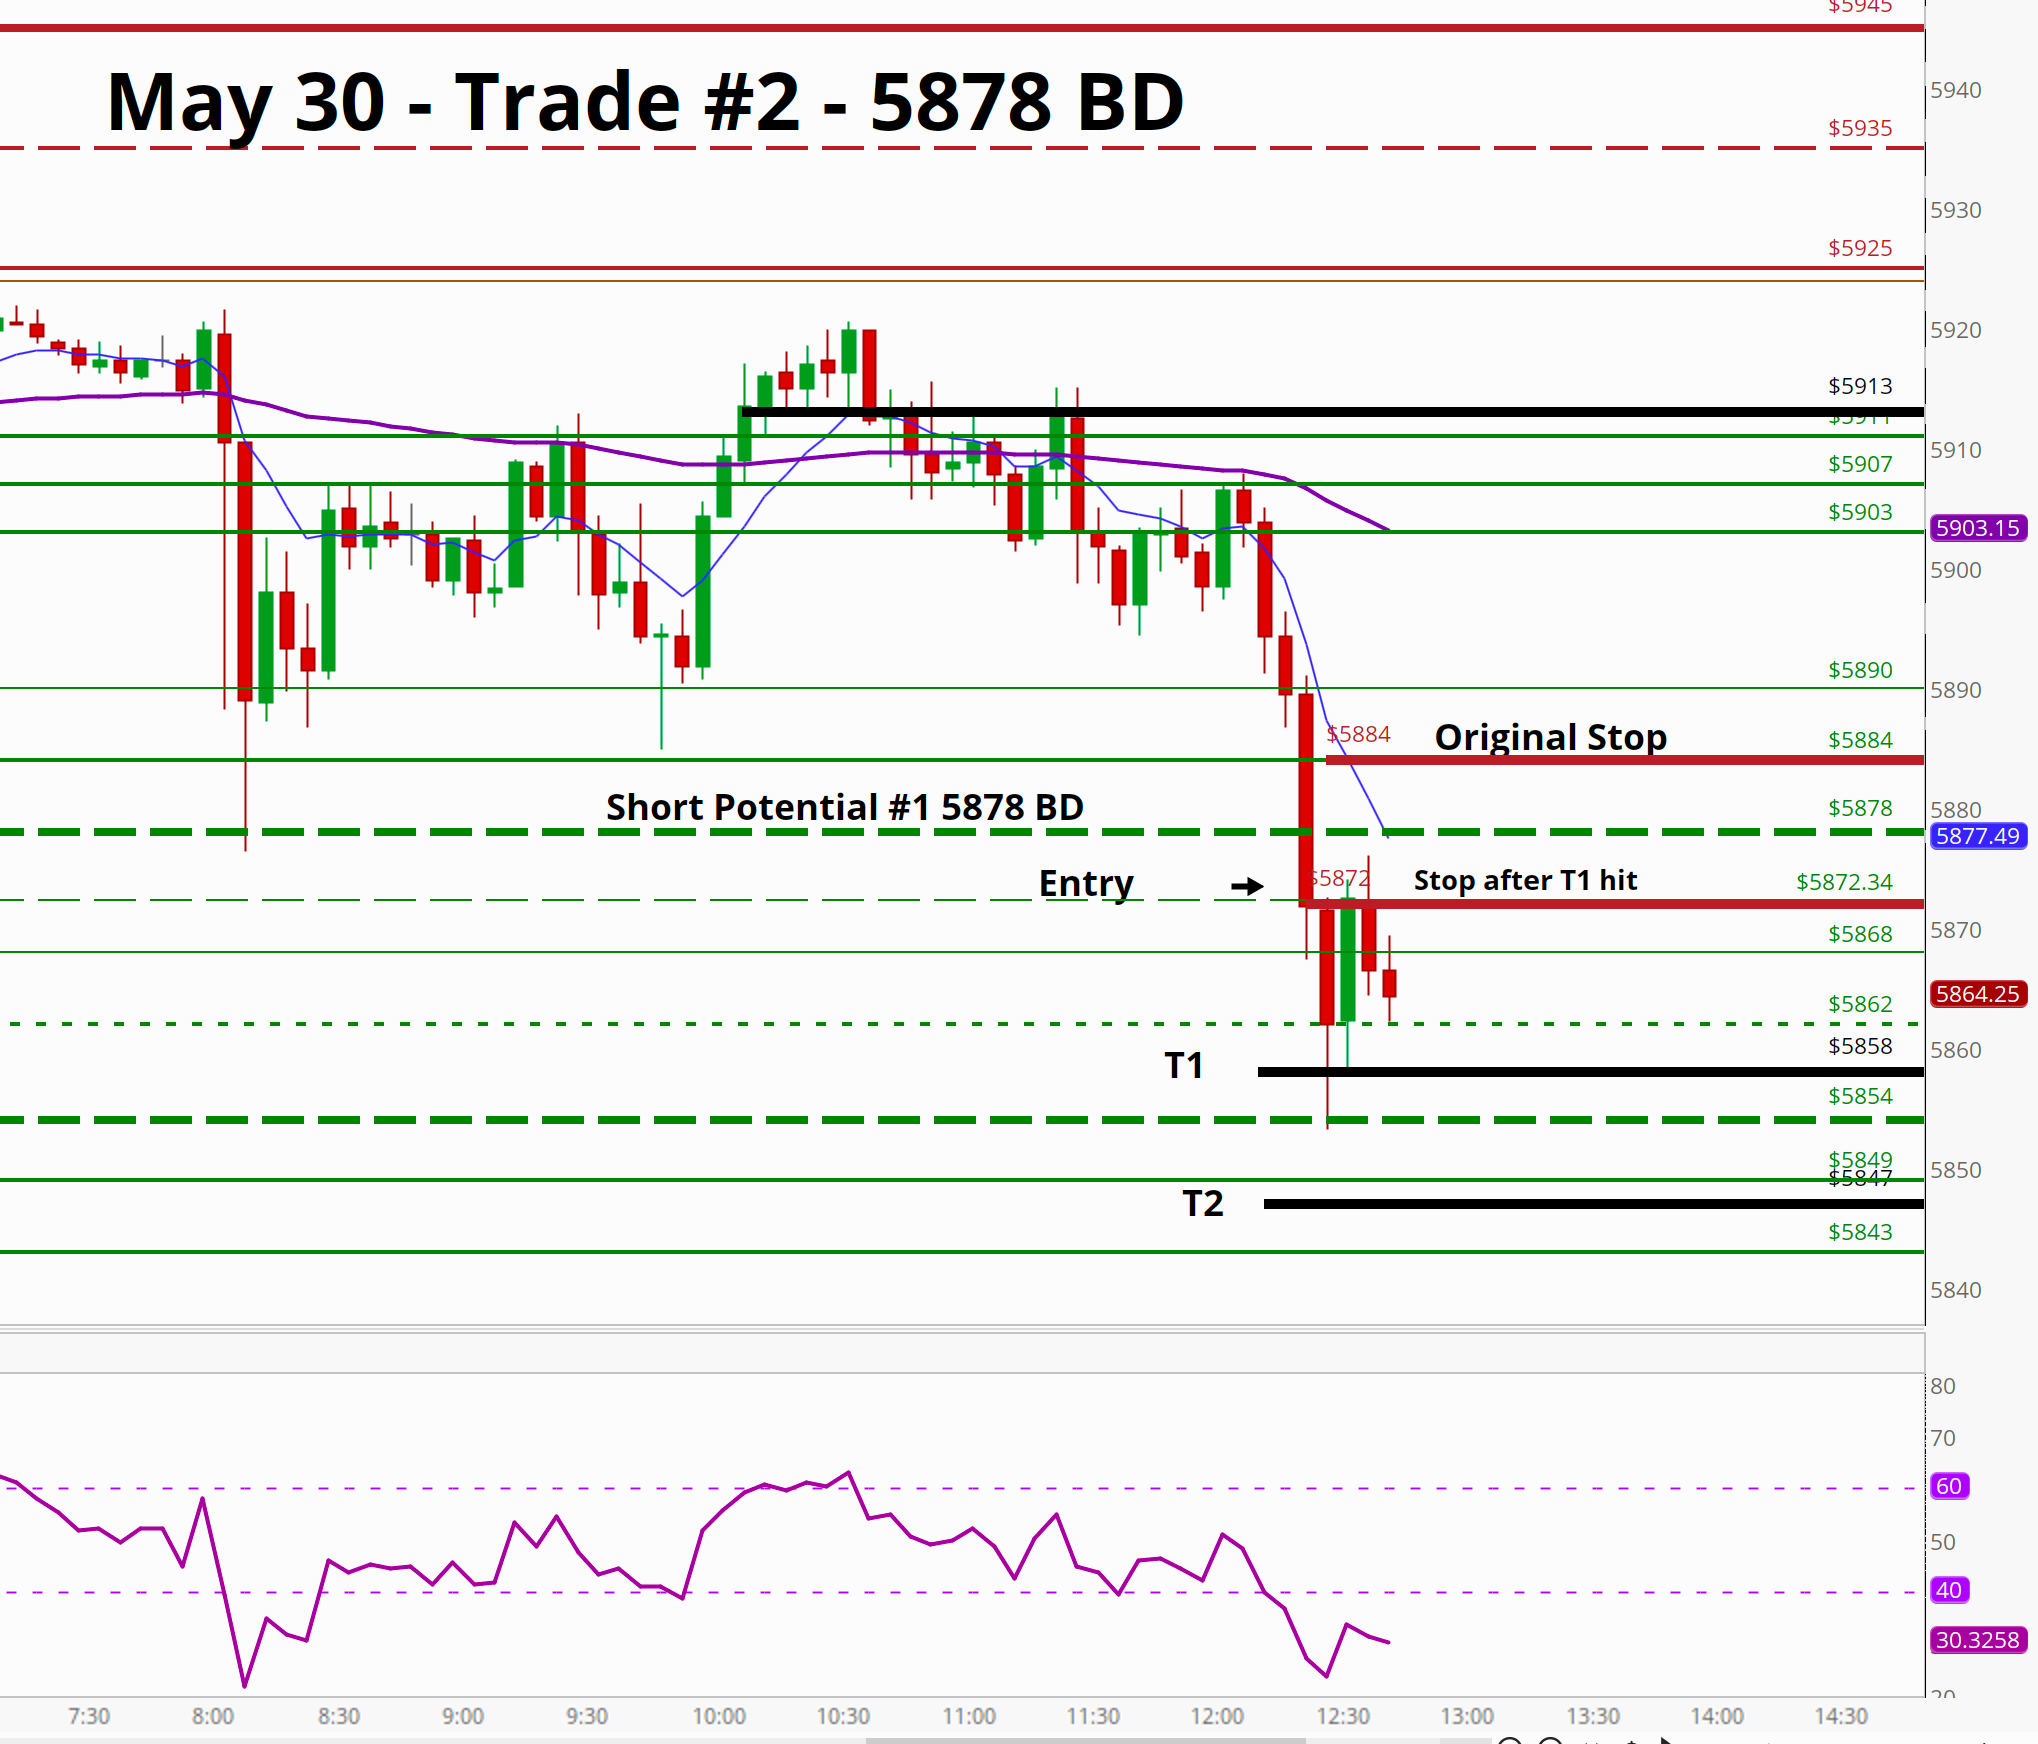
Trade #2 – 5872 Short off Breakdown of the Trap Door
Here’s what I wrote in the AM Newsletter “Sell First, Hunt Later”
The failed follow-through from Trade #1 told us everything.
We hit 5913 — then stalled.
5911 didn’t hold.
5893 didn’t hold.
Structure started to unravel.
All eyes were back on 5878 — the trap door.
This level had done everything all week:
Resistance → Support → Resistance → Support again.
It held twice early Friday… until it didn’t.
Once 5893 failed, the setup flipped short — and 5878 was the trigger.
I didn’t hesitate.
That was the plan: clean break below 5878 → enter → manage risk tight → take size off on strength.
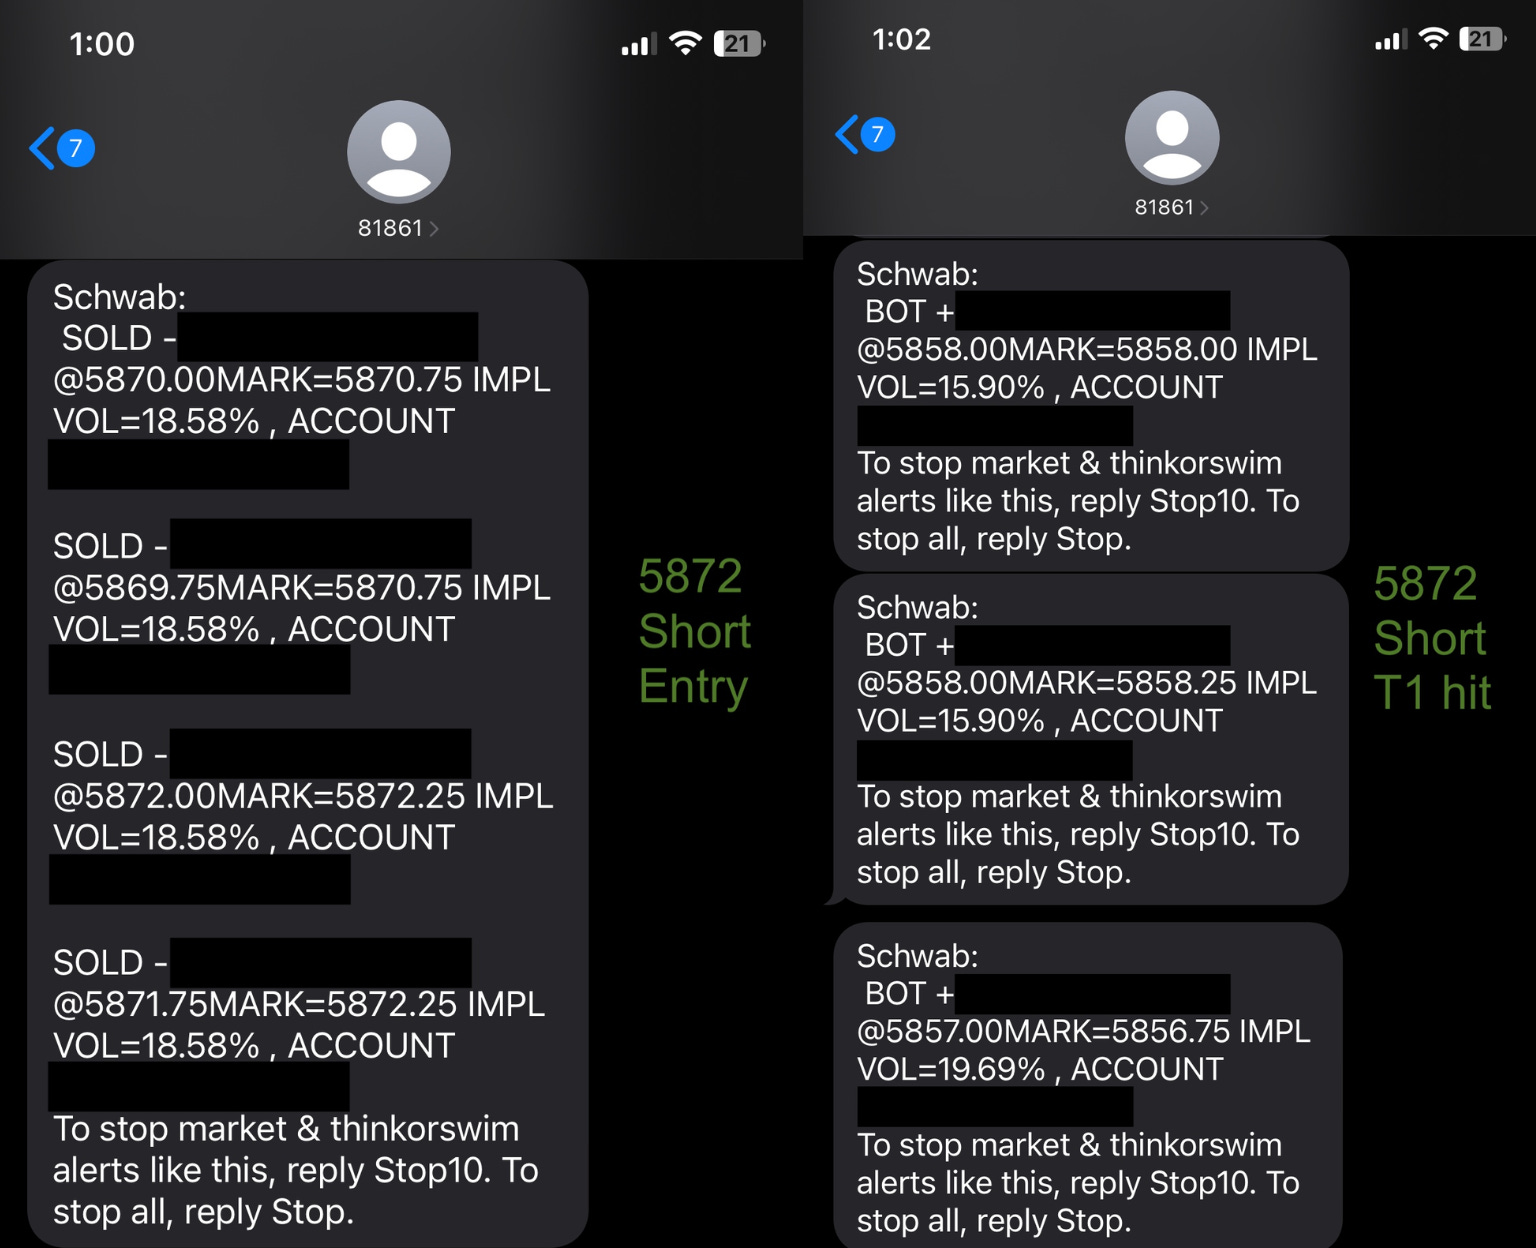
It played out fast.
We flushed right into 5858. I took profit there.
No hesitation, no squeeze — just follow-through.
I moved my stop on the remaining size and started watching for the next level below: 5854 2nd FBD - the long opportunity .
Though it appears to be one, this wasn’t a scalp.
It was structure-based and planned.
A breakdown of the most defended level of the morning, with momentum confirming.
The short didn’t last long — but it did its job.
T1 hit, risk managed, stop to B.E., and the next trade was already forming.
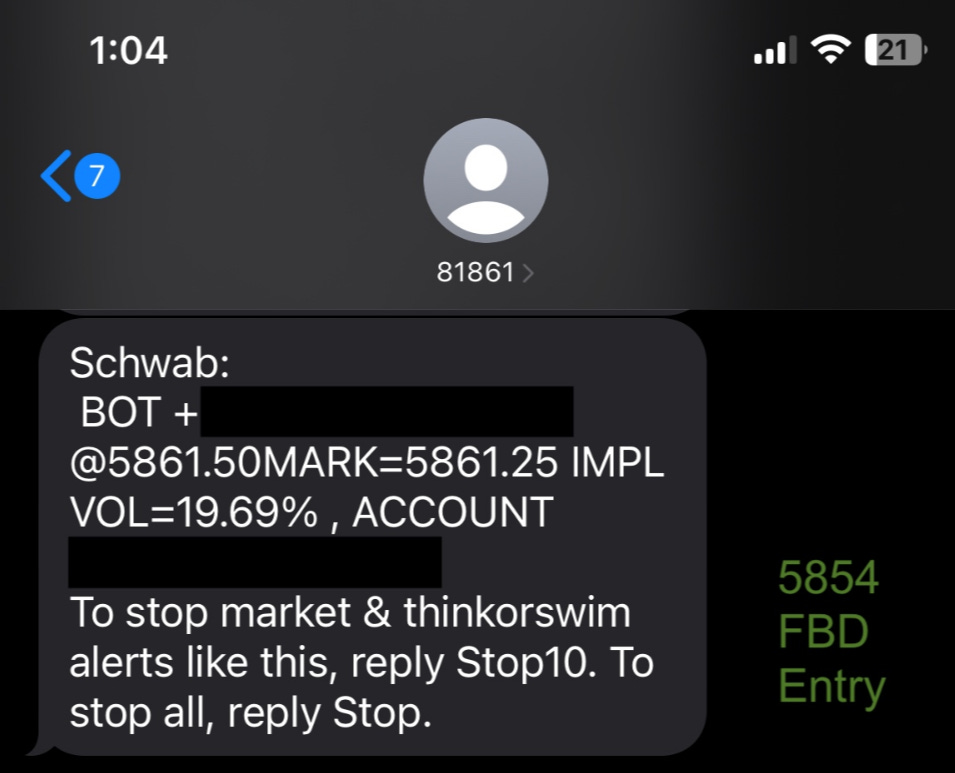
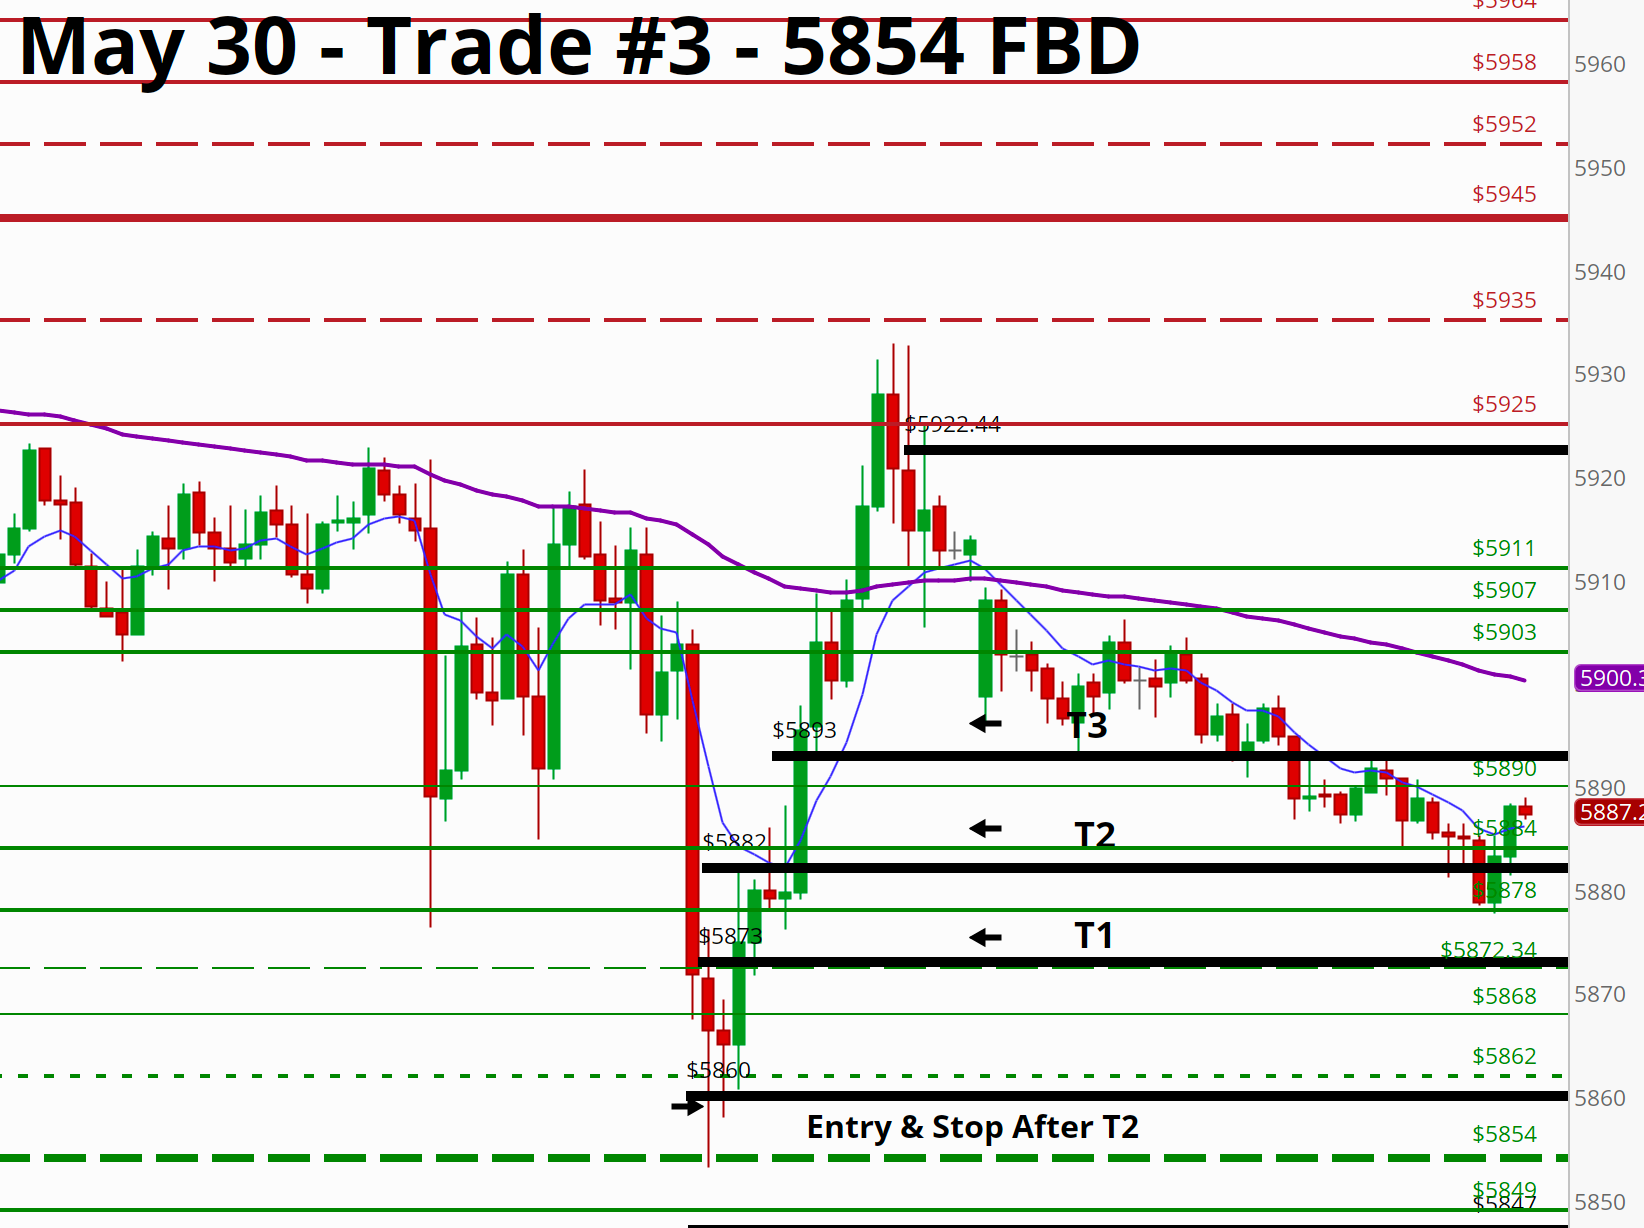
Trade #3 – 5861.25 Long off 5854 Failed Breakdown
The short played out.
But what followed was even better.
We flushed right into 5854 — the final zone on my Gameplan for a potential FBD long.
I said it clearly in the morning: if price flushes 5854 and reclaims with structure, I want it.
Here’s what I wrote in the AM Newsletter “Sell First, Hunt Later”
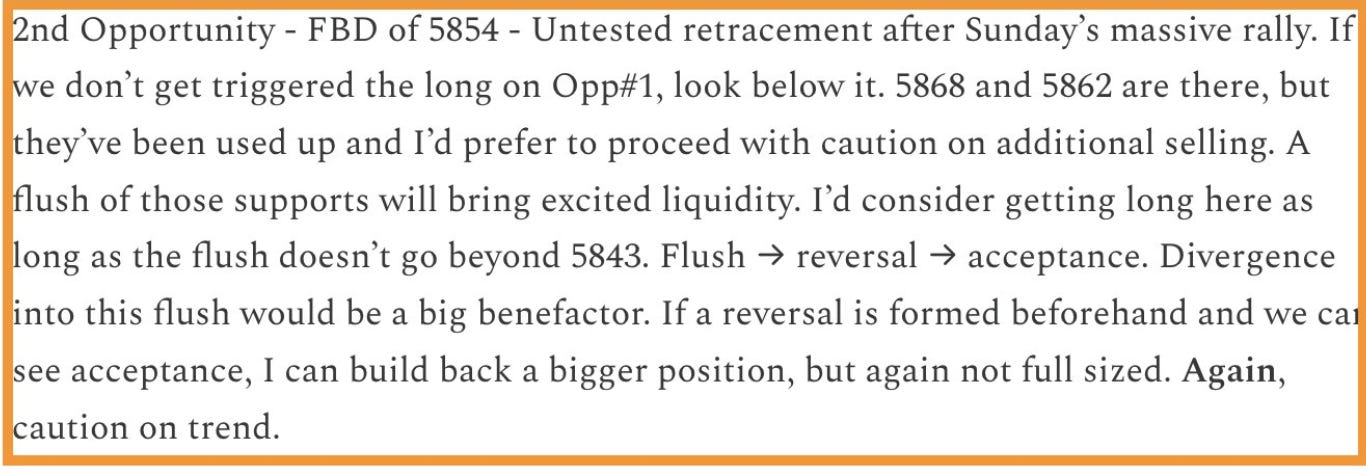
That’s exactly what happened.
We pushed through the zone once 5878 broke down.
ES bottomed at 5853.25, then reclaimed 5854 with momentum.
Divergence showed up. Buyers stepped in. Structure tightened.

Immediately we popped from 53.25 came back and tested, and I got long.
It moved fast.
T1 hit clean.
T2 followed soon after, I moved my stop to breakeven. And price rallied the rest of what was left in the afternoon.
And I took T3 before we got back up to 5893.

The trade felt like a replay of Wednesday’s setup — flush the level, reclaim the zone, fire higher.
Trade #4 – 5824 Long off 5854 Failed Breakdown - Late in Day
I did end up taking Trade opportunity 4 on the day just with a tiny position.
Here’s what I offered as a 4th Opportunity wrote in the email immediately following the AM Newsletter “Sell First, Hunt Later”
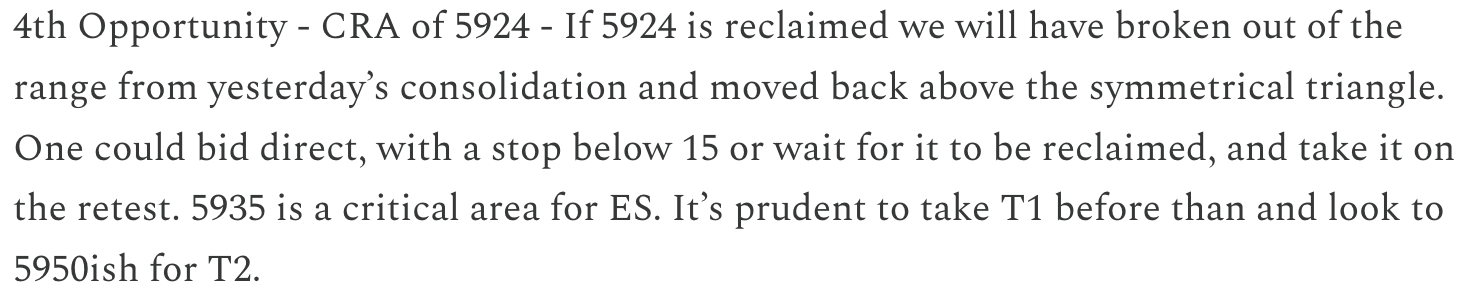
At 3:15PM on Friday, after we securely booked T3 on the 5854 FBD, I added a small position. Negligible really, but I’ll include it quickly. I wrote 5924 was a reclaim and if we got it, we’d pop out of range. We’d likely see a quick move to 5935 area. We did. and I entered at 5924 and took profits at 5931.

Same levels.
New intentions.
Clean structure all day — and every trade came from the plan.
4 Trades Pre Mapped - All Taken = A Very Busy Day.
Thankfully, we were able to get a piece of some, and took a bigger slice of the 5854 Long.
But that was last week.
What does it all mean heading into this week?
We just rotated cleanly through five major levels — every one of them tested, reclaimed, rejected, or flushed with intention. That’s not noise — that’s information.
Price respected the map.
Liquidity showed up exactly where it should.
And every valid setup required discipline, not prediction.
So now the question is — what’s next?
Do we build from Friday’s bounce off 5850?
Do we chop through this range while NVDA and month-end flows settle?
Or do we revisit the lows from the 5750s?
I’ll be watching how we treat 5866, 5893, 5911, and 5935 early in the week.
If bulls want control, they need to reclaim 5933 with force and hold.
If they can’t — it’s back to the downside, one failed support at a time.
I’ll break that down in detail in tomorrow’s Gameplan.
For now — the levels are drawn.
The tape’s talking.
Let’s get ready.
Current Open Position(s)
May 30 ESDaily Gameplan “Sell First, Hunt Later”
We are long from Opportunity #2
5854 - Long Opp. - Runner Stop is at breakeven
Sunday Evening/Monday PreMarket Morning Recap
After ES finished Friday strong, we opened Sunday evening with a small gap down and price has faded slowly, currently printing 5890 and slowly getting into a 5880 LTB/ I do not like the price action at this level, the approach is pretty bad, and at these times, I’m not interested. But momentum is weak, hovering right around 40. A break below 5866 would likely lead us to Friday’s low, but that is unlikely before RTH. A lot of ground for bulls to gain momentum. We’d need to see above 5989 hold, and rally to the gap at 5913. From there, bulls need 5933 reclaimed. Everything in between this = chop → un-tradeable.
🧠***Important Core Setups and Trade Rules***🧠
This section doesn’t change often—because it shouldn’t.
It’s the backbone of consistency in trading. Repeating what’s outlined below, day after day, helps strip away hesitation and eliminate decision fatigue. When the rules are clear, there’s no need to think—just execute.
I can’t say this loud enough: Take the majority of your profits at T1.
If I could write it in blinking lights, I would.
It’s that important.We do this for one simple reason—it keeps the win rate high.
Just look at the Scoreboard below. The results speak for themselves.
This system works because we take profits early and manage risk relentlessly.Limit your trades. Know when there’s opportunity—and when there’s not.
It’s hard to sit still. I get it. But learning to wait is a core skill in this business.
We don’t earn steady wages.
We get paid when we execute our setups, with discipline, in the right spots.The market doesn’t hand out trophies for participation.
Too many traders stack early wins, only to give them back with one bad decision.
One overtrade.
One impulse long.
One “I’ll just try this” at the wrong time.
That’s how edges disappear—and capital evaporates.Trading rewards patience, not action.
Sit on your hands until your spots come to you.
Let the setup build.
Let the tape reveal its hand.
If it’s not clean—skip it.Your job is not to trade all day.
Your job is to extract high-quality risk from the market, and guard your capital like it’s your newborn baby.Each session is a building block laid on top of the previous day.
Before we can trade well, we need to understand where price is, what structure it’s creating, and which areas are critical. That’s why I spend so much time on the trade recaps. Patterns repeat. Structures evolve. If you know what to look for, it becomes second nature.
We should be like machines:
Wait for the setup → Execute by the rules → Rinse and repeat.
The real work is in the prep.
I’ve never met a successful trader who skips it.
If you don’t know your levels — you’re already behind.
And if you’re new here (and this community is growing fast), make sure you read the ESDaily Core Strategy before anything else. It’ll change the way you approach the market.
📊Trade Recap Section:
Note: This section breaks down a few of the trades we’ve taken over the past several days—what I saw, why I acted, and how I managed each setup in real-time.
These aren’t hindsight reviews. Every trade you’ll see here was shared with readers in advance—either in the newsletter or on X.
Years ago, I started documenting every trade I took in a physical journal. I’d print the charts, scribble notes, track my thought process before, during, and after each execution. That simple habit became a cornerstone of my growth. It forced me to stay accountable to my rules, refine my edge, and improve faster than anything else I’d done.
Now I bring that same discipline here—so you can see the full picture:
Real trades
Real decisions
Real outcomesThe goal is simple: shorten your learning curve by showing what it actually looks like to apply a strategy in live markets.
Whether it’s an LTB, a Failed Breakdown, or a momentum reclaim—every setup has context, structure, and risk management behind it.
Heads up: Any targets or runners mentioned below may have since been stopped out, moved, or closed. I document all ongoing trade management in future newsletters and live on X.com.
Let’s dig in.
📊Trade Review — May 23, 2025 - 2 Trades
On Friday I Wrote This About 5850
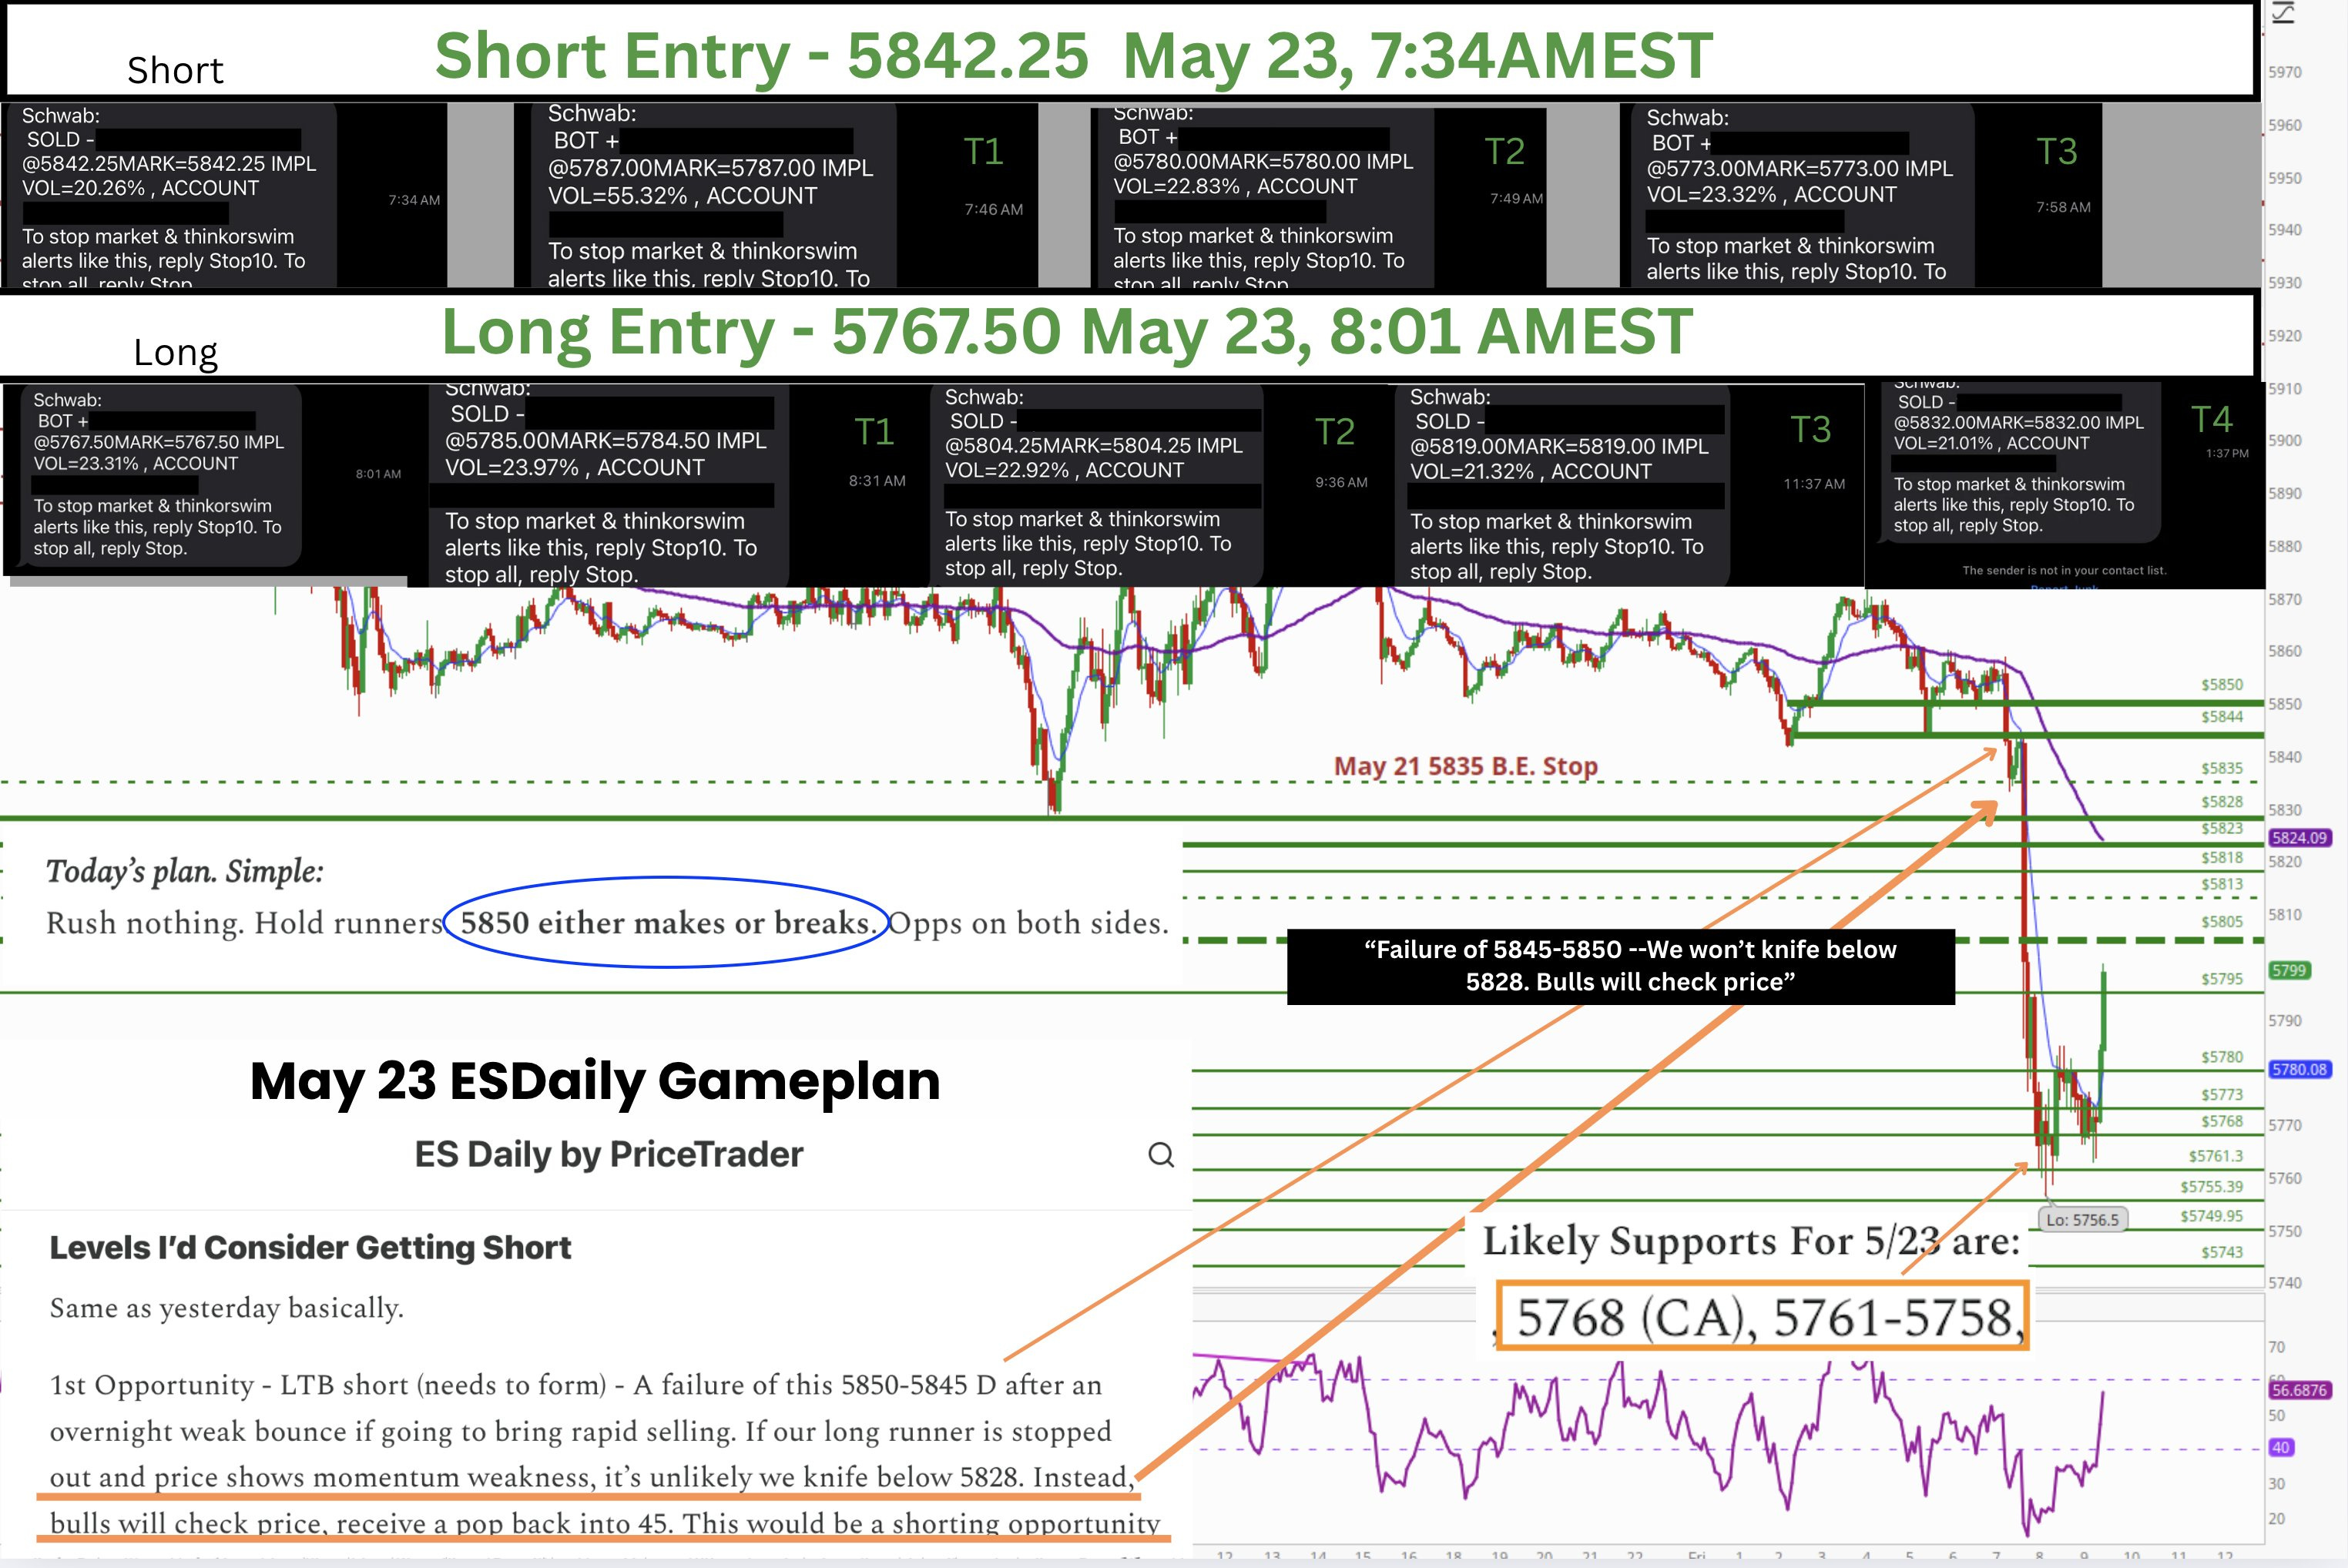
Today’s plan. Simple:
Rush nothing. Hold runners. 5850 either makes or breaks.And then I wrote this about the 1st Long Opportunity I was looking at:
1st Opportunity - LTB short (needs to form) - A failure of this 5850-5845 D after an overnight weak bounce if going to bring rapid selling. If our long runner is stopped out and price shows momentum weakness, it’s unlikely we knife below 5828. Instead, bulls will check price, receive a pop back into 45. This would be a shorting opportunity for bears. If demand is broken here, sellers pickup, we catch a weak bid, and we weakly bounce back into 5845-5850, that is a potential short for traders. RSI will tell us if momentum OK’s this
May13th is the level I was looking at:
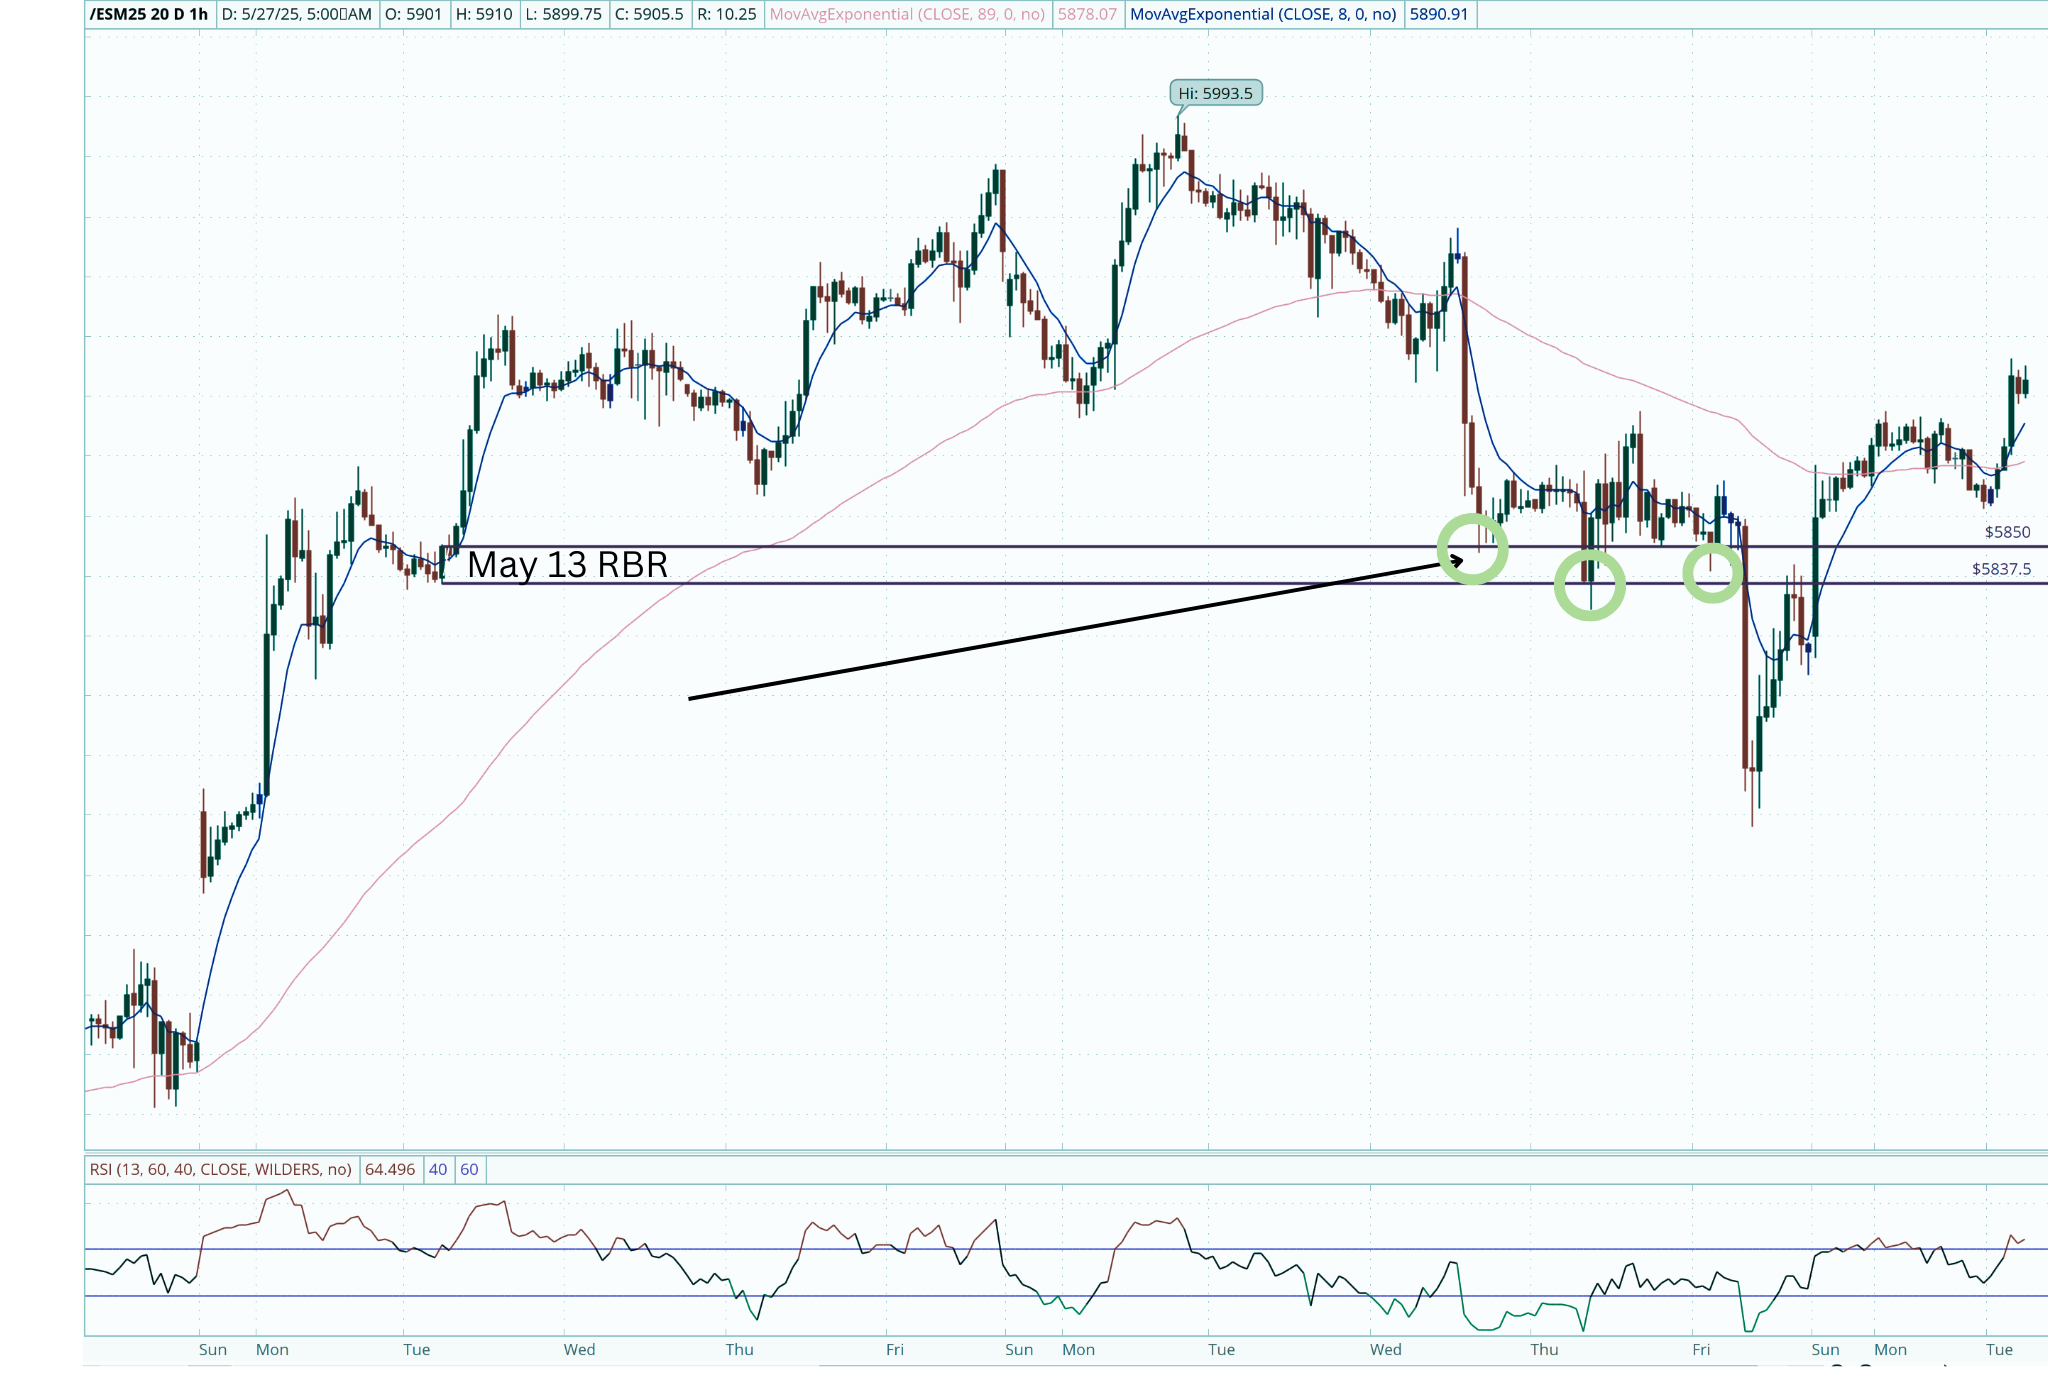
You can see on the hourly chart we came into the level Wednesday, Thursday, and again Friday early. Just hovering right at the May 13th rally-base-rally.
Momentum had no legs, could barely pop above even 40 on Thursday’s bounce.
This type of hovering at a key demand/supply area is typically indicative of a continuation pattern from the previous move.
What was the previous move?
Down.
If we zoom into a 5 min chart, we can see price action a bit clearer
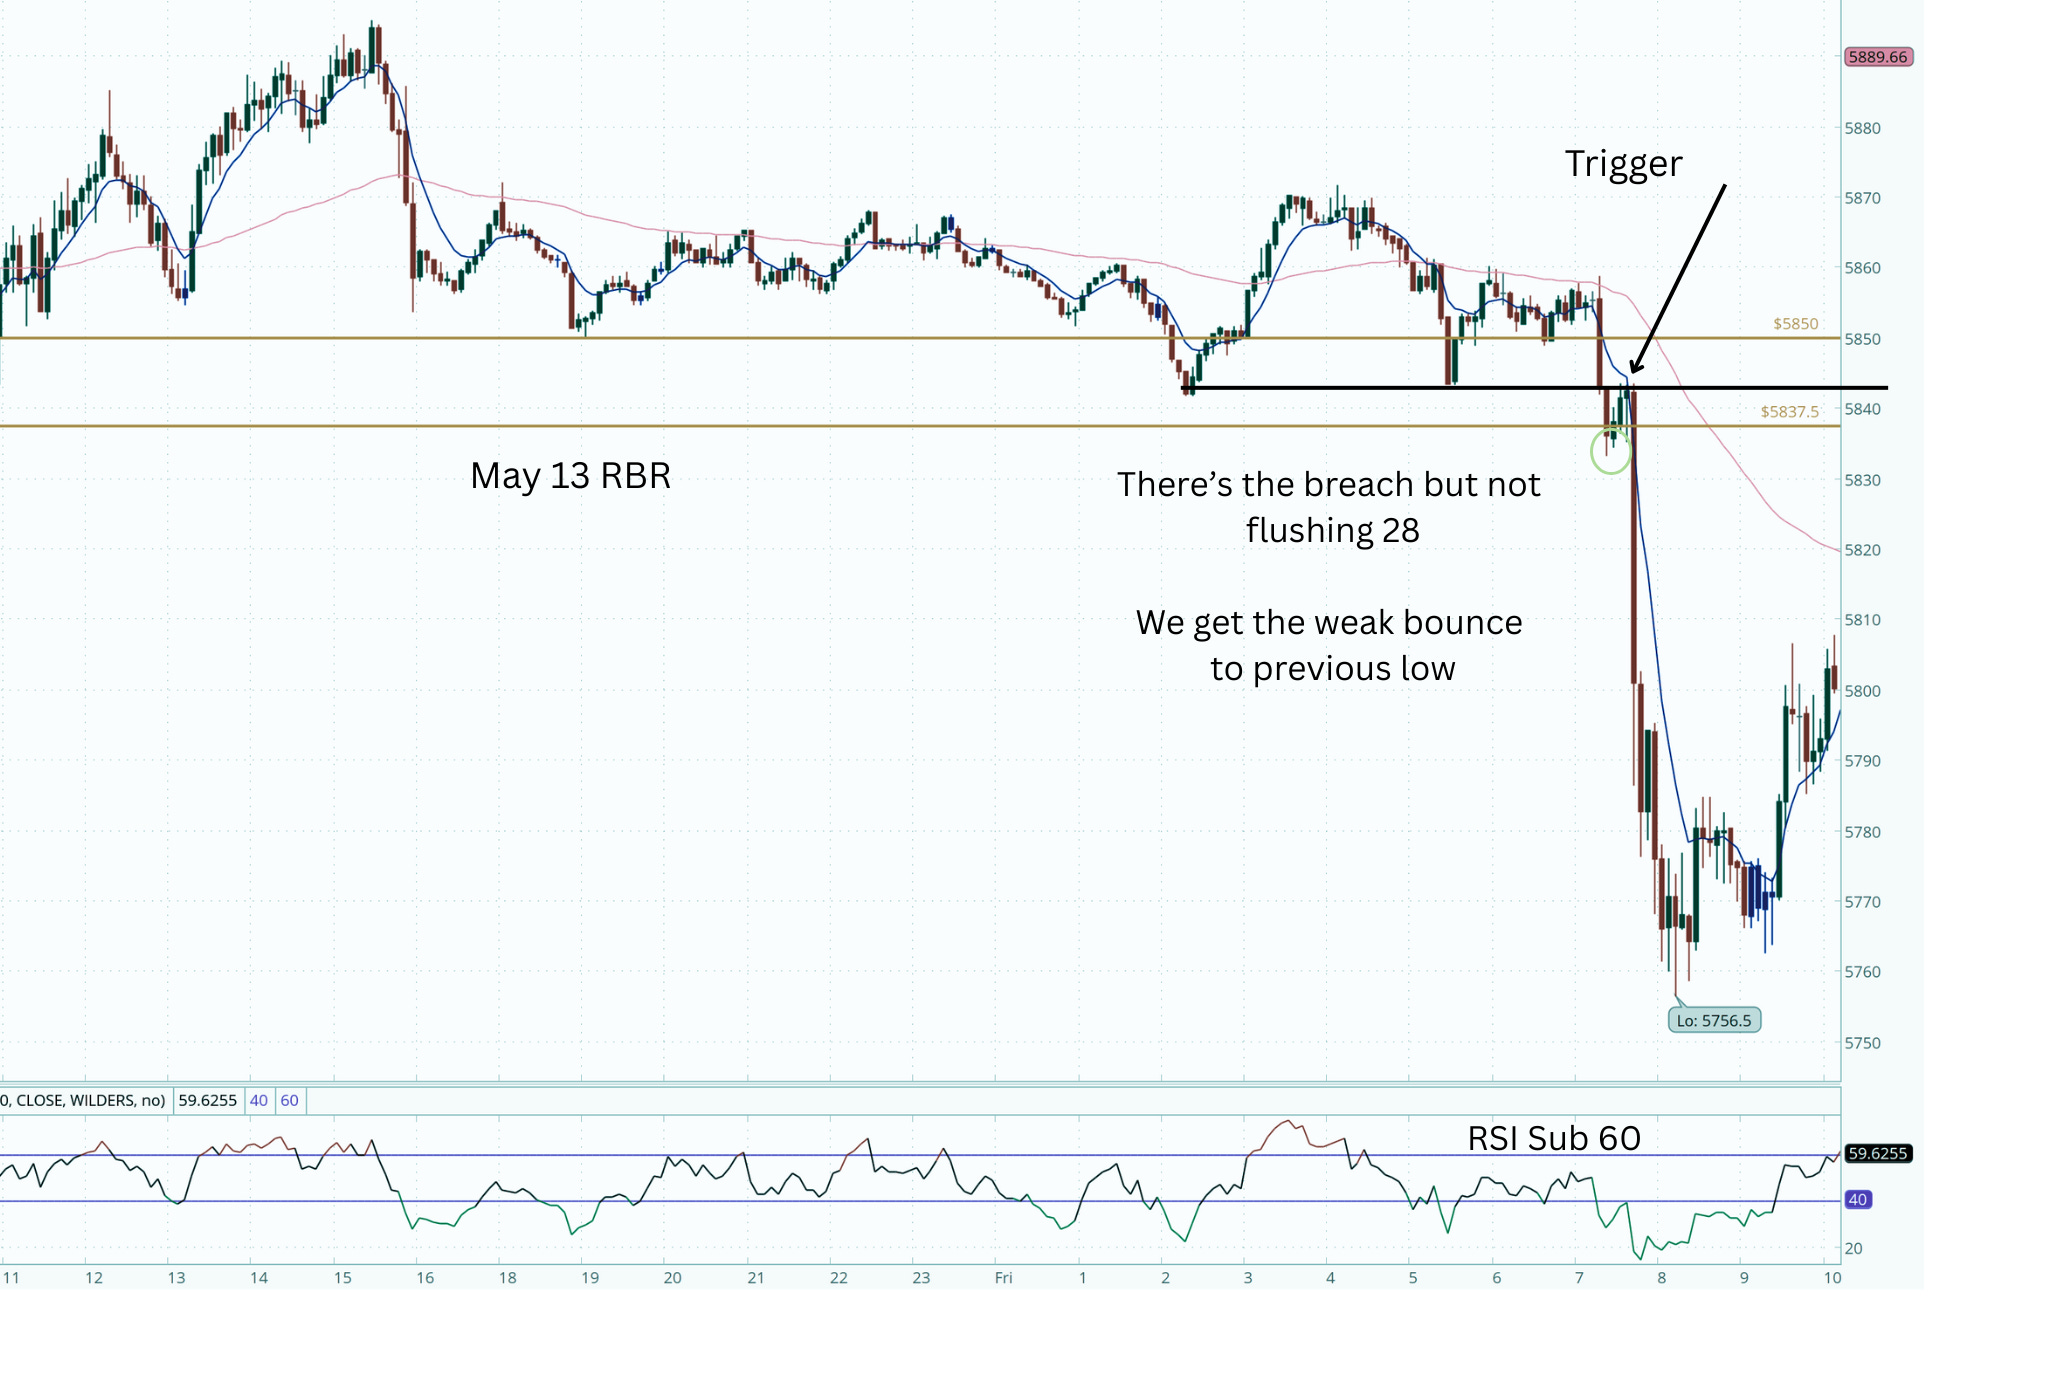
So we have:
Selloff into 1 hr demand
Below 40 on RSI (unlikely to bounce and create new highs without pullback)
Basing in/at just above the level
Lower high lower low on smaller time frame
Flush that held 28
Weak bounce
Small risk areaSay what you want about fundamentals, I truly do not even know what the news was. Don’t really care. All the technicals were right in front of us to know 5850 could fail and could fail hard.
So when I wrote that opportunity, I did that before knowing we were going to breakdown. I knew 5850 was important, but I hadn’t a clue as to which way.
But… I do know that price usually comes back to the breakout/down point and gives another stab at the level.
That opportunity got us into:
Trade Review May 23 - Trade #1
Entry: 5842.25
T1: 5787
T2: 5780
T3: 5773All hit quickly, and while I was driving. This trade was 25 minutes long.
Trade Review May 23 - Trade #2
Entry: 5767
T1 5785
T2 5804
T3 5819
T4 5832
I was stopped out of our 5655, 5666, and 5814.25 longs. That long campaign began Thursday May 8, and we had a heck of a run. We give thanks for both these two trades, and for the runners that kept us in the massive rally.
The long lasted nearly all day. As I was packing I received alerts that price was climbing.
I did receive several questions on having multiple targets that I want to address here:
T1 and T2 are always without fail 100% of the time at the next level. A few points before. This ensures most of our trades are profitable. I have no idea which way price is going to go, but when we stack odds we can get a high accuracy rate on price turning movements. Our job is to catch pieces of action, no the entire fleet move. Though Friday’s movement turned out to be the entire fleet move, that’s welcomed, not expected. Take the majority of contracts at the next level.
T3 is typically at a higher time frame area I consider a critical area/reclaim area or opposite side supply demand. So for instances on the short, the first major area I saw stacked supports was the 5768 area. I scaled out of that position and took my entire T3 before then, at 5773. Here’s why:
ESM 4 hour chart. We were collapsing right into the gap rally, base, rally. Yes below 40 on RSI but still a hug LTB opportunity. There was a lot of time between 8and 9:15 one could’ve gotten long as we formed a bottom. Inside a HTF zone.
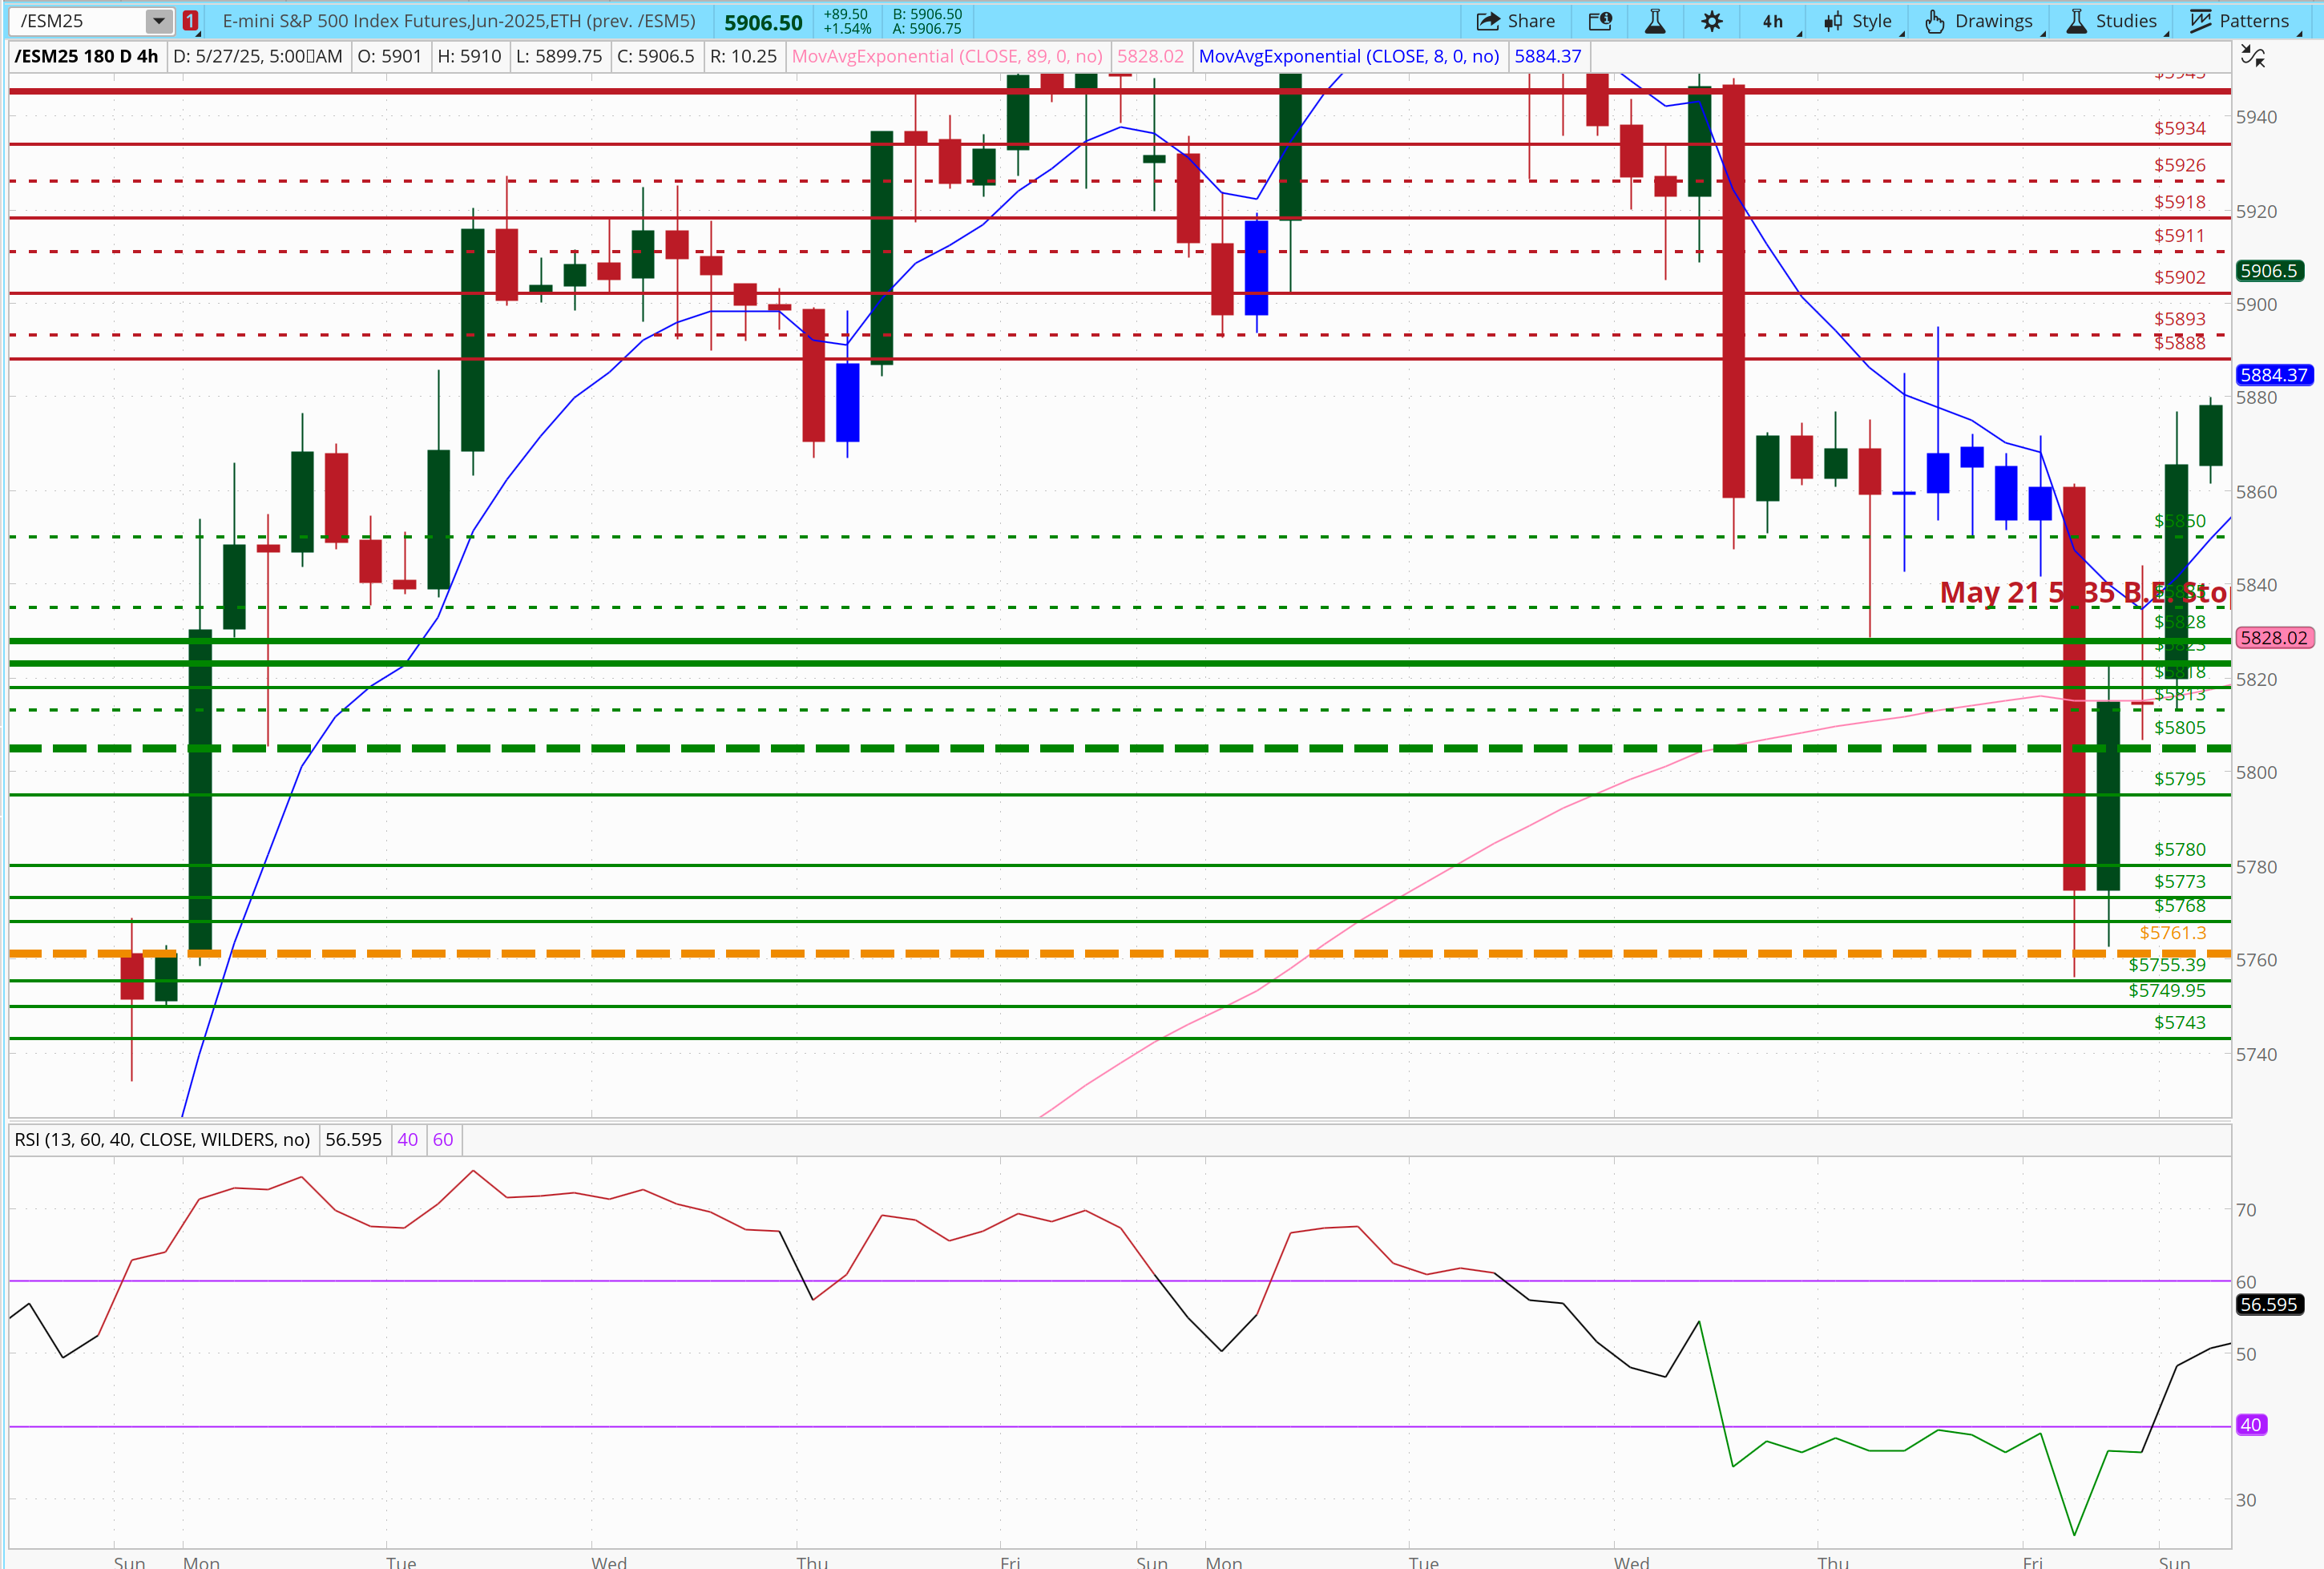
T4 is usually a CT/CB and typically not the same day, not ever almost. It’s usually done after we have a fleet movement in our direction and we come to the top or bottom of the curve and we’re having divergence opposite of price. On the long, we retraced the entire move back to 5840 by 1PM. I wasn’t going to sit through the long weekend with price hitting the selloff point. I took full position and left for the day.
The most important things are T1 and T2. The keep us green. It’s great to have days like May 22 and May 23rd where things scale quickly, but we need to remember…
The results are the results because of profit taking.
Profit taking is the predecessor to risk reduction.
Moral of the story - If we hit T1. We have a winner.
📊Trade Review — May 27, 2025 - 2 Trades
Trade Review May 27 - Trade #1 - FBD 5893
After the May 21 selloff and the retracement back to 5893, this level stood out as a Critical Reclaim Area. Between May 22 and May 26, 5893 acted as a clear CT — we tagged it five separate times and couldn’t push through… until we finally broke it in the early morning hours of Tuesday, May 27.
That reclaim at 3:00 AM on Tuesday made 5893 a textbook Failed Breakdown candidate on any retest. This was an area with memory — a level I’d take 10 out of 10 times if the structure looked like it did here.
Here’s the screen shot of the entire trade so you can follow along:
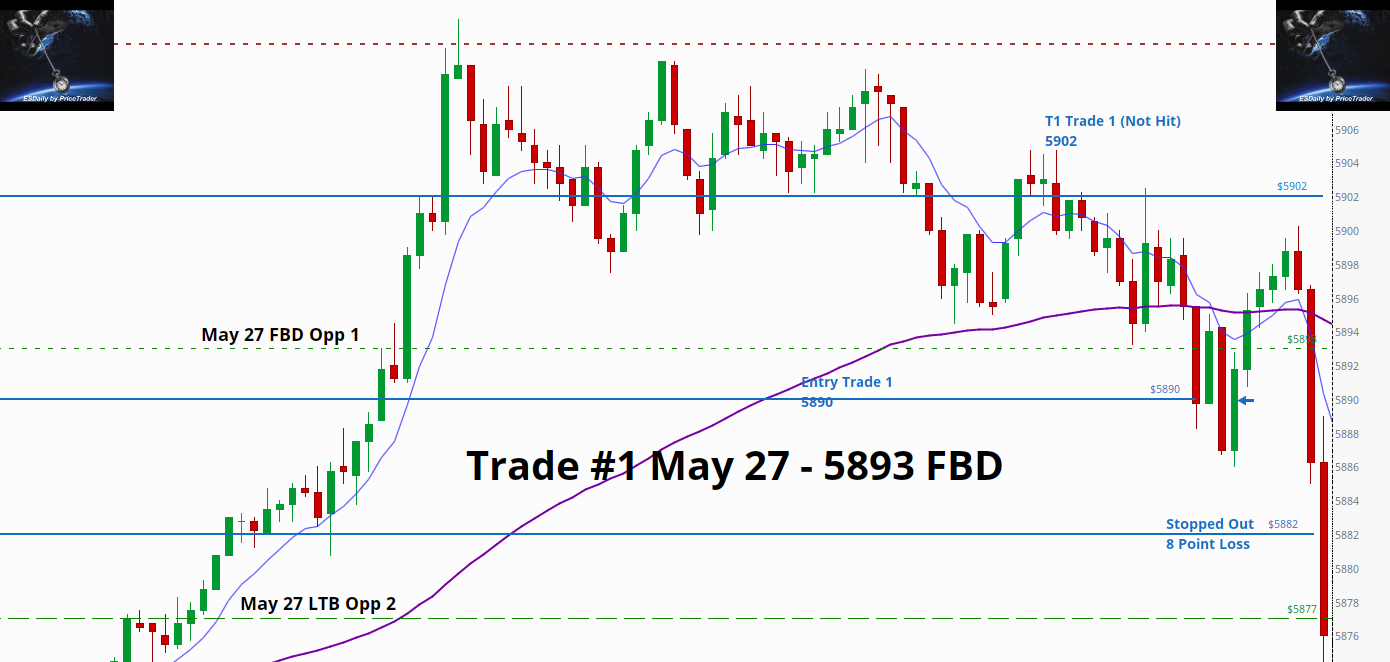
Here’s what happened on Trade #1:
I alerted on X at 7:05AM we were nearing the opportunity:

We got exactly what we were looking for and I updated X along the way:
Flush/Temporary low/
Short-term divergence came at 8:55AM.
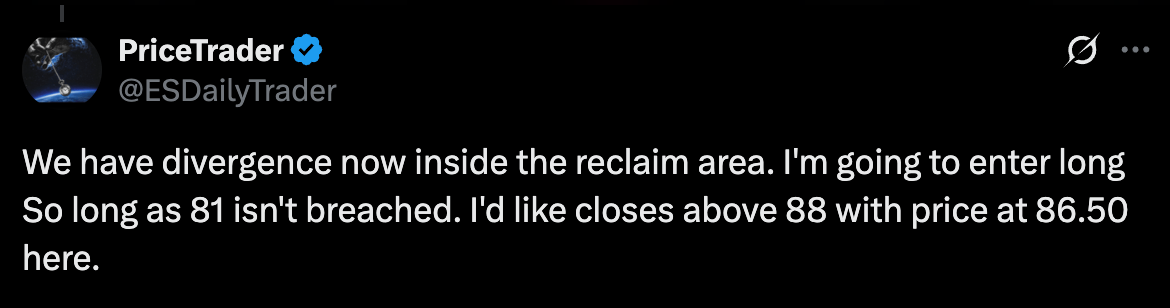
Reclaim candle at 8:56 AM
That was the trigger.
Entry (8:56 AM):
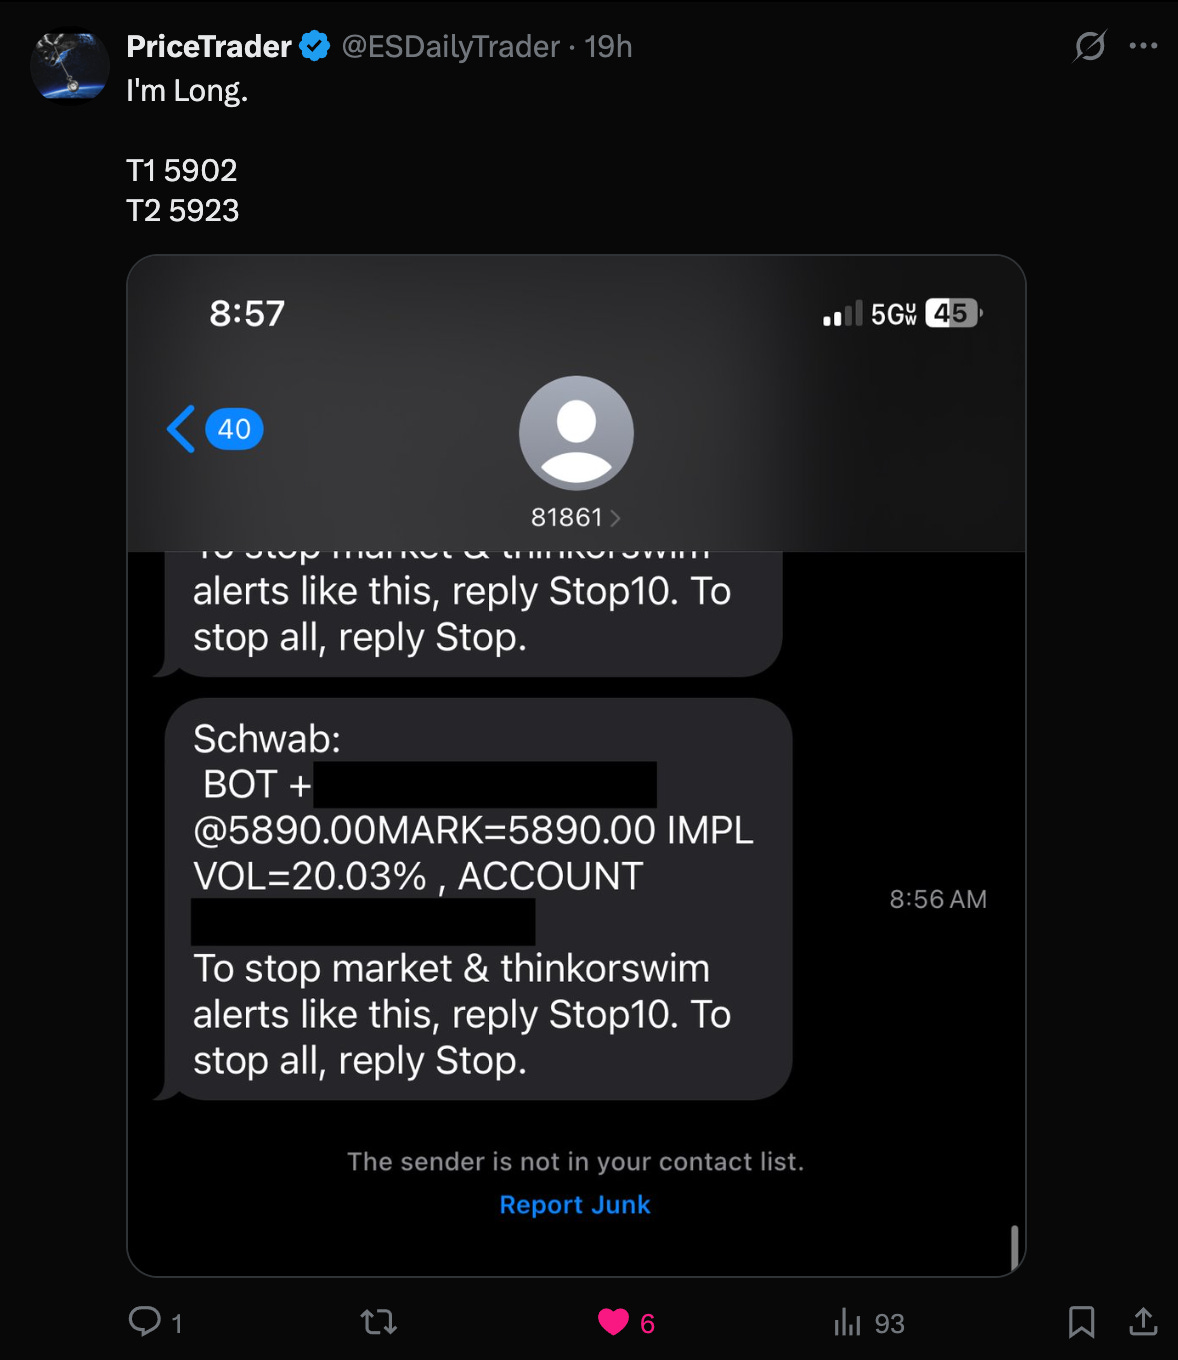
9:22 AM: Price pushes to 5900.25, just shy of our T1 = 5902
But that was it. Price couldn’t stick the move.
Structure didn’t hold. The reclaim was sold.Just before the bell, we saw price roll. It tried to find its footing right at the 9:30 open and failed hard. There was no absorption, no demand reclaim. Nothing to defend the bid.
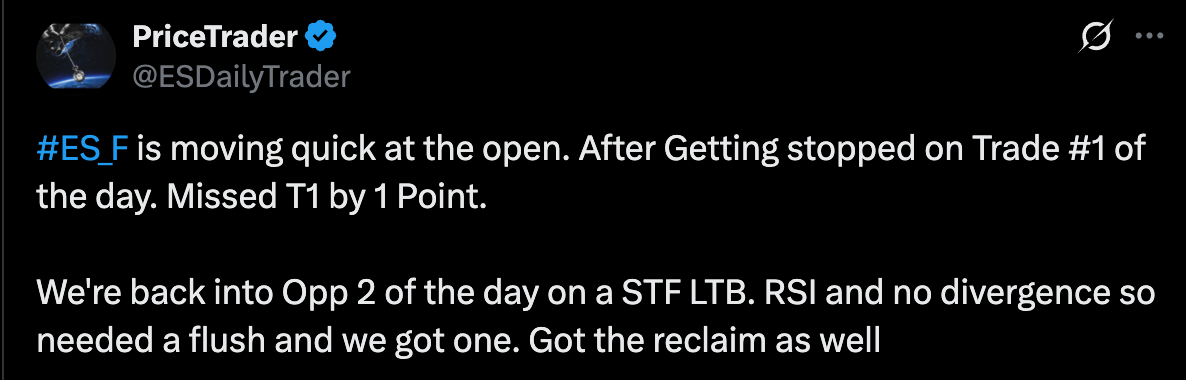
Bears won the 9:20 to 9:35 battle.
ES fell 31 points.
The tape told us everything we needed to know.
We listened.
We got out.Stop (9:31 AM) at 5882:
When price tells us to get out, we listen. Note: If there is one thing here that stands out it’s the 8:19AM candle. We marked 5893.25. then rallied to 5902.25 in the subsequent 2 minutes. Not a flush, not an acceptance. Just a pivot point. That’s not our trade. We trade when ES seeks liquidity and it does that by taking out critical areas.
Trade Review May 27 - Trade #2 - LTB + Flush 5877-5873
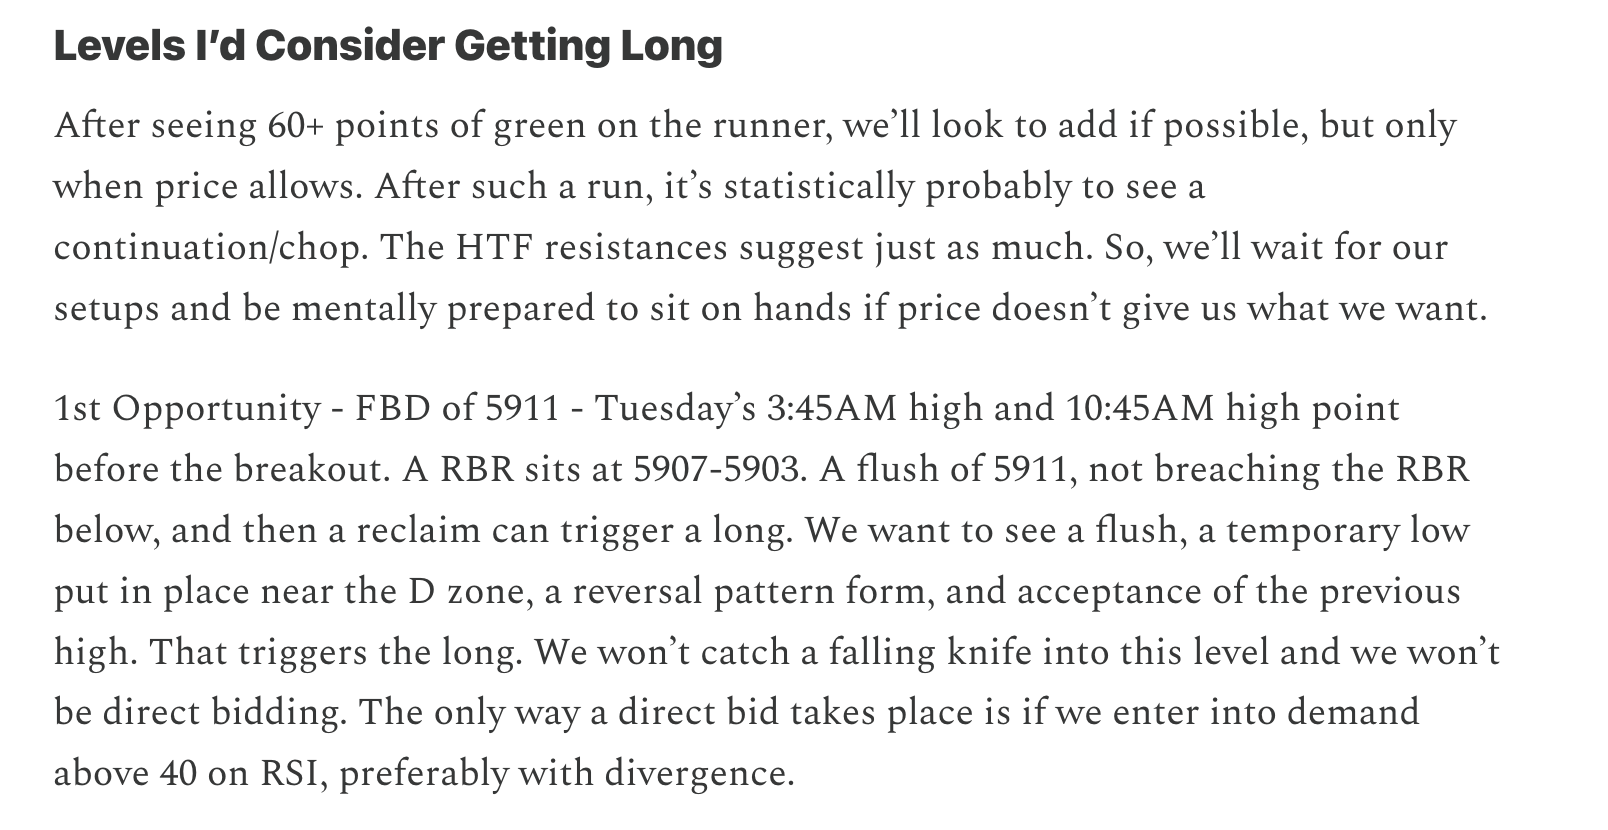
While Trade #1 stopped out, price kept pushing lower. I looked at the May 27 “5850 Failed and Reclaimed. What Now — Levels I’d Consider Getting Long” print out.
We were ready, newsletter printed out.
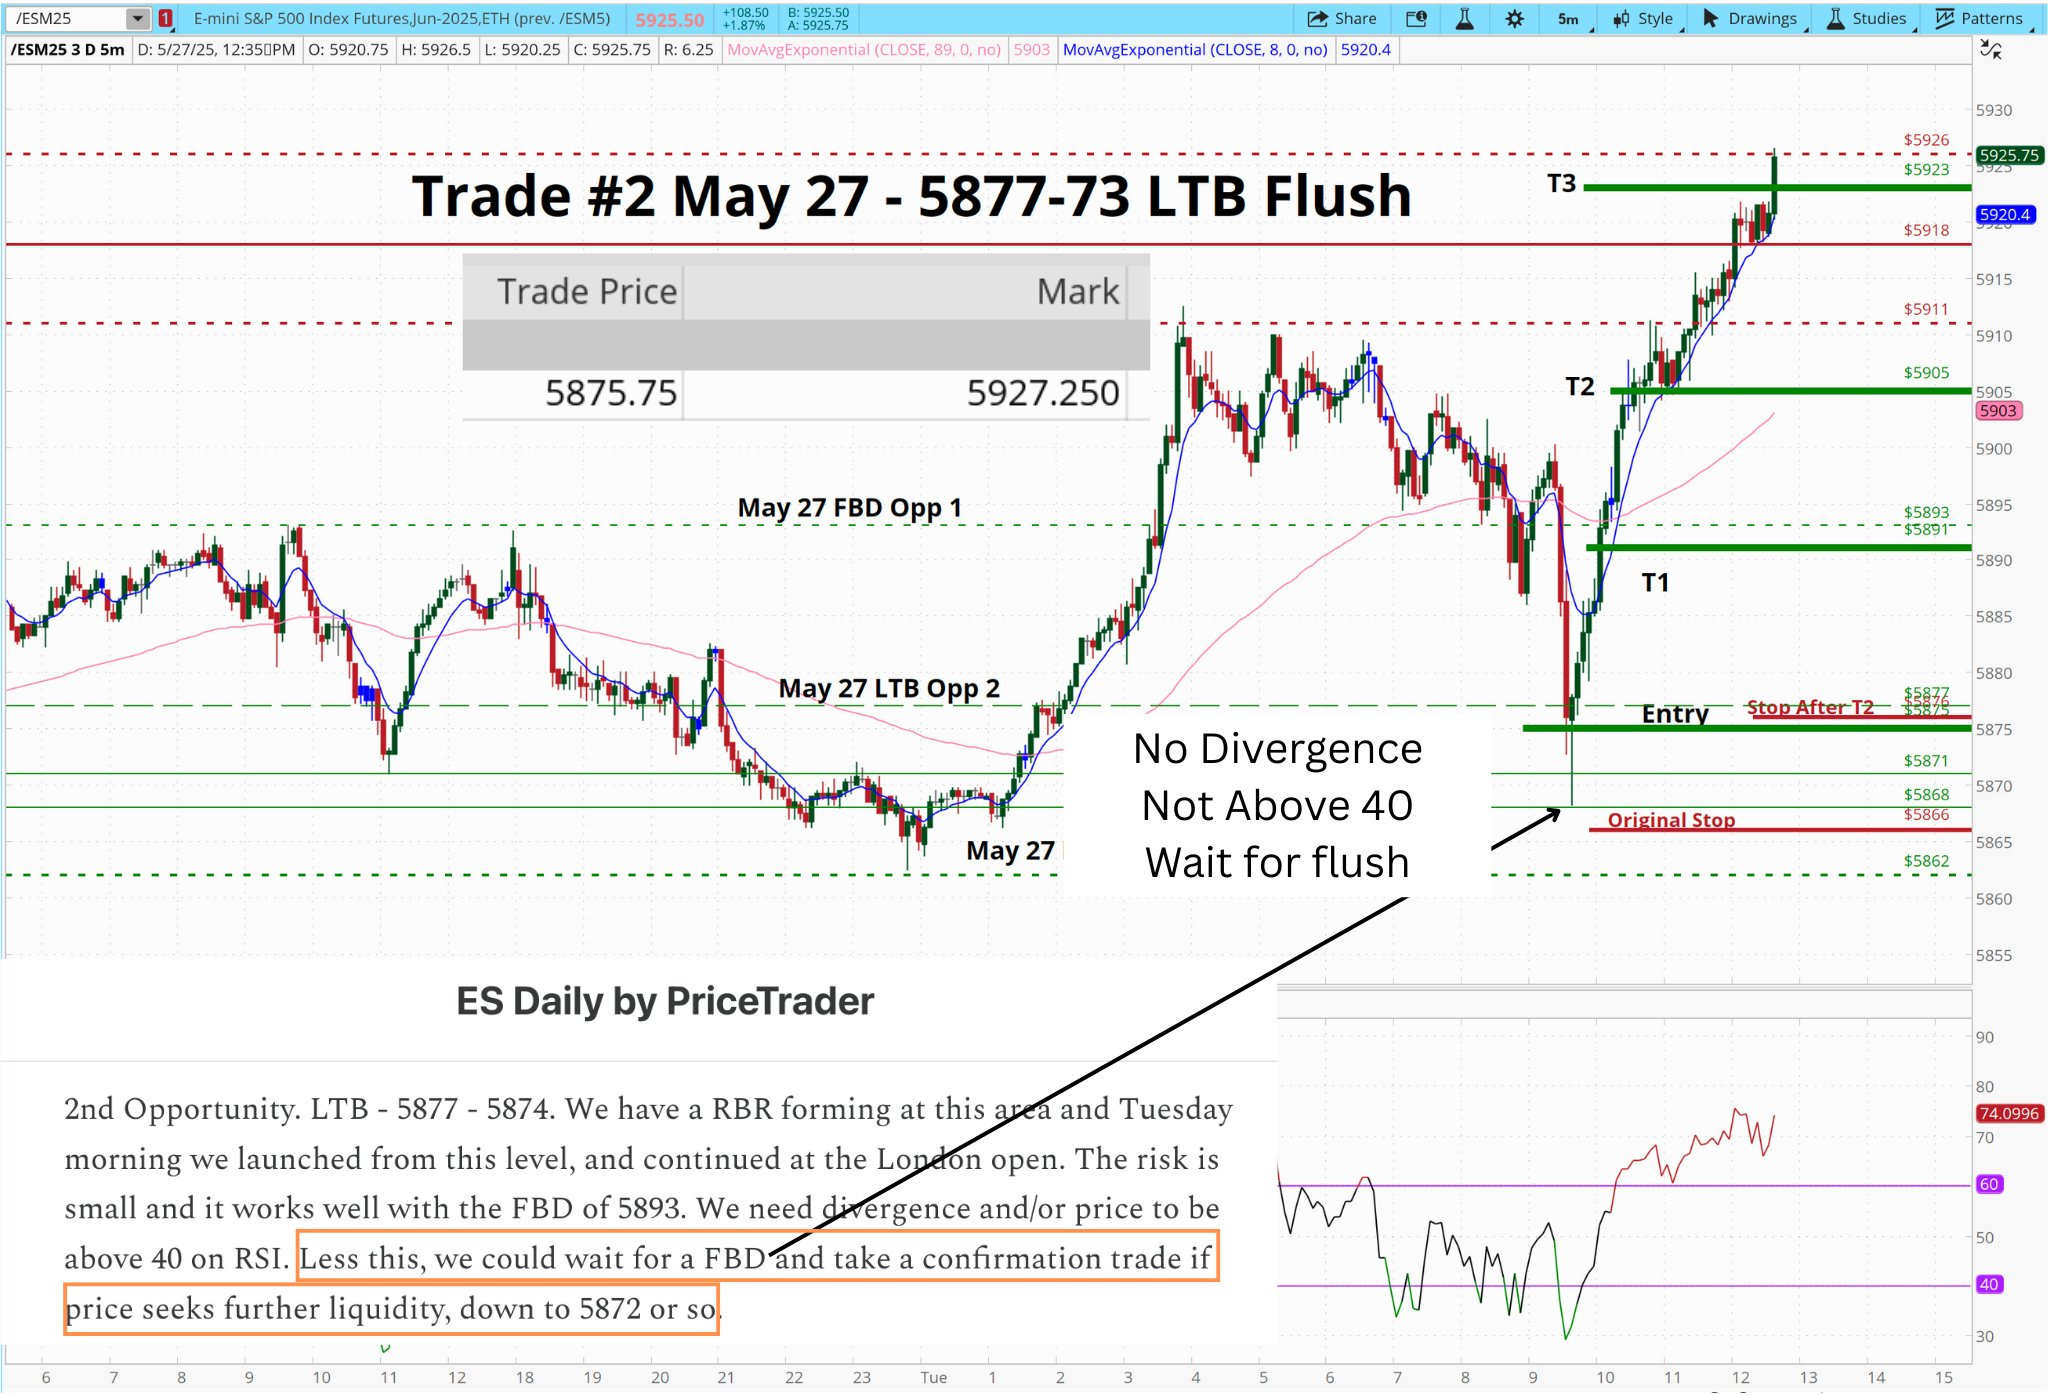
Alert setup on ThinkorSwim.We had this 5877–5873 LTB zone mapped out. It was a clean RBR from the prior London session, aligned with the 1-hour structure RTH May 22 close (before the gap down), and sat just above 5868, a newsletter-listed support level, a CA.
I wrote this in the May 27th letter and had it highlighted old school style with an actual highlighter😄:
2nd Opportunity. LTB - 5877 - 5874. We have a RBR forming at this area and Tuesday morning we launched from this level, and continued at the London open. The risk is small and it works well with the FBD of 5893. We need divergence and/or price to be above 40 on RSI. Less this, we could wait for a FBD and take a confirmation trade if price seeks further liquidity, down to 5872 or so.
When price entered into the level at 9:34 AM, RSI was under 40 and there was no divergence. That kept us out of a direct bid.
We waited.
Let price build. Let structure talk.And it did.
Price bottomed at 5868. Price reclaimed the top of the LTB (5877), which had just acted as resistance.
That was our signal and I announced on X.
ES reclaimed 5877 — I’m long 5875.75. Stop was 5862. Looking for 5891 / 5905 / 5923
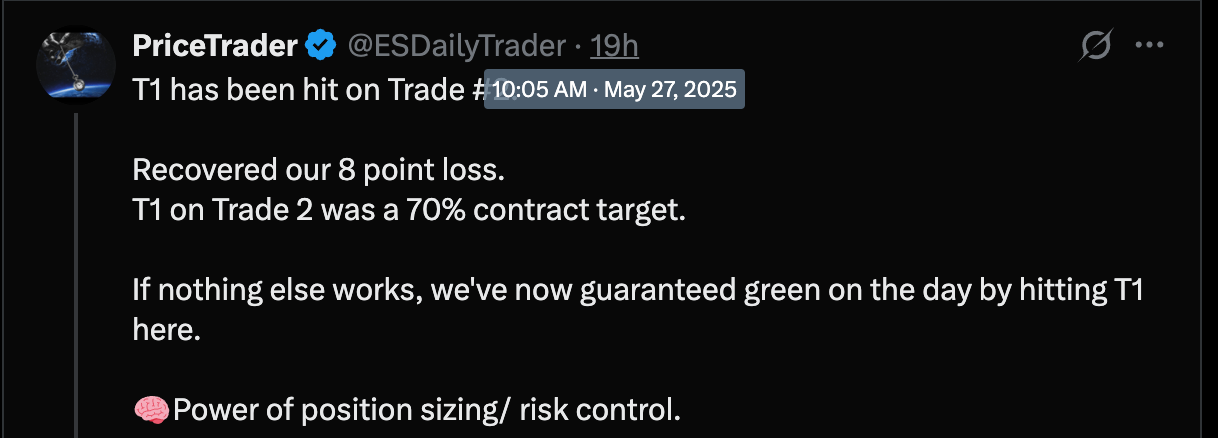
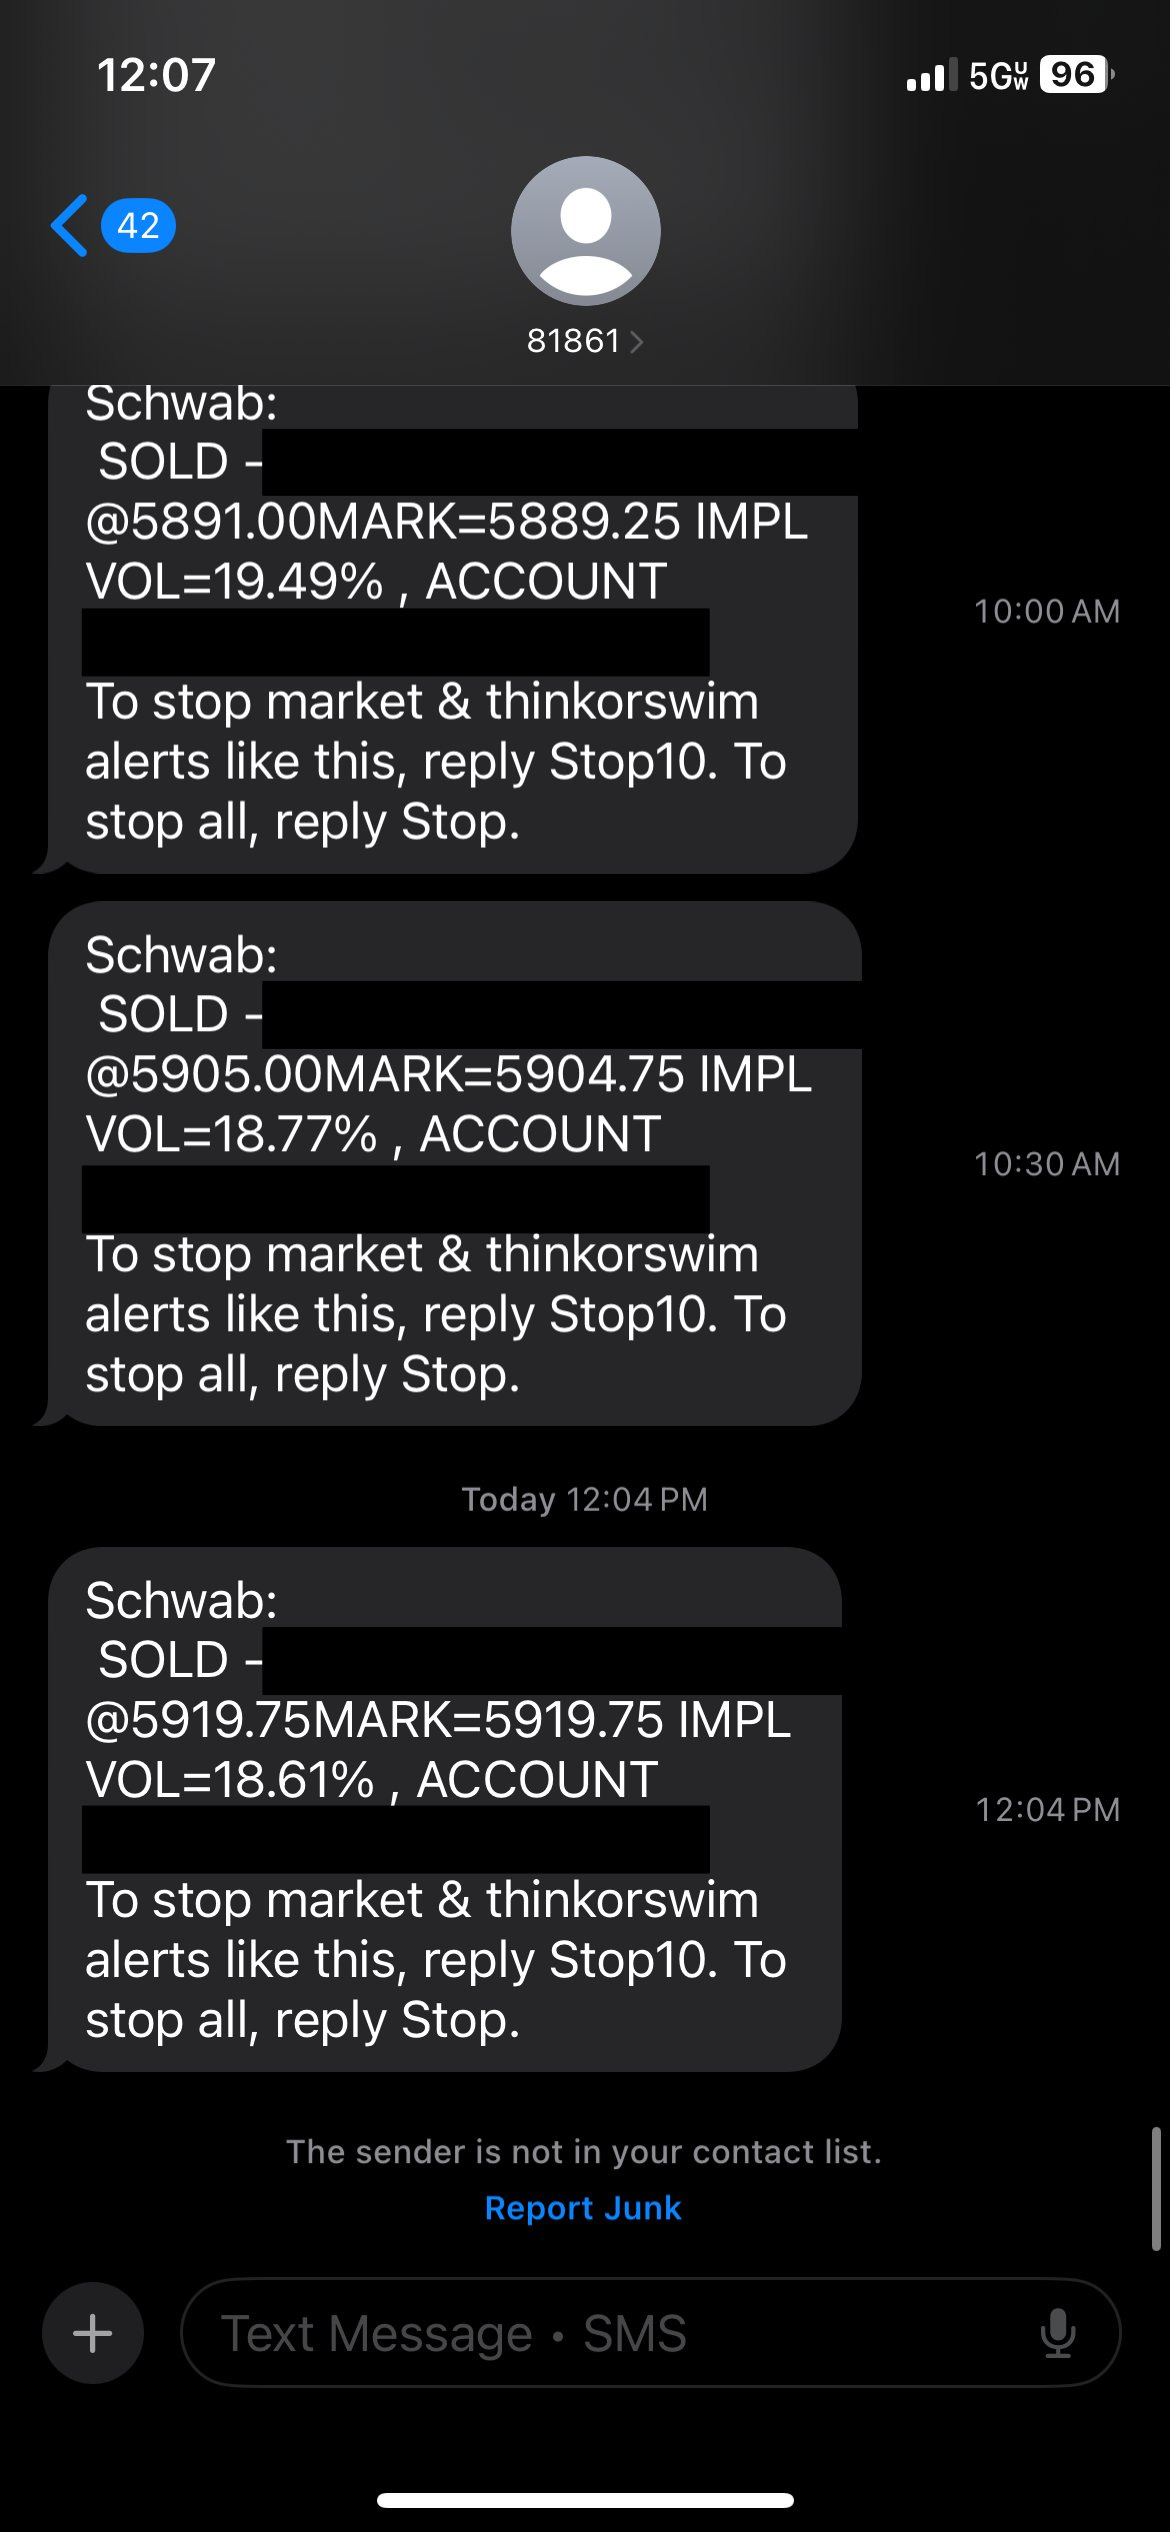
T1 Hit (5891) – 10:00 AM - Just below the 5893 reclaim (70%). While I hate mentioning this (this trade vs that trade), it’s a concrete fact: T1 being hit was a big deal for the daily P&L. We recovered the loss from earlier.
***Note: 8 full ES points (loss on Trade 1) Is Less Than 70% of 15.25 (T1 on Trade 2)***
If we turned, and stopped out — We still would’ve guaranteed a profit on the day.

T2 Hit (5905) – 10:30 AM - Next level up - Took another 10% and moved stop on the remaining 20% to breakeven (5876). Alerted here.

Price was definitively in the flow state at this point and there was nothing left for me to do as I packed my bags and got ready for the trip home.
From 10:30 to 12:42 we rallied 25 more points and before I closed the laptop I took T3 a bit early, as mentioned here on X.
T3 hit (5919.25) - 12:04AM - Original was 5923 which hit 12:37PM.
Result:
Full redemption after Trade #1
Three targets hit
10% runner still live
Risk-free green session, executed by the rules
Textbook setup. No emotion. Just structure, confirmation, and taking profits when they’re due — exactly how our profit-taking strategy is built.
No home run expectations.
Disciplined scaling. High-probability targets. Risk-free runners.
📊Trade Review — May 28, 2025 - 1 Trade
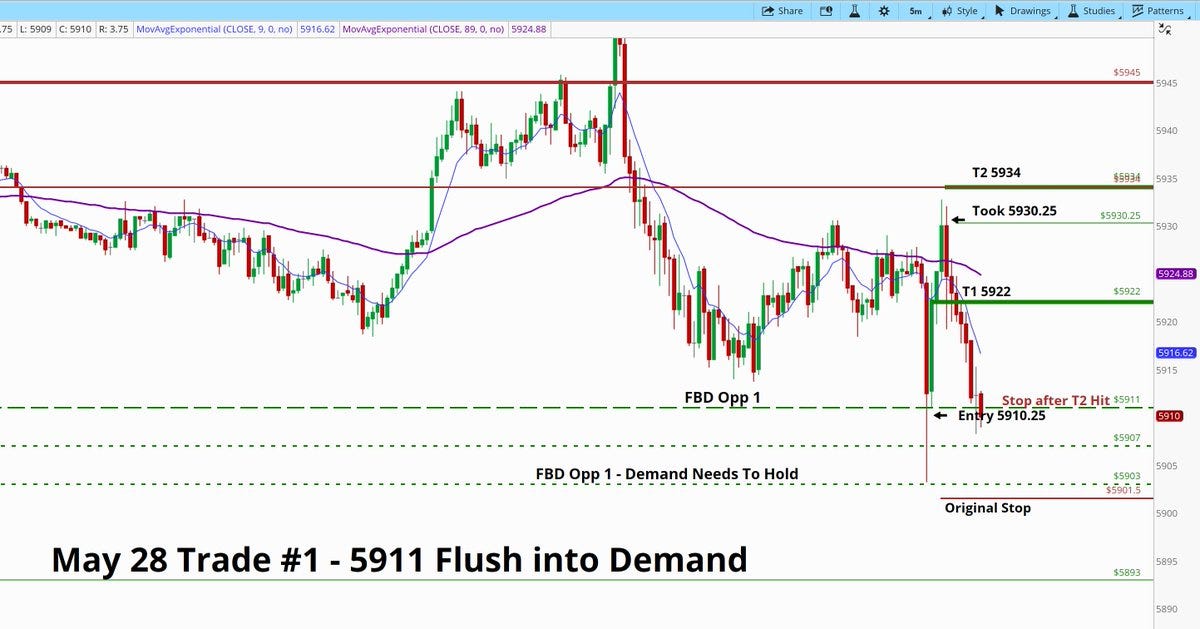
Trade Review May 28 - Trade #1 - FBD 5911 Into Demand
It was the first opportunity from the May 28 Gameplan:
“FBD of 5911 — flush, hold 5907–5903 RBR, reclaim → long.”
The setup never triggered in the morning. But it didn’t vanish.
It just waited.At 2:52 PM, price flushed into 5903.25, held the demand zone, and turned.
I wrote this exact setup in the May 28 letter “Two Setups, One Green Day”
That reclaim above 5911 was the cue.
I entered at 5910.25, stop placed just under the demand zone
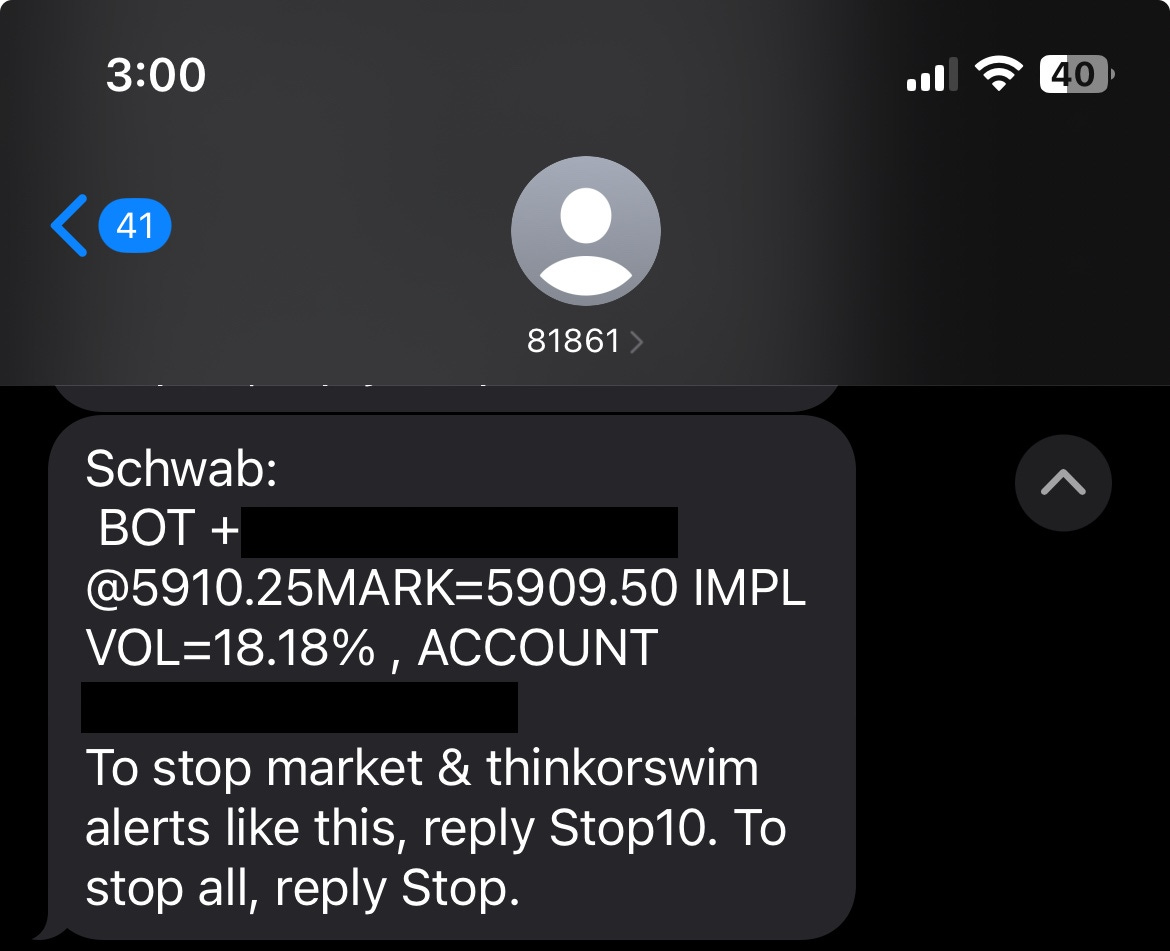
We hit T1 (with slippage) = 5922 almost instantly.
As always, we abide by our profit taking strategies and I took the majority of profits off at T1 - here 70%.
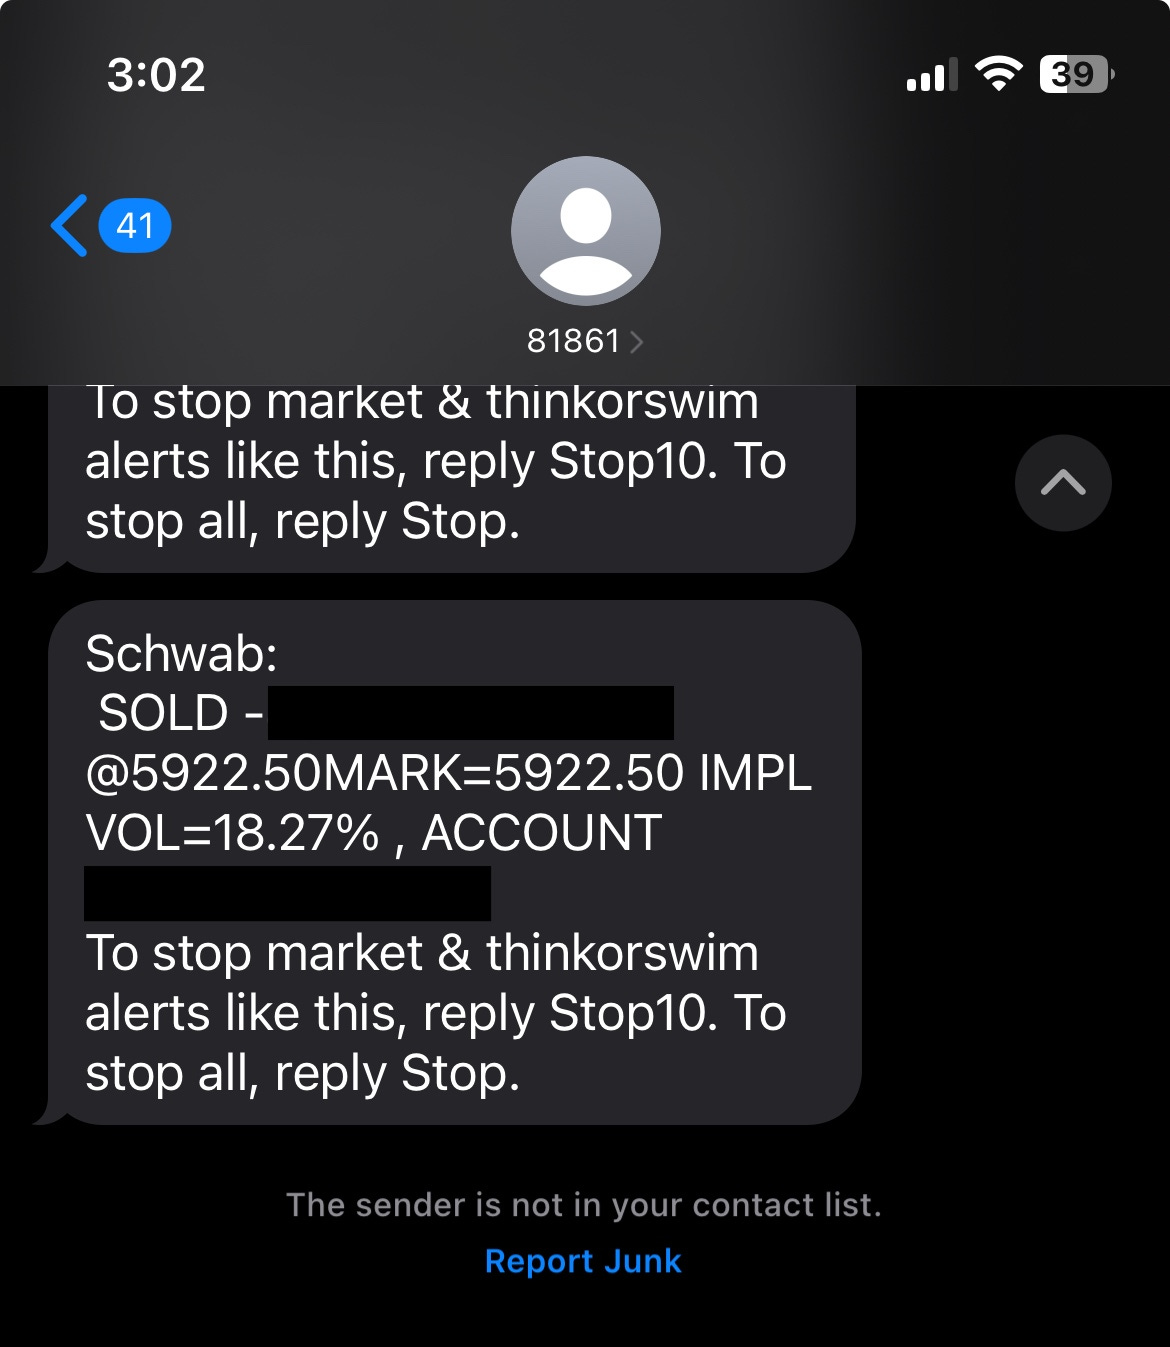
T2 = 5934 was planned — but I took it early at 5930.25 in risk protection mode. Another 20%. This left us with a 10% runner, adding to our 5875 long.
I wrote this on X:
T2 was taken at 5930.25 in a risk reduction effort. With less than 1 hr left in the day, back above range is going to be a challenge. We have another runner. Stop is BE

This, turned out to be the right move.
Price did a 180 on us after T2 was taken, and we sold off hard, stopping us out at breakeven.
I wrote this on X and it’s so important we abide by this, like a religion:
Within 40 minutes, T1 & T2 hit.
Price has done a 180 since then.
***Picture perfect example of why we focus on risk reduction & taking profits when they are due.
Don't swing for homeruns.
Swing for singles and doubles.
Swing for consistency.It was picture perfect.
The runner was stopped at breakeven — but that didn’t matter.
The trade did exactly what we mapped. That’s the win.
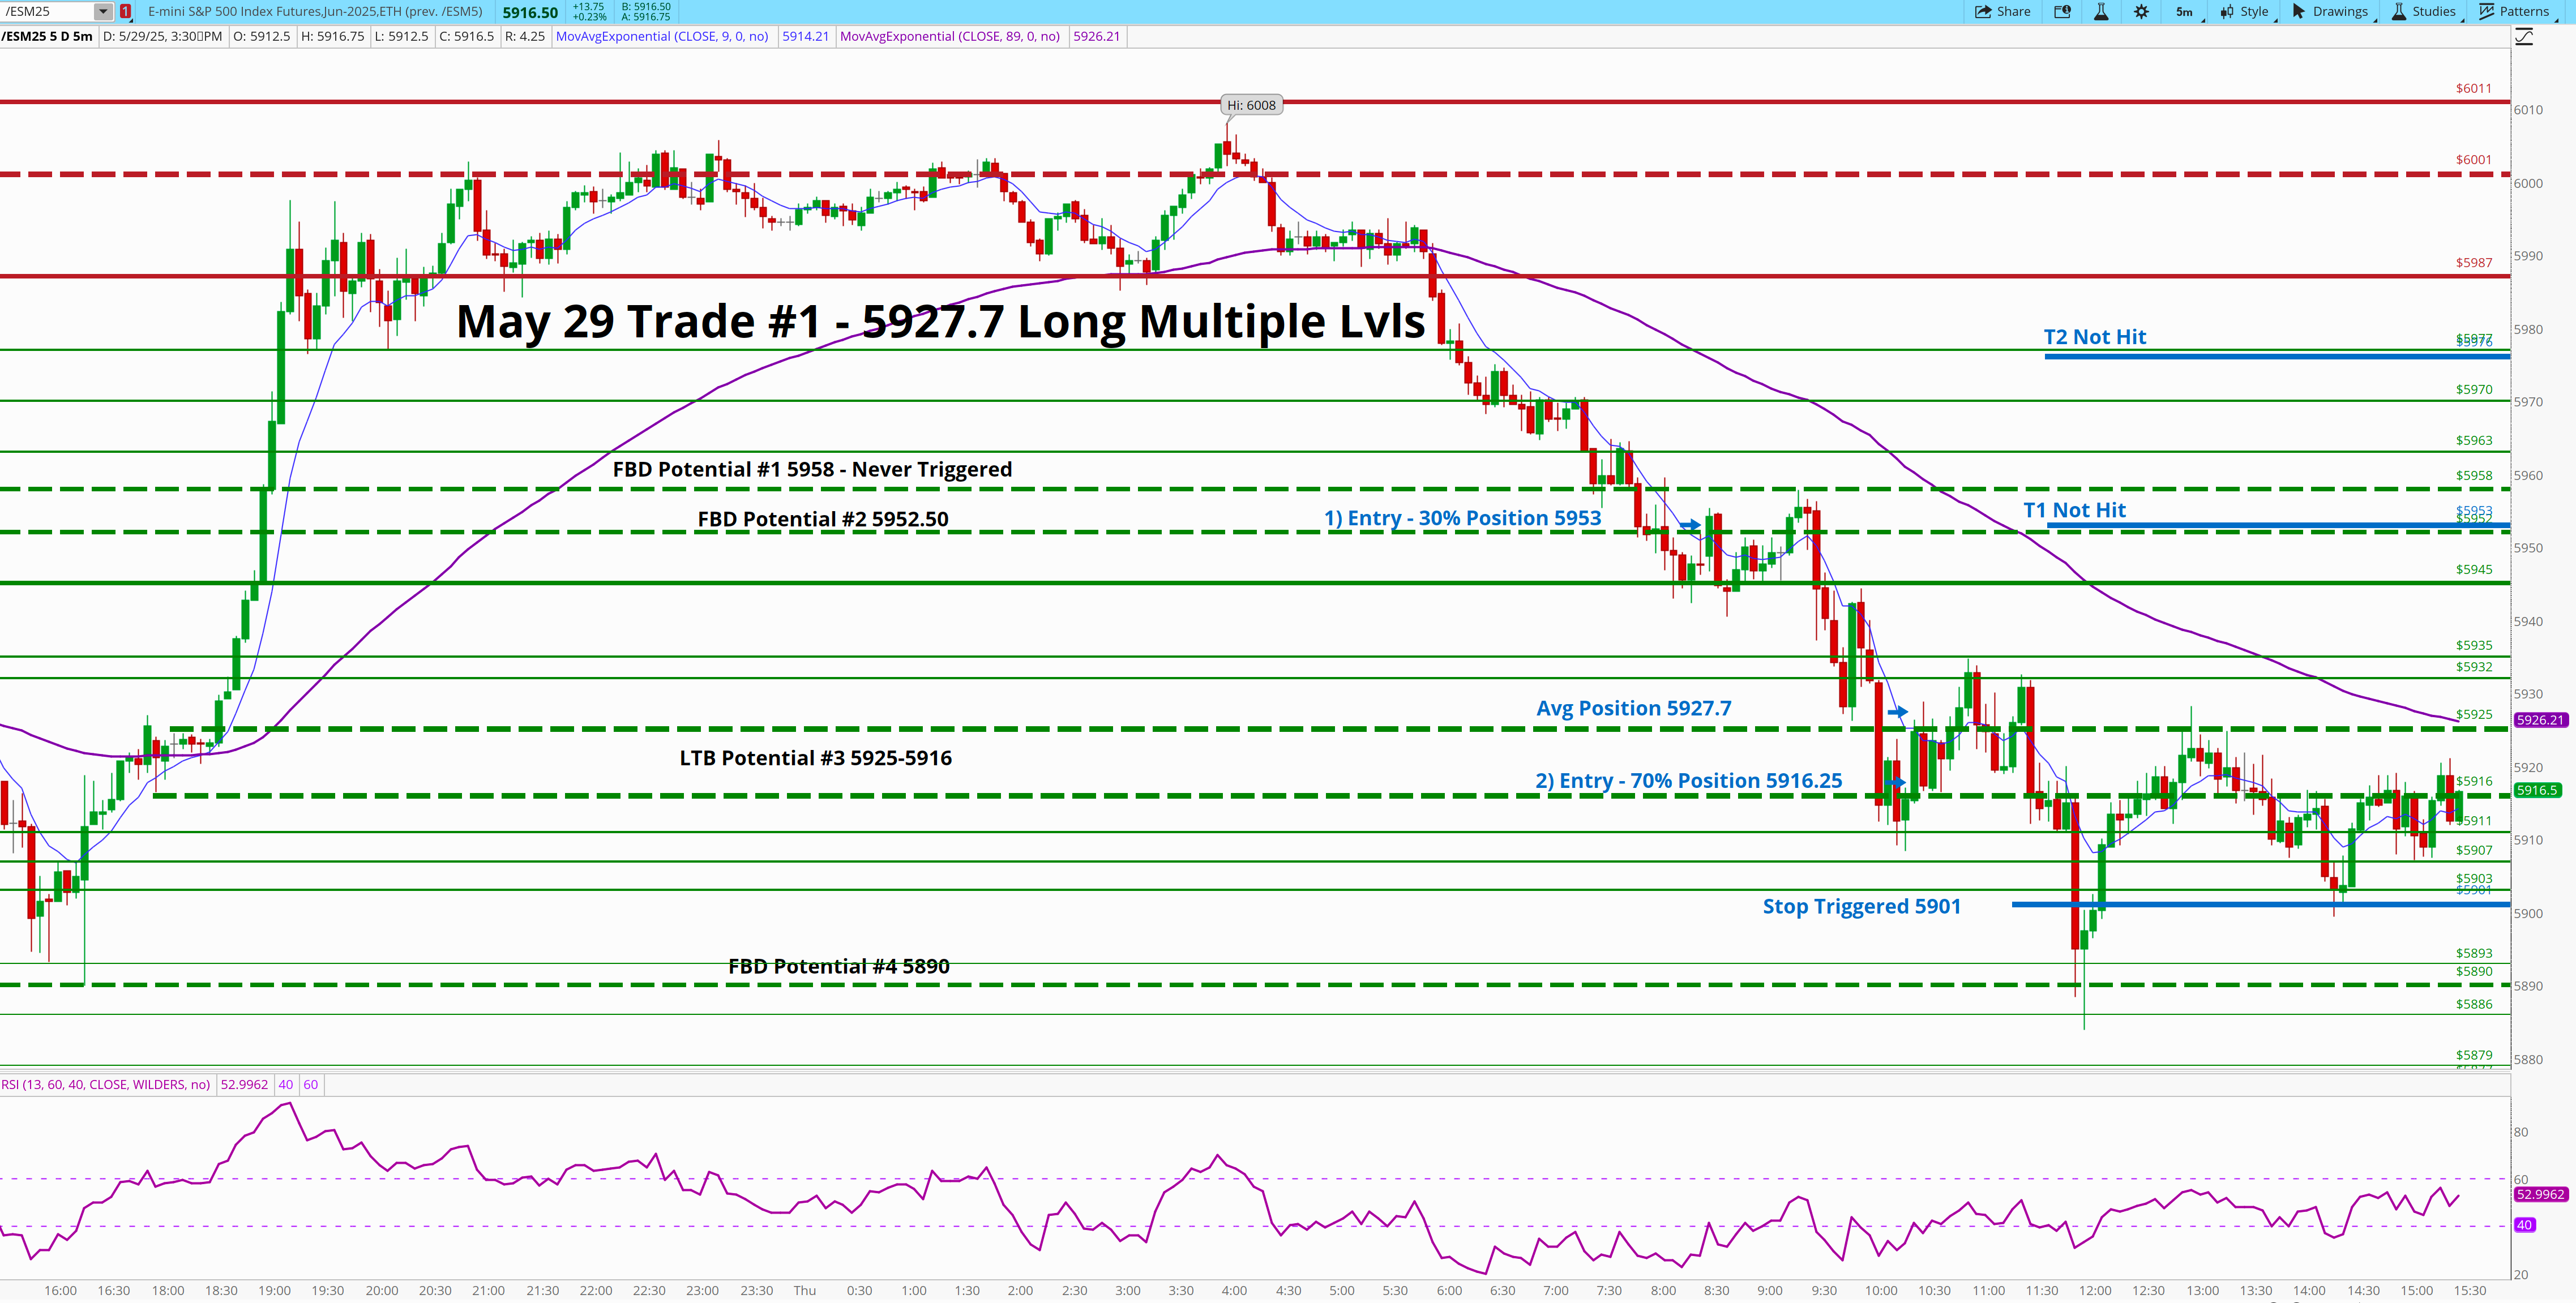
📊Thursday May 29 Trade Review - 2 Trades
Trade Review May 29 - Trade #1
The first trade came during the initial leg of the unwind — and it came fast.
After breaking 5952.50, price flushed deep into the next structural zone. I started building long at 5953 as part of FBD Opportunity #2, with divergence creeping in and structure beginning to show. I added size at 5916.25, where the LTB 5925–5916 zone was waiting — a higher timeframe level from the Gameplan.
“I have DCA’d the HTF demand listed in Opp #3 once reclaimed... Avg position to 5927.7... We are diverging in this selloff.”
— 10:23 AM on XMy average position was 5927.7, stop at 5901.
I was off desk at the time — managing via alerts — and while the structure initially held, the market never reclaimed 5935–5945. Buyers were present, but weak. And when 5911 gave way, the trade unraveled.
By 12:03 PM, I was out.
“I have been stopped out of this position. If we take out yesterday's lows, and go as low as 5880 and reclaim, that would trigger a 2nd trade.”
This wasn’t a chase — it was a structured build into mapped demand.
But it lacked confirmation. There was no reclaim. No strength behind the bid.
The plan was clean. The execution was disciplined. The trade didn’t work.And the next one was waiting.
Trade Review May 29 - Trade #2
Trade #1 never got going. I built into it structurally — partial entry at 5953, added at 5916.25, averaged at 5927.7 — but the market had no interest in reclaiming. It was clean in theory, but thin in follow-through. When 5911 cracked and 5901 hit, I was out.
That was the reset.
The second trade came where the first one couldn’t — from the flush we’d been waiting on all morning.
At 11:55 AM, the market finally did what it refused to earlier: flushed Wednesday’s low. A full 30-point capitulation candle cracked 5890 and bottomed at 5883.75. That was the tell.
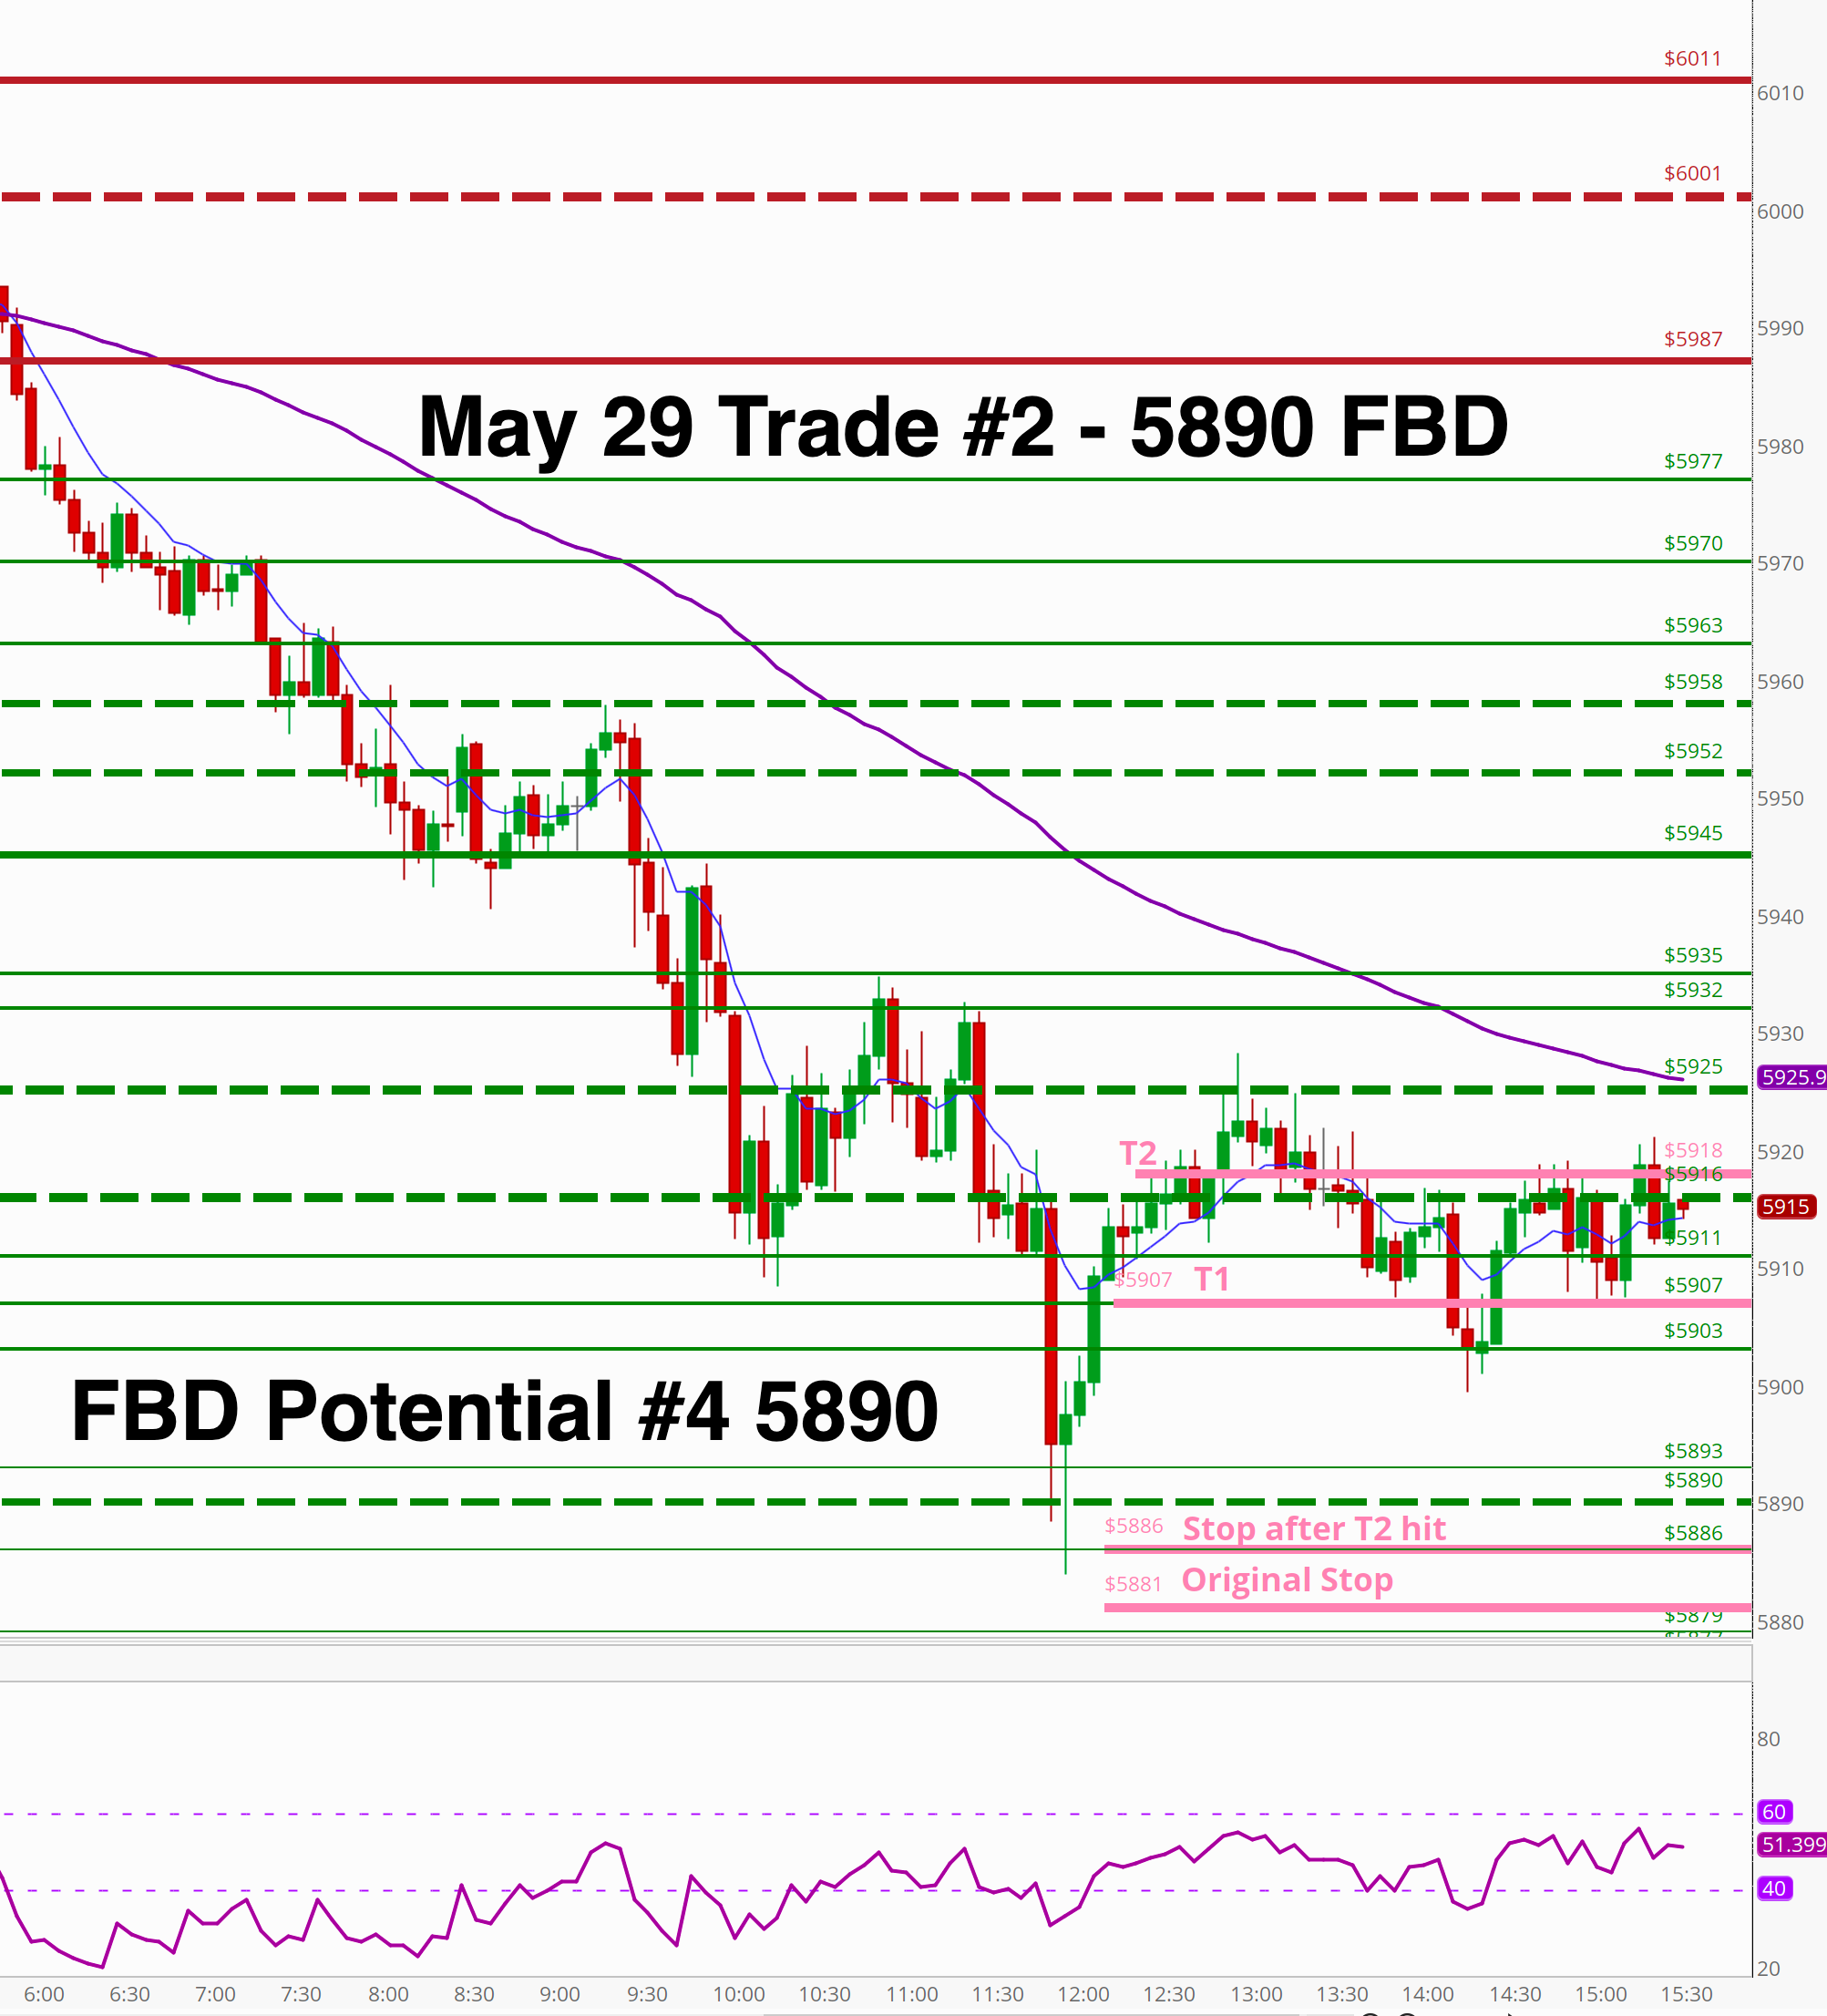
In a reply to a subscriber on X, I wrote:
“After a selloff like we had this AM, breaching multiple areas and really only offering one or two spots…
When we take out a critical area like yesterday’s low — it brings a capitulation.
This is a trap. A liquidity hunt by institutions.”This was that trap.
And nothing had changed from the morning plan. We’d mapped the setup:
“I’d consider longs on a break of yesterday’s low (5890) with a bottom preferred above 5880.”
We got exactly that. The flush came. The bottom held above the preferred level.
Divergence had been creeping in for hours — and now we had structure.Once price reclaimed 5886, I hit it and alerted on X: long at 5885.
“Entry 5885. T1 = 5906. T2 = 5918.”
— 12:13 PM on XT1 came fast. 70% off at 5906.
T2 came later at 5918. Another 20% off.
I held the final 10% as a runner into the afternoon.
***We’ve been stopped out of this trade as of AM Friday May 30***None of this worked because I guessed.
It worked because we waited.
🧠A note on Trading Psychology
Each trade stands alone.
The first one was fine — it just didn’t follow through.
The second worked because I didn’t drag any baggage into it.If I don’t treat each setup in isolation, I start doing dumb things — skipping exits, forcing holds, chasing what I missed.
We must treat each trade as an isolated event. Less this, we turn into “I need to make it back” traders.
This is a very dangerous mindset, and one that I am always aware of.
Want to know what I do?
I do not look at ES P&L until end of day. I do not know the exact dollar amount lost or sold on each target hit or each stop out I take. I focus on the chart. At the end of the day, I can look. My job in the meantime is to execute - not count the money.
I know the account value and the size of the positions I should take and I execute trades accordingly. I know, every ES contract I buy, could go. And while I don’t like it, I accept it. That’s a muscle that takes time to build.
Try it. Don’t look at the P&L. Instead, focus on the chart. See what happens :)
This was the opposite of that.
This was the plan showing up — and us stepping into it.I started May 29 letter with this. It remained a cornerstone idea heading into Thursday.
Liquidity Comes First
After 10,000+ hours trading ES, one thing has always proven true:
ES seeks liquidity before it moves.
I talk about it constantly — because it matters.
In nearly every letter, and especially in the Core Strategy, I outline it clearly:“Failed breakdowns represent ES seeking liquidity, flushing support, wiping out retail, running into demand, reclaiming initial support, and getting retail chasing back in.”
“Failed breakdowns are a core component of ES. ES is the most widely used financial instrument in the world — and by nature, it seeks liquidity.”
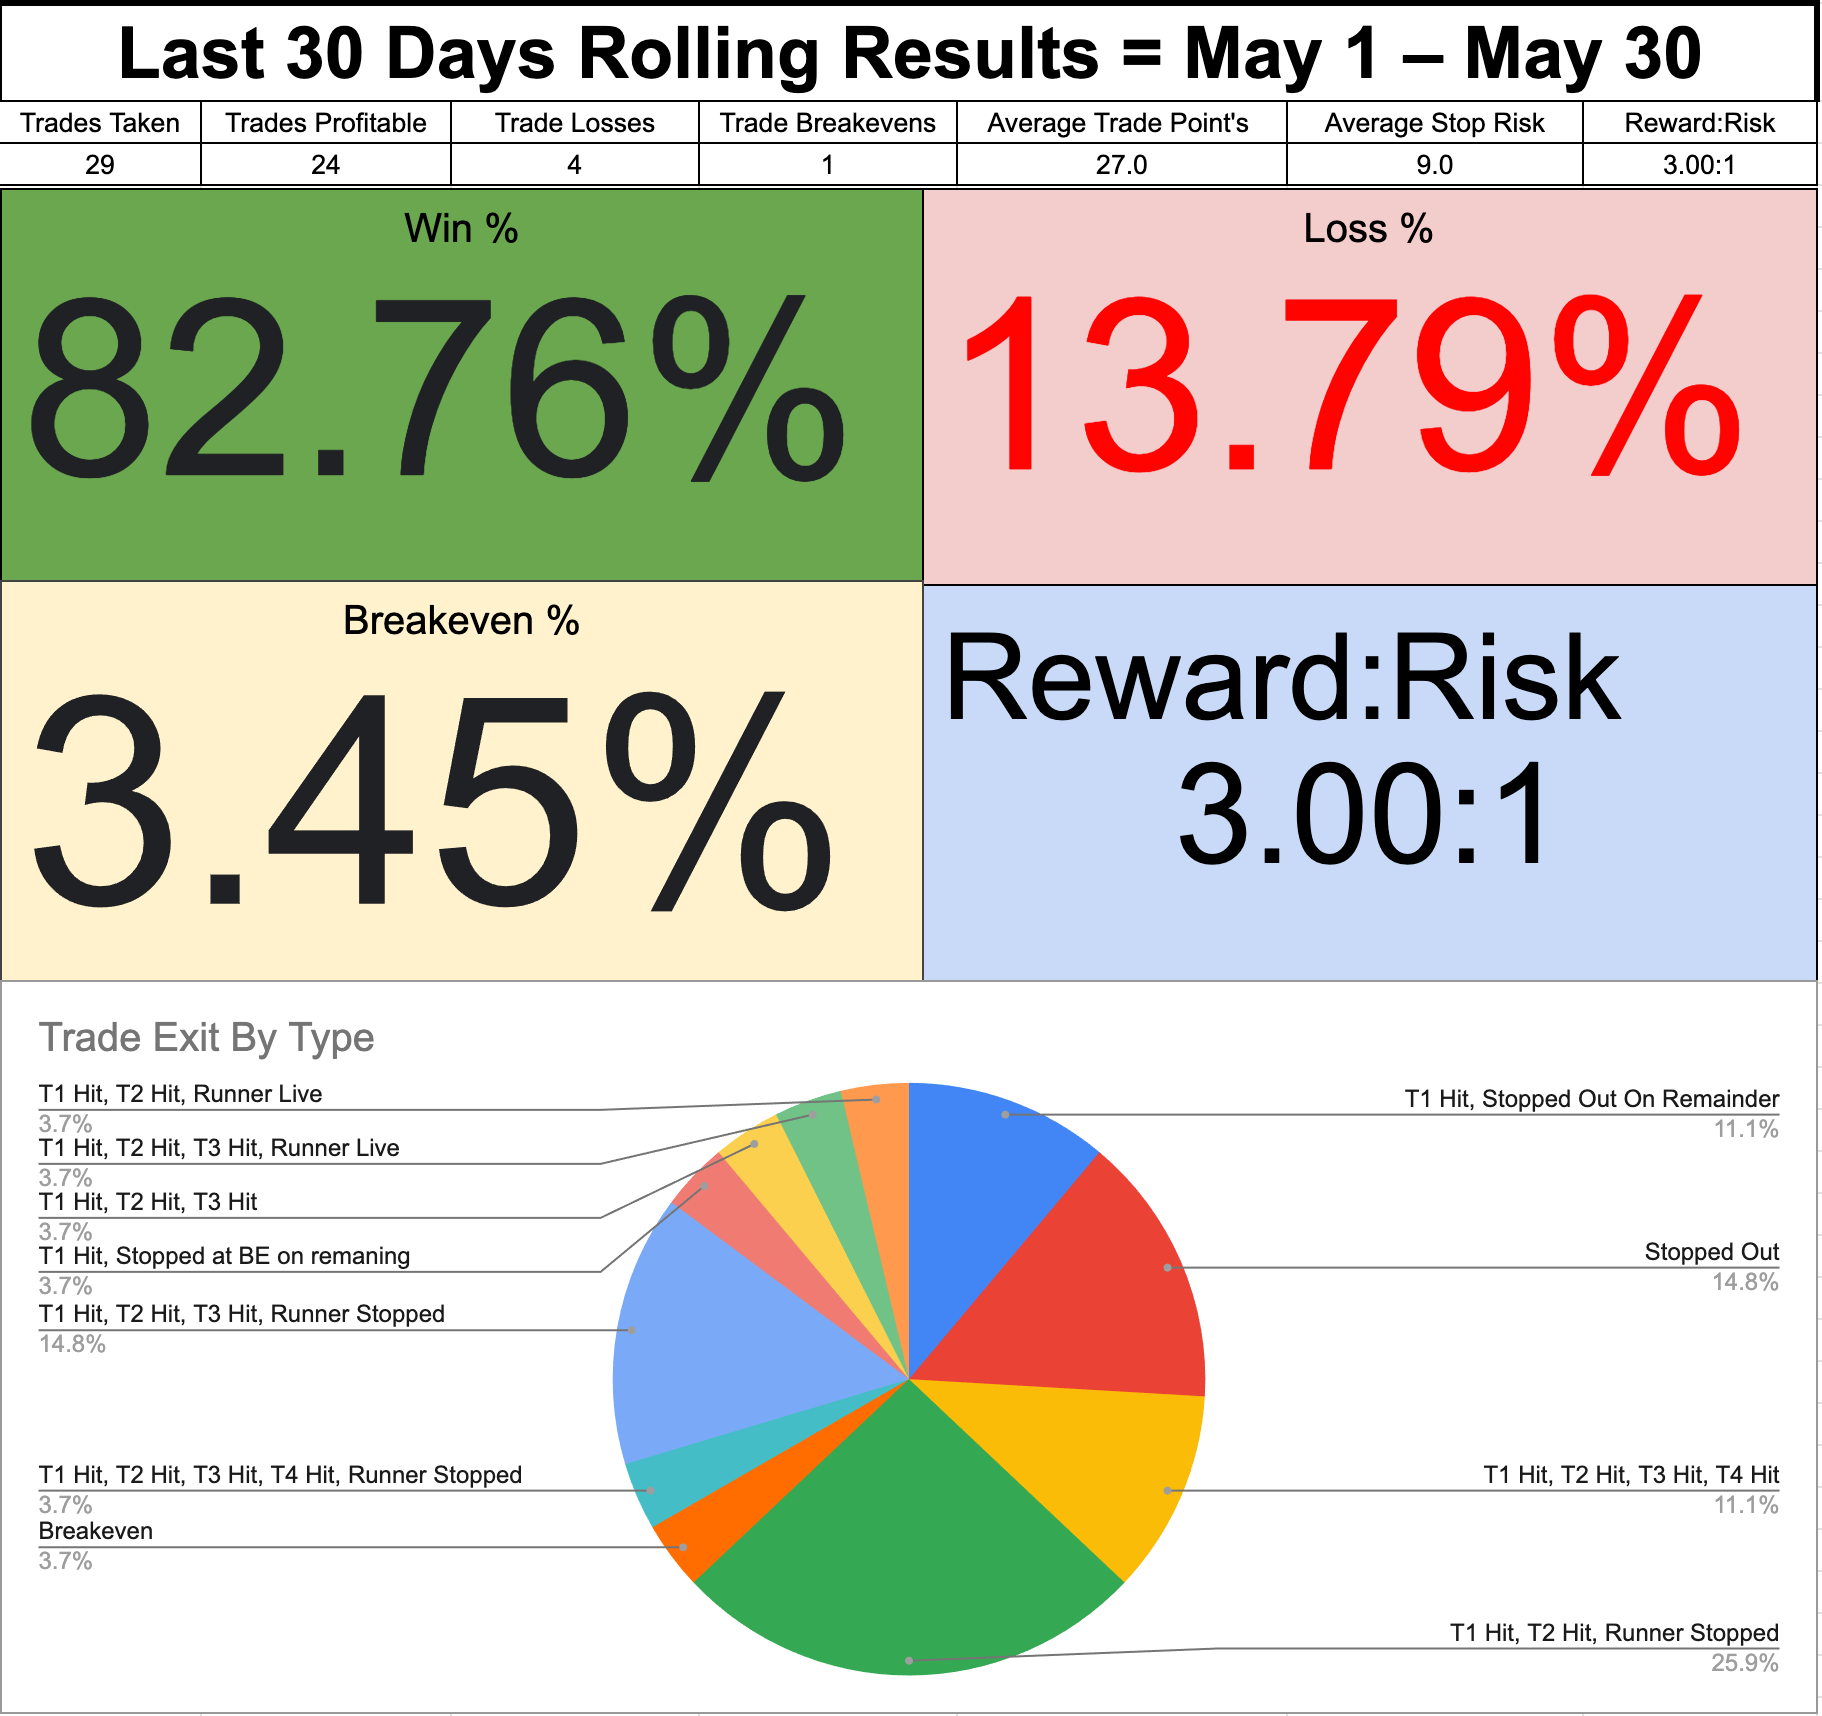
🏆ESDaily Scoreboard
Note: The ESDaily Scoreboard was created to offer accountability for subscribers following the trade ideas shared here. All trades reflected in this scoreboard have been identified before they happen, documented in the newsletter or updated on X as the day evolves — posted publicly at @ESDailyTrader. The Scoreboard operates on a 30-day rolling cycle and includes only trade ideas from the most recent 30 calendar days. The scoreboard assumes a scaling profit-taking method, where targets represent the percent of total contracts allocated per trade. Not all targets carry equal size. In the event of a full stop-out, the loss is applied across all contracts taken.
Disclaimer: ESDaily and its owners are not registered financial advisors or broker-dealers. The information provided is for educational and informational purposes only and should not be construed as investment advice or a recommendation to buy or sell any financial instrument. All trading involves risk. You are solely responsible for your own investment decisions. Past performance is not indicative of future results.
🧠Why Does ESDaily Strategy Work?
You can see all the different types of trades we take.
Are they all home runs? No.
Are they all perfect? Definitely not.
But our win rate stays high because we stick to our rules—tight risk, smart profit-taking. That’s what keeps us green.
If T1 hits and we stop out after? We’re still profitable.
If T1 and T2 hit? We move the stop to breakeven and let a runner work.
If T1, T2, and T3 all hit? That’s a big win—and we’re still in if ES wants to push.We always leave a runner. The runner is the unlock.
It reduces FOMO.
It keeps us mentally level.
It frees us from trying to nail the top.
Because we’re already in.We take most off at T1, and we stay patient, ready to build back in as the tape develops.
🧠That’s the key: we’re not chasing the whole pie—
just a clean slice.
We need to take a PIECE of the action, not get all of it.
…Remember, we may just be provided 1 or 2 great opportunities a day. We don’t need multiple.
If we nail it, cool.
If we miss it, cool.Our job is to identify opportunities before they happen, and then execute.
🔑🧾Key Level Codes -
Demand (D)- A high-quality institutional zone where aggressive buying significantly outweighs selling, often leading to strong upward moves that follow thru.
Supply (S) - A high-quality institutional zone where aggressive selling significantly outweighs buying, often leading to strong downward moves that follow thru.Critical Area (CA) - A key level where often support becomes resistance or vis versa
Critical Reclaim Area (CRA)- Not to be confused with CA, CRA is key level where, if reclaimed by bulls or bears, momentum shifts decisively in their favor, often confirming direction with stronger conviction.Level Track-Back (LTB) - A key level price may revisit before continuation
Failed Breakdown (FBD) - When price breaks below support but quickly reclaims it, trapping shorts and often fueling a move higher.
Failed Breakout (FBO) – When price breaks above resistance but quickly falls back below, trapping longs and often triggering a move lower.Channel Top (CT) - The upper boundary of recent price. Often acting as resistance.
Channel Bottom (CB) – The lower boundary of recent price. Often acting as support.Breakdown (BD) – When price falls below a key level with momentum and room to run, signaling potential continuation lower.
Breakout (BO) – When price pushes above a key level with momentum and room to run, signaling potential continuation higher.For added confluence, please refer to the Core Strategy and Odds Enhancers
The Next Piece – Monday June 2 Opportunities
Below are ES levels I’m watching for June 2 with price at 5890
Important Note: In 94% of trading sessions, ES moves less than 2%. Prices below are reference points on the chart I am watching as likely bouncing/turning points for price within a 2% range of price at the time of writing. Not all supports and resistances are “engage-able”. There’s a time to engage, and a time to watch. I do not buy/sell these. I’m tracking, taking profits, and using them as confluence to trade ideas.
Likely Supports For 6/2 are: 5872, 5866, 5859, 5854, 5849, 5843(CRA), 5836, 5826, 5820, 5818-5807 (D&CRA), 5796, 5785, 5773, 5755(CRA)
Likely Resistances For 6/2 are: 5890-5893, 5898, 5906 (CRA), 5914(S), 5924, 5933 (CRA), 5945, 5958(CA), 5952(S), 5964(S), 5970, 5977 (CRA), 5988-5995(S), 6001, 6008 (CRA/CT), 6011, 6023 (CRA)
📈Levels I’d Consider Getting Long
Runner is active from 5860, we can look to add if the weakness from yesterday continues or we break to the upside with force. But nothing to do in chop. Do not overtrade. Caution. The trend is suspect and we have no great setups in this 5890 - 5930 chop zone. We need price to move today to find opportunities. Less this, we would be taking less than Grade A+, and we don’t want to do that. No rush, it’s the start of a week and we want to start our week with a clear head and good levels.
📈1st Opportunity - FBD of 5843 - Untested Support and Resistance flip from May 23rd and right below the obvious 5854 low of Friday. A lot of traders are going to take a breakdown of 5854 and I prefer to go a bit lower to this CRA if selling picks up. I’d consider getting long here as long as the flush doesn’t go beyond 5826, I’d prefer a low of 5836 initially. Flush → reversal → acceptance. Divergence into this flush would be a big benefactor. A bid at 5849, back to 5854 and a hard sell below into the high 30’s. There’s no reason to take it early, no reason to knife catch.
📈2nd Opportunity - LTB/FBD - 5818-5807 (D&CRA). If 5843 goes, there’s a lot of room underneath → Gap closure of May 23rd. We have a strong DBR forming at this area during Friday/Sunday time period. We we’ll want to see RSI above 40 if we enter here (which isn’t likely on a large scale sale), or a momentum shift as price enters into the zone — Taking a confirmation trade. Price comes into level, forms a reversal pattern, and we take it as price leaves the level. If that doesn’t happen, this can turn into a FBD where I’d want price to go no lower than 5794, before considering the reclaim.
📈3rd Opportunity - CRA - 5933. The trend is suspect and we have no great setups in this 5890 - 5930 chop zone. If price respects the 5866 support and we move back up, a strong bullish push would take place between there and 5933. But that’s the BO point bulls need to gather momentum to the upside. RSI would be on our side, and we’d be above the 89 EMA. It would bring buyers so we’d want to ensure we’re not looking at a trap. Above, 5945 offers supply and we have layered supply through 5977. We’d be taking profits at the next level up, not shooting for homeruns. 5942/5951/5963 are the “would be targets” - likely. I’d be adding a small position here to the runner if the setup comes in strong. ES likes to fill gaps (~5913) and if this one fills and goes, we could see swift movement to this opportunity.
Again, I won’t be buying knives.
I’ll wait to be told.
If something develops according to my rules, I’ll take it.
📉Levels I’d Consider Getting Short
Price is in chop. The trend is sideways -It looks very ugly on the 1 hr chart with lots of wicks. And when that happens, if I trade, I prefer to stick to longs.
-There are no clear shorts available for our gameplan. That doesn’t mean I’m an ultra-bull. It means I respect the trend, I respect the chop, and there aren’t clear Grade A+ levels.
✍️📋 Today’s plan. Simple:
No trade in the chop. Hold Runners. Wait for volatility to bring liquidity or wait for a BO of the range. We have our runner positioned long from below. We prefer to be buyers at the Long Opps above, but only if price gets out of sideways chop. If price comes into our opportunities and displays required behavior, I’ll take them. If not, I’ll wait.
Discipline required.
🧠Wait for price to tell you where it’s headed — then react.
Do not forecast or assume.
I will update trades on Twitter/X as I see them play out today.
We’ll see what price brings us.
🧠Follow our rules, protect our capital, size risk accordingly, take profits when they’re due, and only take Grade A+ setups
We’ll have to wait and see what price delivers today.
As always, stick to the plan.
Trade like a Robot, let’s make it a great Monday.
P.S.
Follow Me On Twitter/X for Updates -> https://x.com/@esdailytrader
2 Min Trade Reviews on Youtube -> https://www.youtube.com/@ESDailyTrader
🚨Please See🚨
ESDaily is Rising in the newsletters Finance space on Substack. Thank you for your support. I value your subscription and I want to do everything I can to make it the best for you, the reader.
Would you take a second to fill out this short questionnaire -
Your feedback means so much
🙏Here’s the link to your ESDaily Subscriber Feedback Form
Click Links Below To Scroll To Sections
Intro
Trade Review and Market Action - Previous Session
Trade Reviews From Last Several Sessions
Current Open Position(s)
Overnight Activity
Trade Rules
ESDaily Scoreboard
The Next Piece - Today’s Opportunities/Gameplan
Important Notes
Thank you for sharing and teaching very valuable lessons. Much appreciated. Took the long opportunity today at 5933. I think I am learning to wait and take trades only when opportunity is presented. Thanks to your newsletter and updates in Twitter. Can you also talk about where the stop would be for opportunities listed in the newsletter? I mean what level break would invalidate the trade, etc. that would help new traders like me.
Thank you.