

July 14 - July 18 ESDaily Gameplans
New traders to the ESDaily —
Welcome! And from the entire crew here, thank you for your support🙏.
Existing members: Let’s give a warm welcome to our most recent traders:
Stephen, Neaman, Vince, Gary, Jose, SubwayMouse, Steven, JY, Isildur, Kapil, Loc, FractalS, Global Macro, Roses, Jim, Ross, Binoy, FreeRoaming, Vasant, Kishore.
Let’s get to it.
Find me in the chat - We’re trading live
Current Open Position(s) as of Friday July 18 6:08AM
ES Long 6245.25 - Runner Active - Stop at 6280
Open and Closed Position(s) Yesterday - Same day
Daily Gameplans Listed Below
- Monday July 14
- Tuesday July 15
- Wednesday July 16
- Thursday July 17
- Friday July 18
- ES Strategy - Trade Rules - Key Level Codes (New Reader Must-Read)
Monday July 14, 2025

“The pendulum of the market swings toward and away from risk, rarely pausing at balance.”
— Howard Marks
If you’ve been with me long enough, you’ve probably seen the ESDaily logo:
A hand holding a pocket watch, suspended over Earth.
It’s not just aesthetic. That image captures everything we do here.
The market is a pendulum.
Our job is to know when it’s swung too far — and then wait for the snapback.
We don’t chase strength. We don’t blindly fade weakness. We wait, track, and position at the inflection points — the moments when price behavior starts to shift before the crowd catches on.
And over the last 30 days, we got a masterclass in how this rhythm plays out.
On Sunday, June 15, ES gapped down and printed the psychological round number: 6000.
Exactly 30 days later, we’re hovering near 6300 — a full 5% rally in the index, carried by a persistent bid, thin structure, and emotional extremes that oscillated faster than most traders could adapt to.
But it wasn’t a smooth climb.
It never is. The pendulum doesn’t glide — it swings, and sometimes, it stalls at the apex.
Late June was a perfect example.
From June 22 through July 3, ES made a near-vertical march from the 6180s to the eventual high at 6333.25.
But beneath that strength was fragility.
There were no real pullbacks, no opportunities for clean re-entries — just a frozen pendulum stuck at the top of its arc, refusing to reverse or rotate. It was the most recent test of discipline risk focused traders have had to face.
It was a stretch that punished traders who tried to fight it and traders who chased it too late.
We stayed disciplined. We waited - the result?
We did very little trading - Setups never came to fruition.
The last 10 days - Everything is different
The failed reclaim above 6330 July 7 was the signal. That drop reset risk and gave us one of the cleanest sequences of the summer.
What followed was a sharp and decisive unwind to 6246 - Then some normalcy we could trade around.
I was in Puerto Rico on summer vacation July 3 to July 10 but there were many opportunities that we took advantage of.
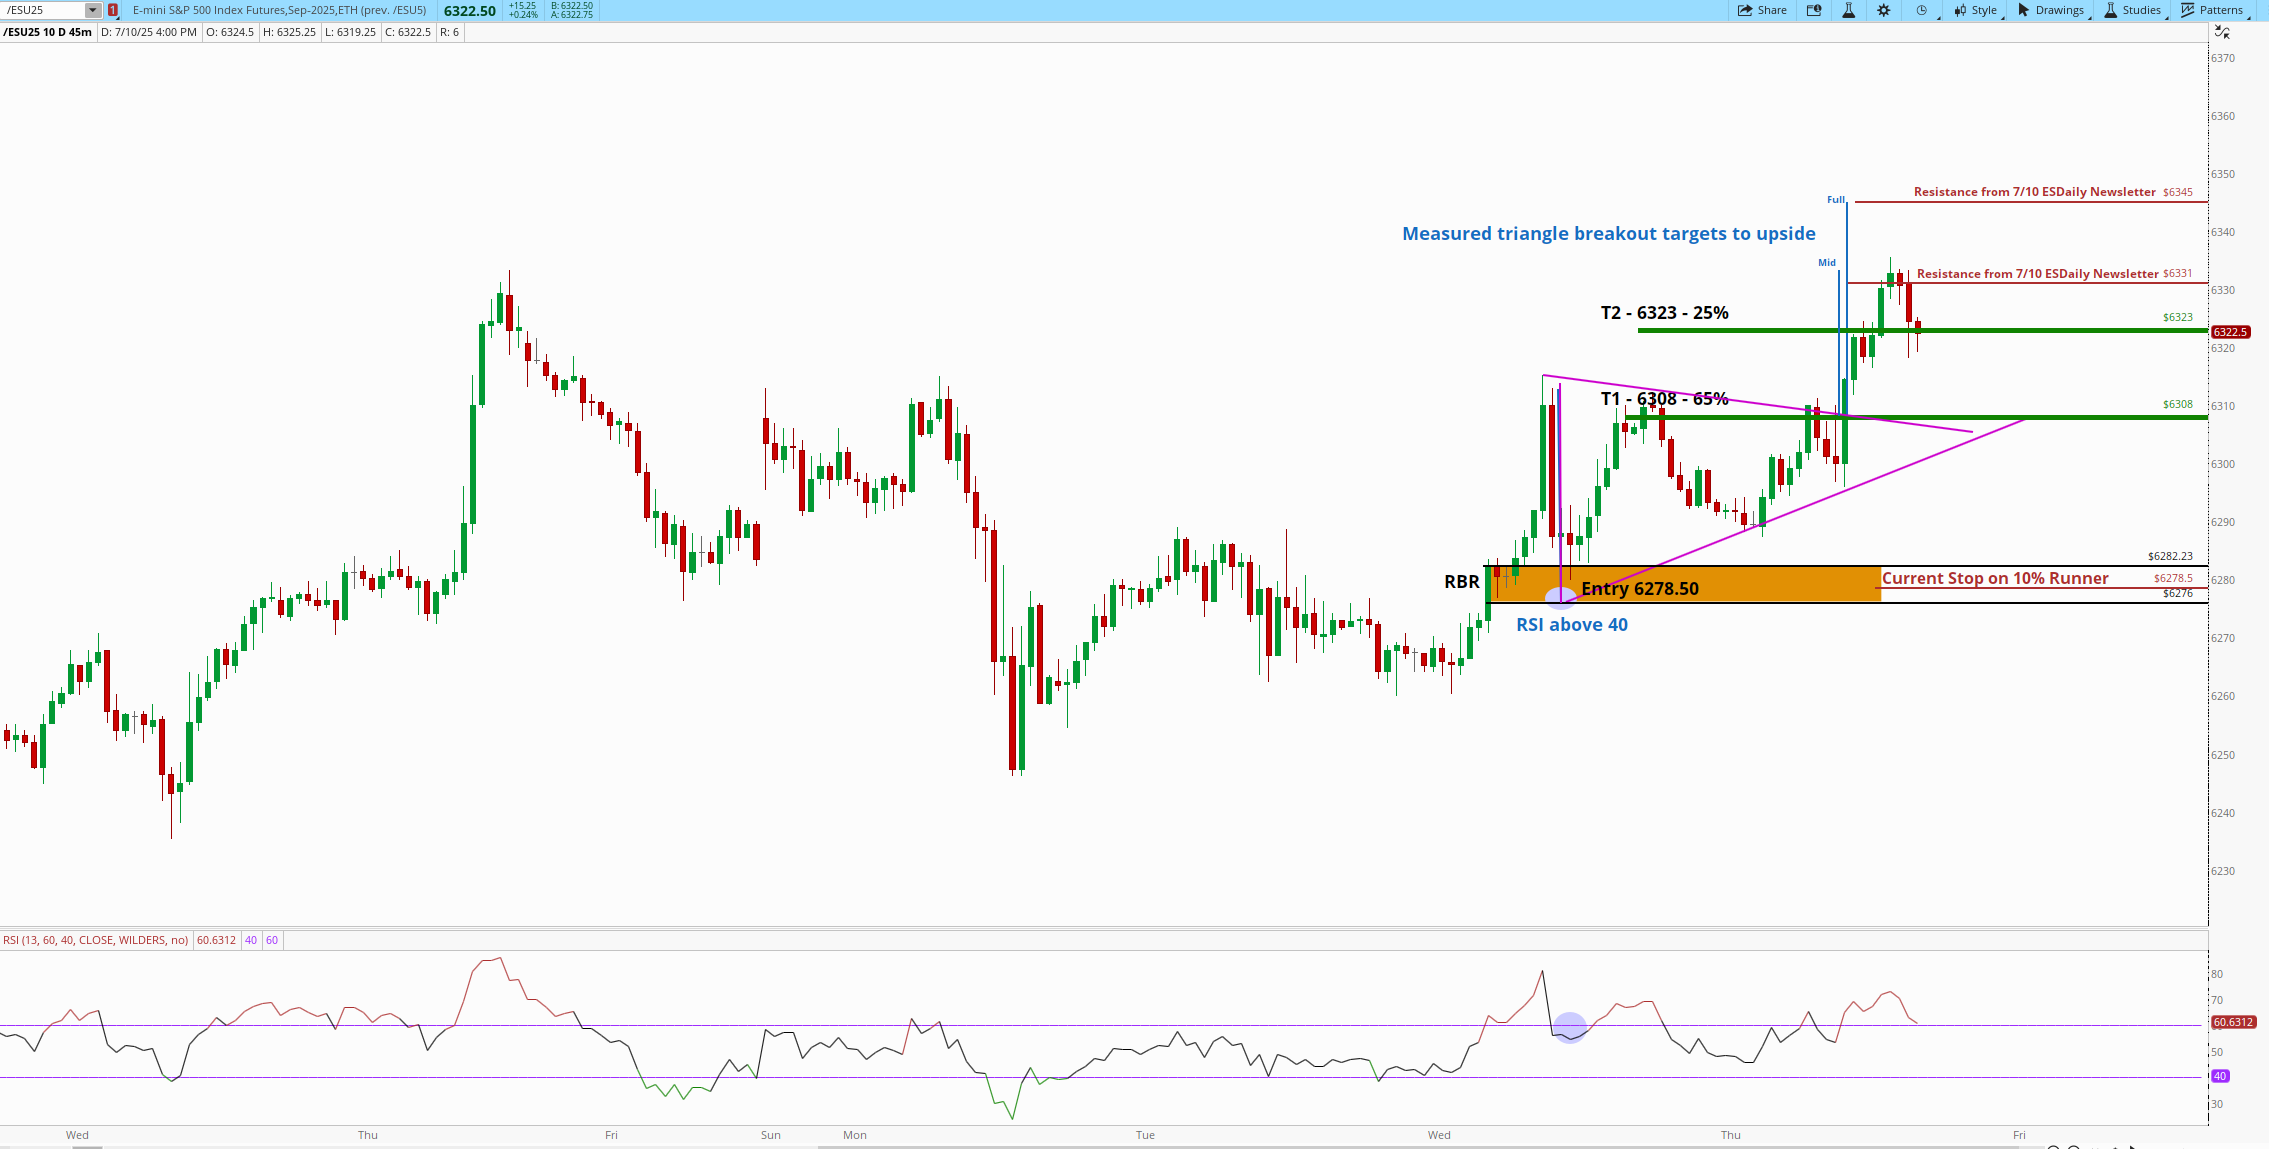
Wednesday July 9 6278 LTB - The structure here was perfect:
After topping out at 6333 Thursday July 3, we pulled back Thursday night into Friday morning. That pullback offered one of the cleanest Level Track Back setups we’ve had in weeks — a 3 hour RBR 6282-6272.
A prior macro resistance level (Dec '24 ATH)
A middle leg of the clean 6262 previous resistance rally. 6236 to 6272(base) to 6333
Clean breakout on Thursday morning with large expansion candles
Excellent approach with RSI > 40
T1 taken at 6308, T2 at 6321, runner stopped
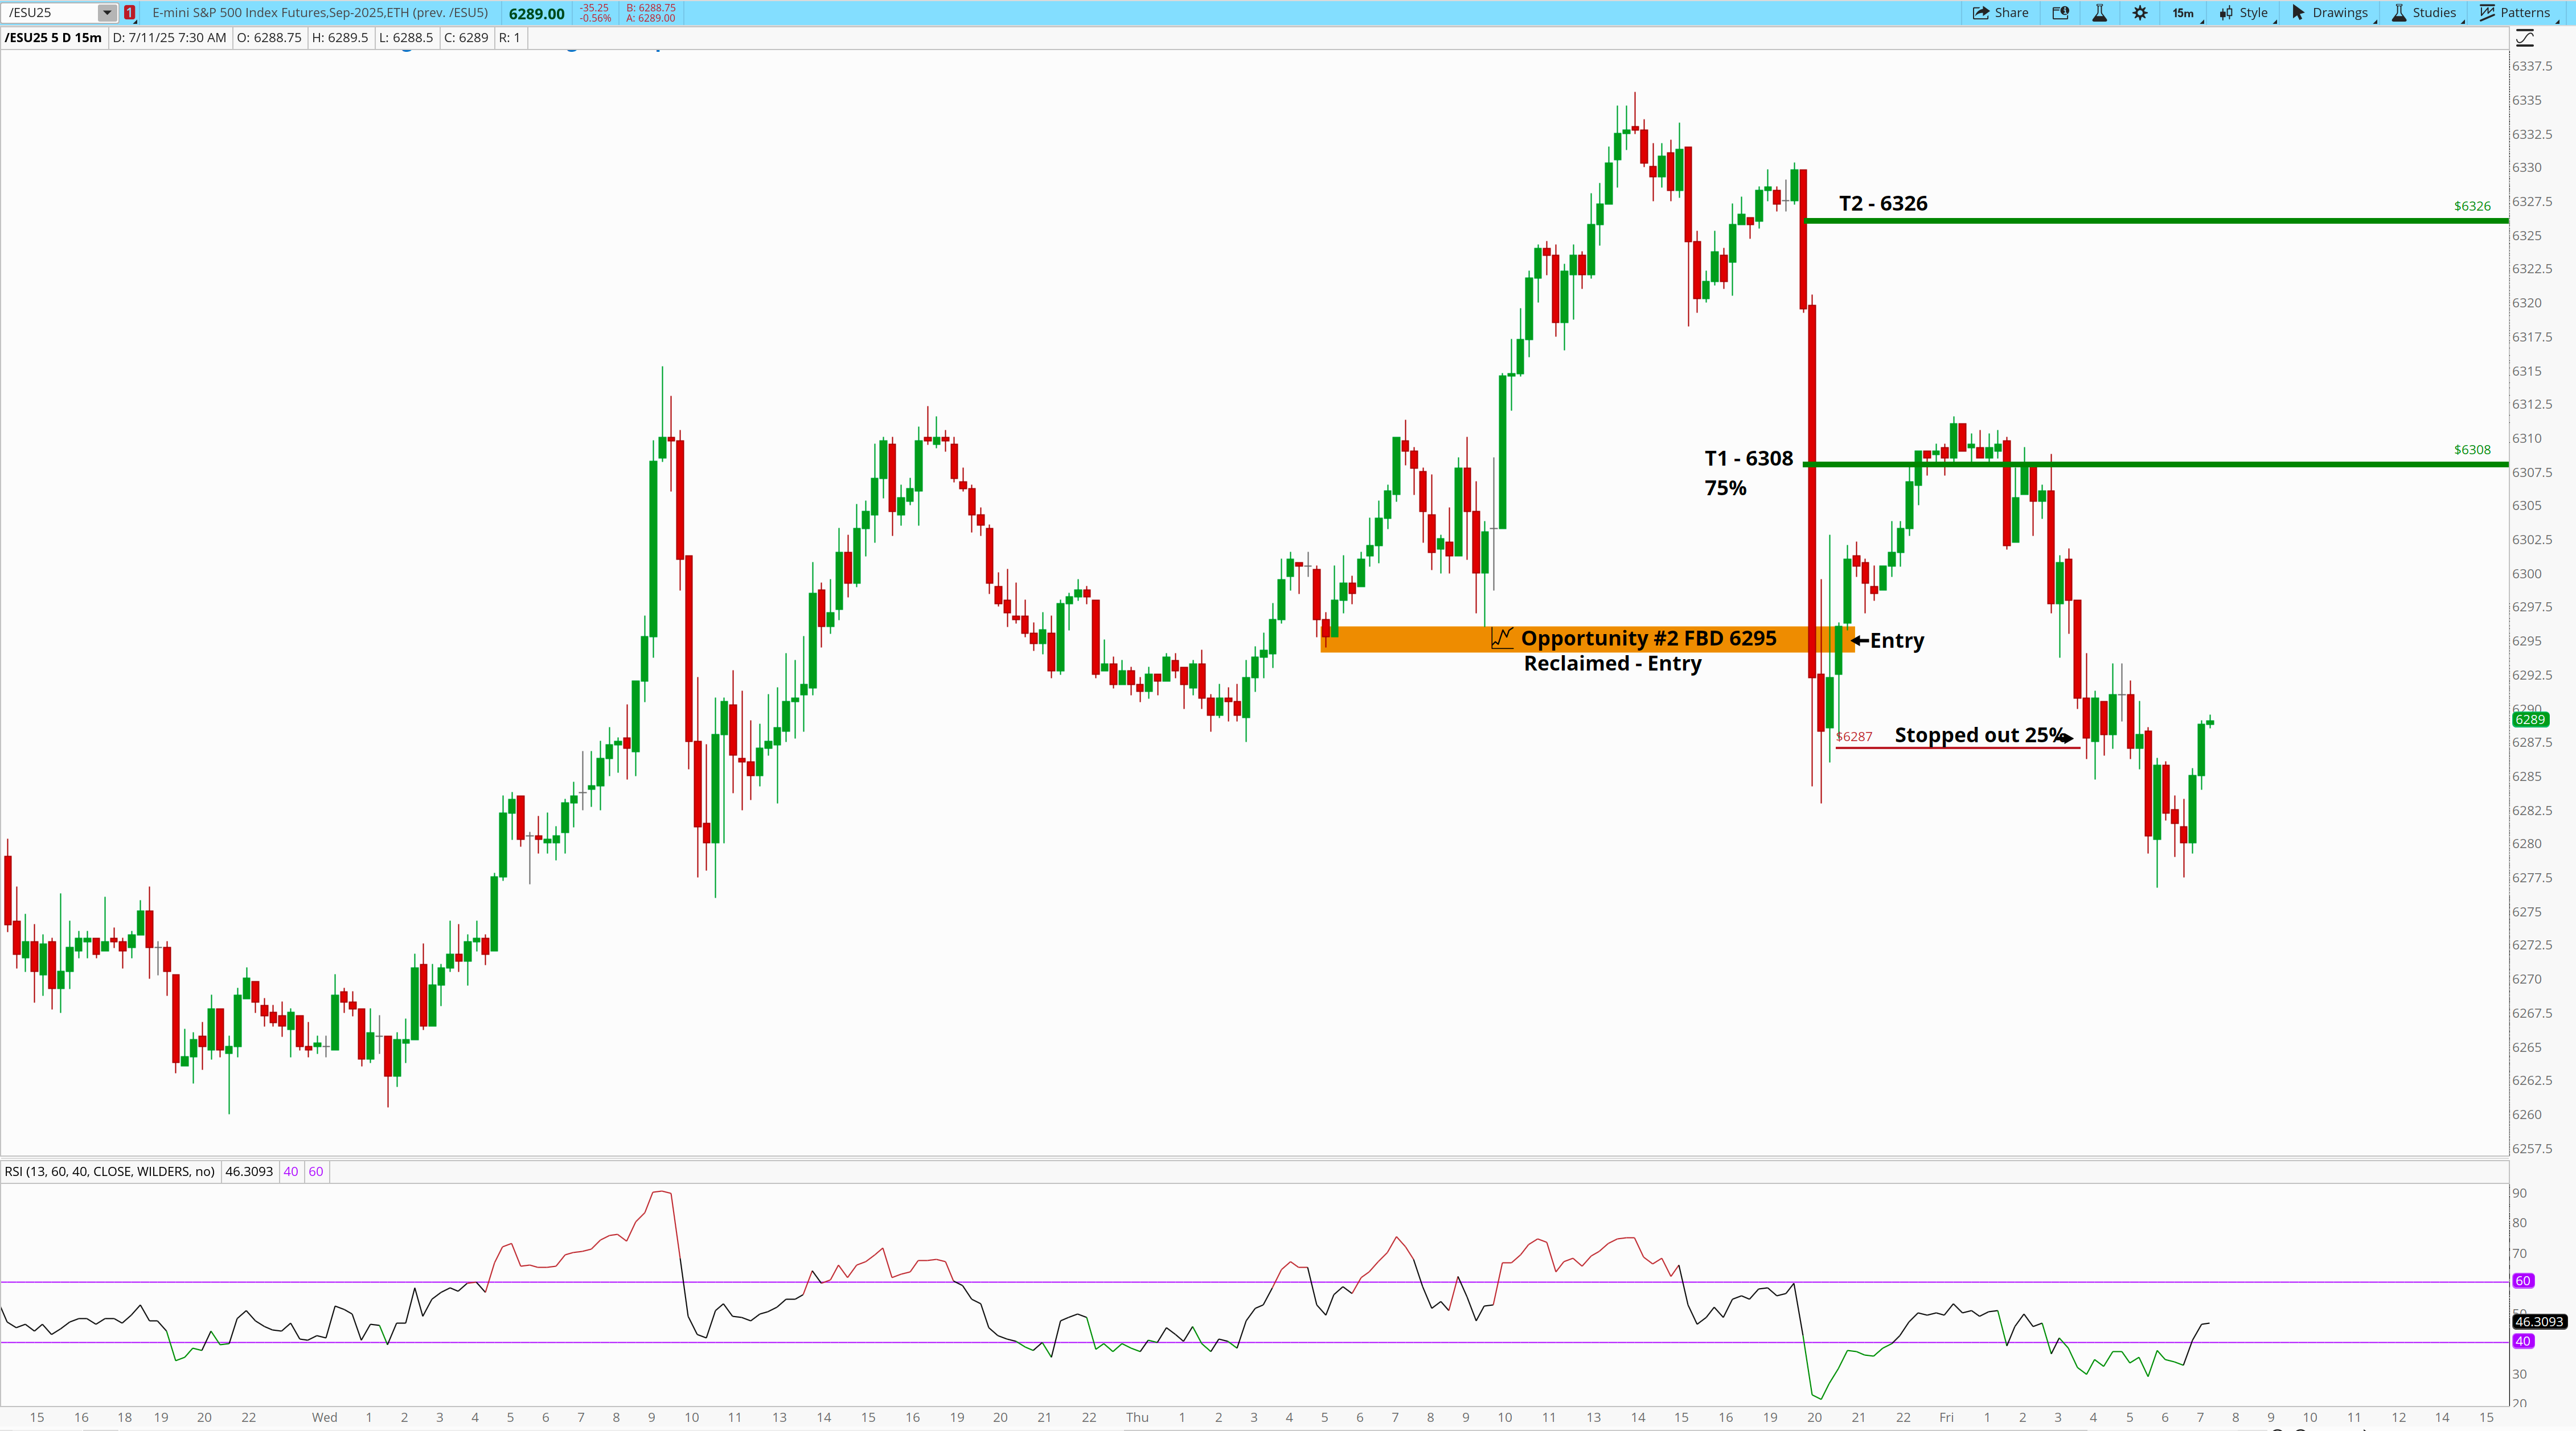
Thursday July 10 6295 FBD - The runner stop out on news headlines
I wrote: “A double bottom in the early morning of Thursday provides a keep structural support zone. One could look to add here on a flush of this level. As always, look for price to “accept” the support below here before bidding back into the trade.”
I waited as price found it’s bottomed and engaged once 6295 was reclaimed. Because of the time spent accepting below 6295 in the 6292-6287 range I didn’t need to put my stop below 6287. If we reclaimed 95 and went below 87 again, the trade would likely be dead. So with an 8 pt stop I entered long, filled at 6292.
T1 6308 - Same as the previous day.
T2 was stopped as the bid failed.
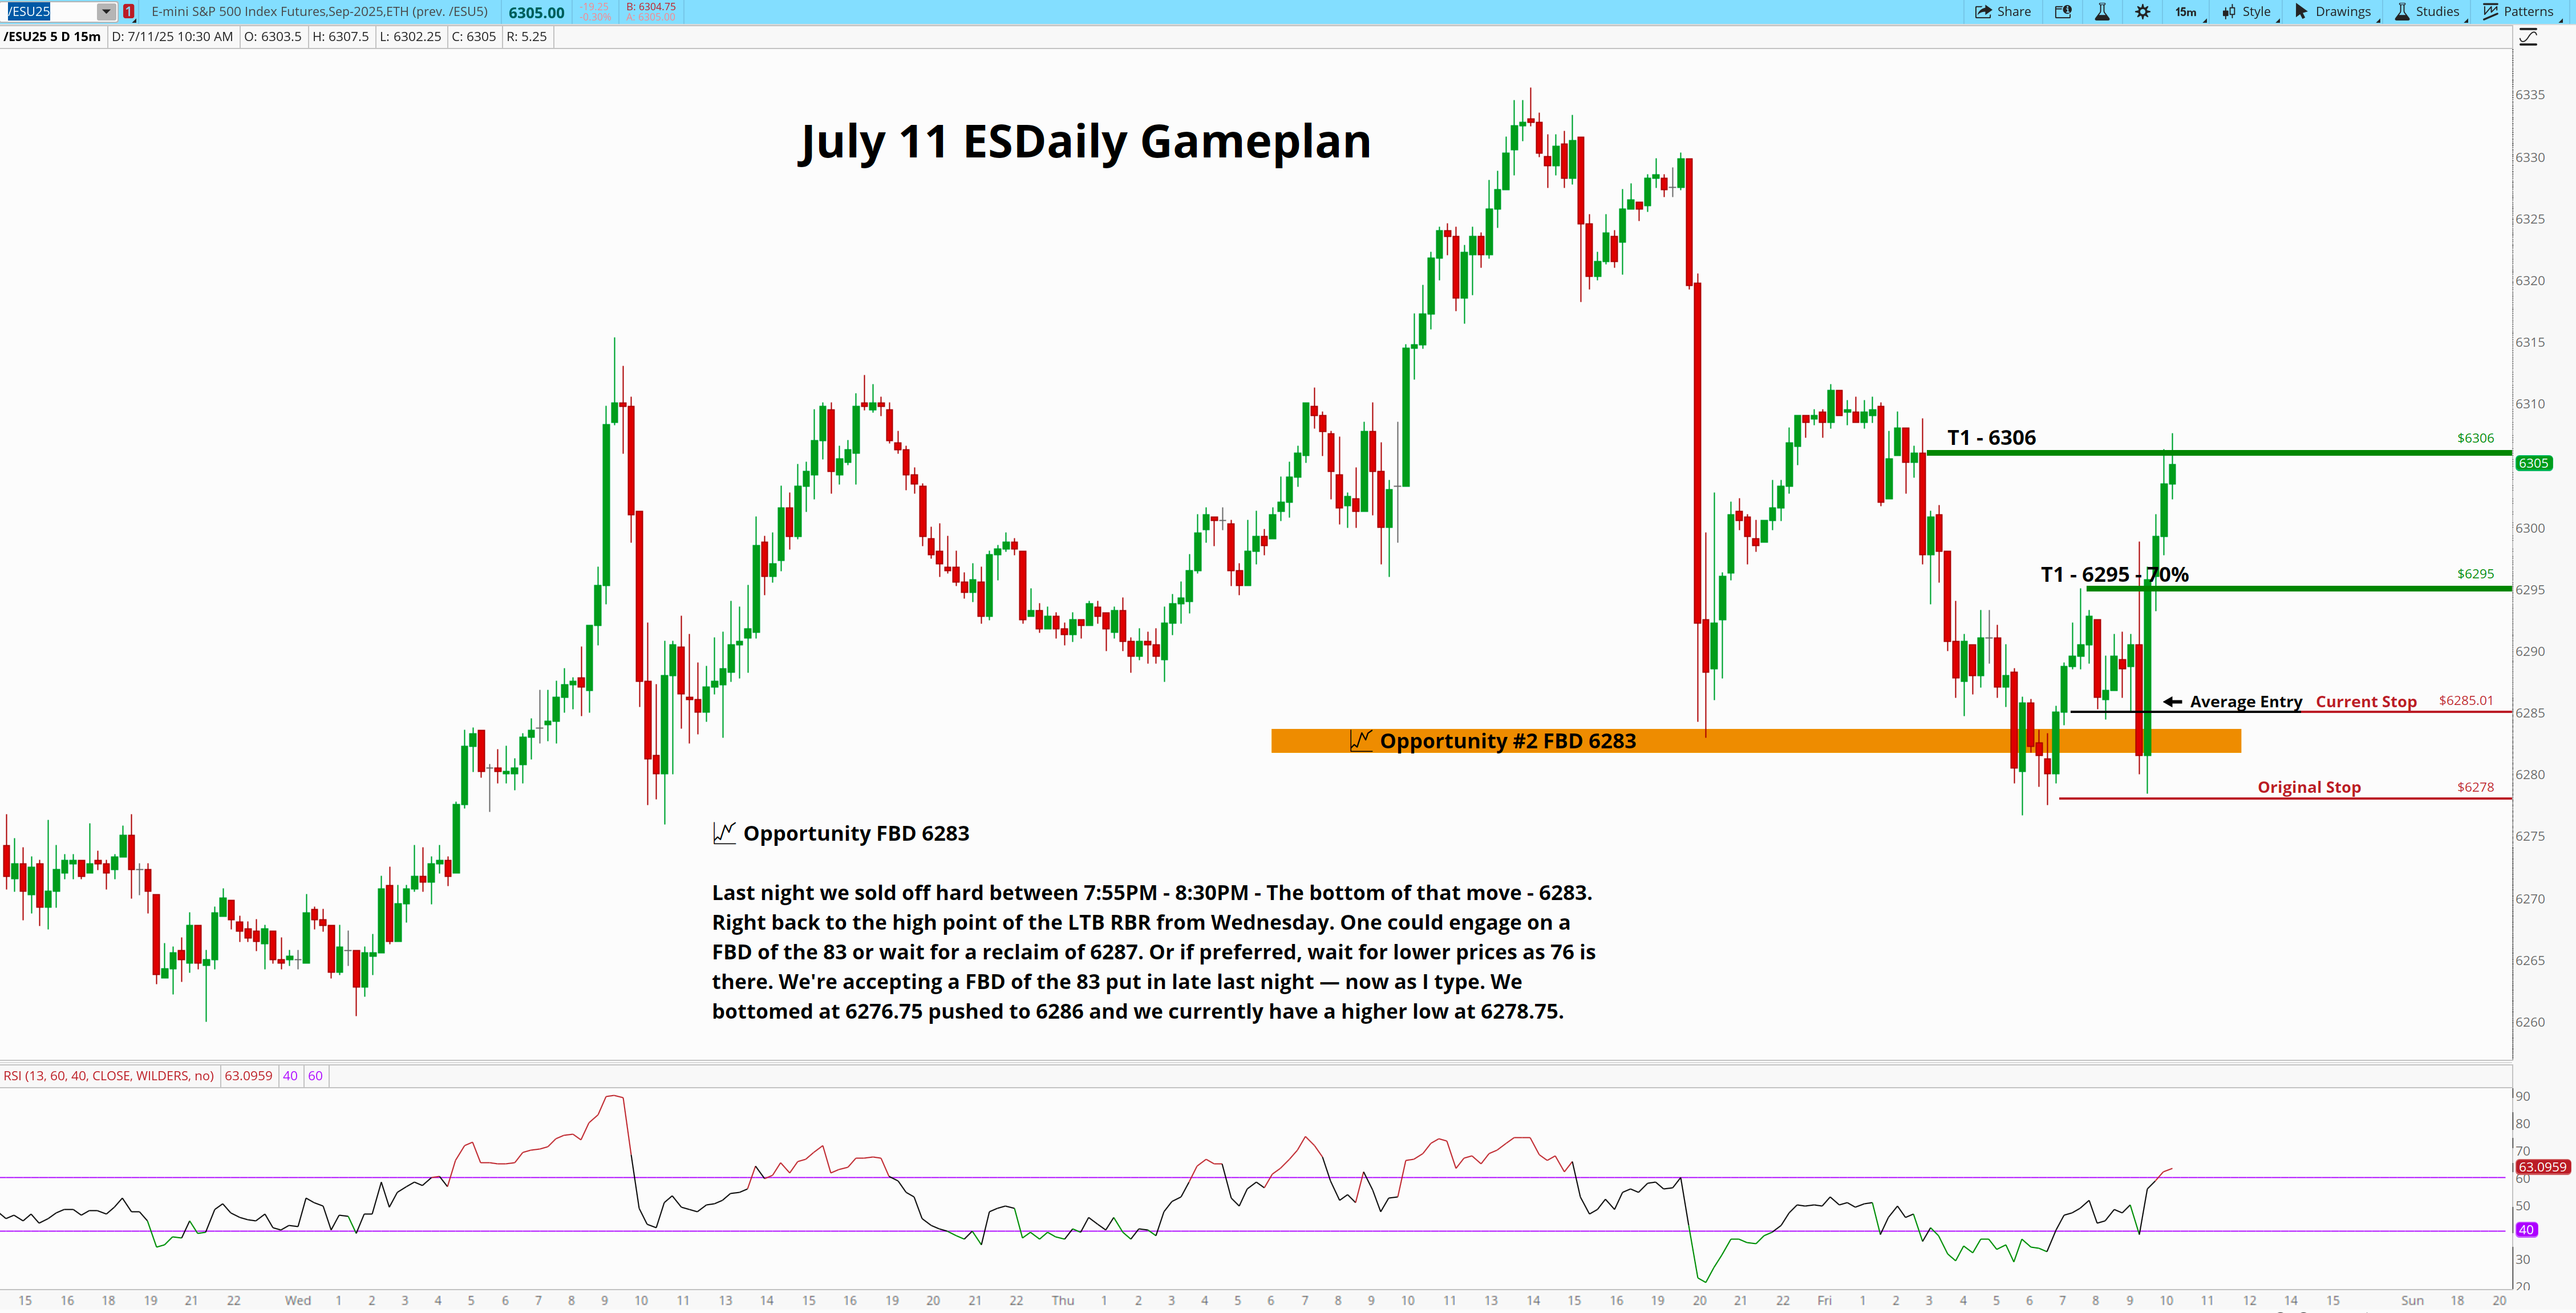
Friday July 11 6283 FBD - After Thursday evenings price collapse:
Last night we sold off hard between 7:55AM - 8:30AM - where we engaged in the 6295 reclaim to T1 of 6308. The bottom of that move - 6283. Right back to the high point of the LTB RBR from Wednesday. One could engage on a FBD of the 83 or wait for a reclaim of 6287. Or if preferred, wait for lower prices. We're accepting a FBD of the 83 put in late last now as I type. We bottomed at 6276.75 pushed to 6286 and we currently have a higher low at 6278.75.
I entered at 6283.75 more at 6287.
T1 was 6295
T2 was 6308 (Again)
Both hit and on Sunday evening we gapped down stopping out my runner.
These weren’t high-conviction guesses.
They were measured responses to emotional swings — trades taken at the edge, where the rubber band was stretched and price behavior turned. I mentioned all of these in the chat and updated subscribers along the way as to what my thinking was.
That’s what we do.
We don’t predict the pendulum’s arc — we react to where it’s gone too far.
It’s a classic sequence:
Panic → Bid
Euphoria → Exhaustion
Flush → Reclaim
Bounce → Lower high
You can draw the pendulum arc across the chart. The emotional extremes are written in candles and printed for all to see. Most just get lost in the forest by looking at each tree.
This is why most traders fail.
They believe every 20 point move is tradable.
It’s not.
The edge doesn’t come from being right about the next swing — it comes from waiting for the evidence that the current one is done.
And early this morning - we hit another pendulum peak, and we’re currently swinging back.
Friday I wrote:
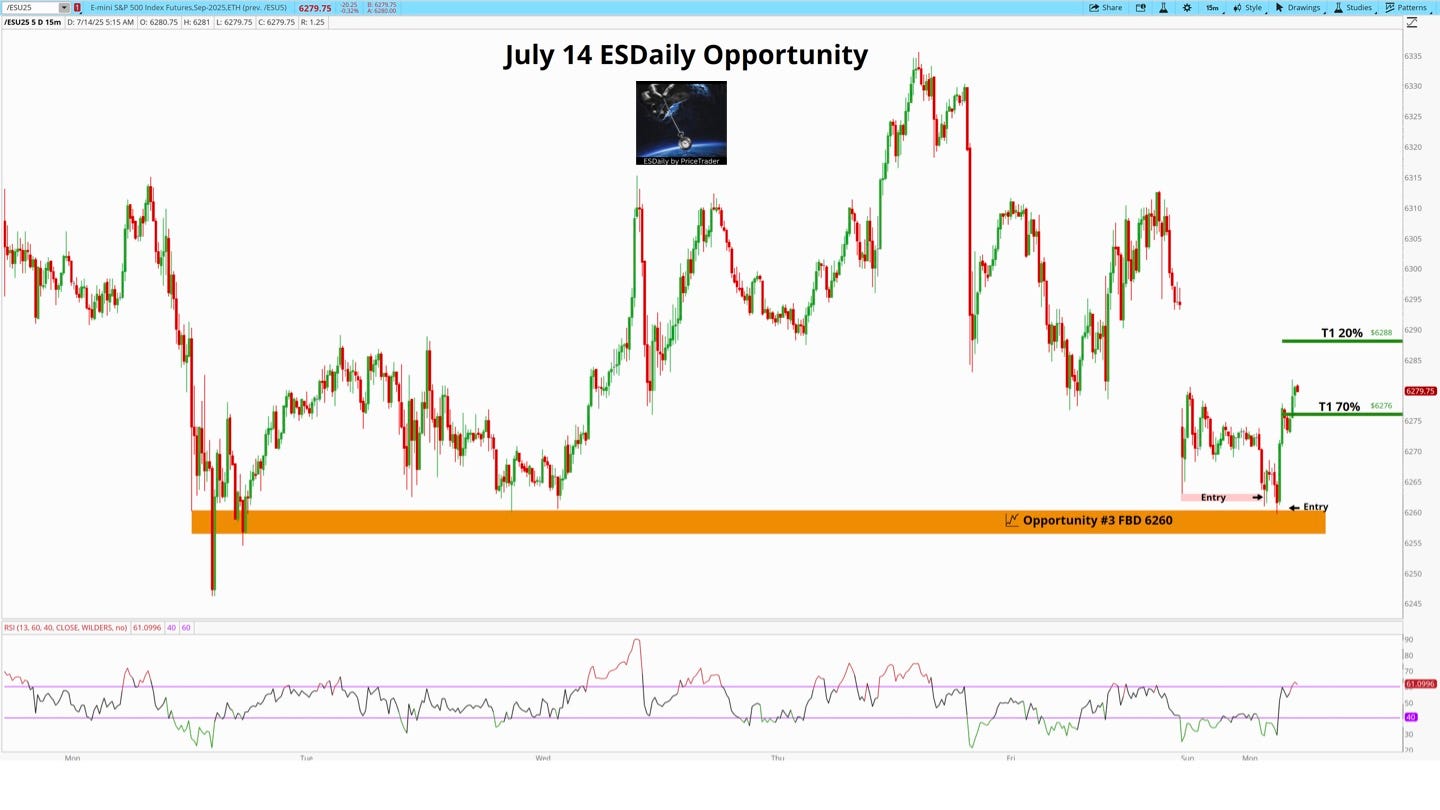
📈 Opportunity #3 FBD 6260
Tuesday evening→ Wednesday night we used 6260-6261 as a floor before spiking 70 points. If we take out 76 and sellers rush in, It wouldn’t take much (as there’s little demand except for a small pocket at 70) to get there. A break below 6261 that forms acceptance above 6246 would be the idea. Ideally we’d bottom at 6254. No knife catching here as weakness has crept into the market and the impulses are shifting.
We gapped down Sunday night, bottomed at 6263, bounced to 6280 and then chopped.
But at 1:30 this AM, price broke beneath 6263 to 6260. That put in a potential 6263 FBD right on top of the 6260 opportunity.
I decided to get long at 6261.75. Price bounced to 6268 and then flushed to 6259.75 - The FBD was taking place. On the recovery I added more at 6260.25.
I wrote all this out in the chat and referenced 6276 and 6288 at targets.
From 3:30 to 3:58 we rallied sharply to 6278 where my T1 was secured.
It’s now 6281.
Here’s the link to the 6260 trade review that’s updated as the trade unfolds.
Once again — extension, break, shift, snapback.
The pendulum had swung too far into weakness — and we simply caught the recoil.
We’re sitting in mid-range again — 6270s, with 6246 holding and 6314 capping. This is no-man’s land unless a real reclaim above 6298 or breakdown develops.
Until then, we stay patient.
Because our job isn’t to swing with the market —
It’s to wait for the moment it swings too far.
And then step in — with precision.
So now for today, we need to be picky with new opportunities. With a winners on the board, I’m not keen on rushing into anything.
Monday’s ESDaily Gameplan And Opportunities
Likely Supports For 7/14 are: 6275, 6271, 6268, 6261, 6257, 6252, 6250(CRA), 6245 (D), 6236 (CRA), 6227, 6222 - 6217(D), 6208(CA), 6199, 6183 (CRA), 6176 (CA)
Likely Resistances For 7/14 are: 6289, 6292(S), 6302, 6308, 6314 (CRA), 6326-6331(S), 6340, 6345, 6348 (CRA), 6352, 6359, 6365(CA), 6380, 6384-6387, 6412, 6419
📈 Opportunity #1 LTB 6275-6271*
Only if my T2 of 6288 is hit. If 6288 is hit a new RBR formation will have been formed. From 6260 we pushed tightly coiled at 6275 and now we’re looking at 6283 pushing north. I want to see another impulse to the upside, close the gap at ~6295. If this happens and price begins to fade, one could look to add if we retest this zone. But, if we stall here at 6283 and bounce around, the level will not have been fully formed or if it does, it’ll be weak. Need to wait for confirmation of this zone before we take it. RSI above 40 required for me.
📈 Opportunity #2 FBD 6246
The tweezer bottom from last Monday is an obvious opportunity for a FBD if selling persists today. However, if that happens it’ll be a very weak market and we won’t be catching any falling knifes. A drop below this area that forms acceptance that ideally finds it’s low above 6236 would be the setup I’d be looking for. A hard flush… a low above 6236, a test up, a failure that has a higher low, and then a strong reclaim of the tweezer bottom.
One could potentially look at the 6260 again if we unwind from here but I’ll be waiting for additional liquidity to hit the market if that happens. If we reclaim 6295 that would also be an area one could look to as a spot to be a buyer, however I’d be aggressive with targets as 6304-6315 is a major area ES has been respecting. It’s early in the day and a lot of price has yet to be discovered as we enter this week. I’ll be updating any potential areas I’m interested in as the day progresses inside the chat.
I’m not interested in shorting the market right now. We are still in a 4 hour uptrend and I will defer to that trend until I am told otherwise. However, if traders wanted to look for a short, the most obvious is the gap. 6295. However, any RSI above 60 as we enter into this area needs to be noted. Another, opportunity may be a FBR of the 6314. One where price breaches this area and fails around 6318 and comes back below 6308 or so. Approach will matter here. You’d not want to see demand created anywhere in the 6295-6305 area. I won’t be taking either of these
Bulls need to see 6260 hold. In an ultra bull environment we’d not see ES go below 6270. For bears, their licking the gap down failure and need to see the gap hold. If 6315 is taken over, their last hope. is 6326-6335 supply.
Let’s trade well and safe.
Already starting of Monday in the green.
Tuesday July 15, 2025

“Everything we need to know is already on the chart.”
-PriceTrader
So many times I hear and see traders talking about where the market is headed.
Everyone loves forecasts.
They’ll spend their morning pontificating on what the next CPI number means (out at 8:30 today), how the Fed will interpret it, what Powell will say, how interest rates will react, whether inflation is “actually sticky,” what that implies for home prices, consumer spending, oil, gold, the dollar…
yadadadada.
In my experience, as a trader — this is a complete waste of time.
Because the truth is:
We never know the future.
And the more we try to trade it, the worse our performance gets.
What Everyone Else Does
Here’s what happens instead:
They build a narrative.
They convince themselves they’re right.
They scroll Twitter to reinforce the bias.
They size up because it “feels right.”
They enter early.
They exit late.
They get chopped up.
They blame the data.
Then they go again tomorrow.
But none of this is necessary.
Because everything we need to know is already on the chart.
Not in the CPI.
Not in the headlines.
Not in what some macro influencer thinks is priced in.
Just structure, behavior, and timing — all unfolding in real time if you’re patient enough to see it.
This idea about what so many traders do - anticipating what the next headline means - led me to think about “why” traders fail.
I think this is of great value and I wish I knew this much earlier in my trading career.
Here’s the list I wish someone handed me early on: 20 Reasons Traders Fail
Trading what they think will happen
Oversizing without structure
Entering early, exiting late
Chasing strength at highs
Ignoring key levels
Trading off CPI, Fed, or earnings
Letting Twitter guide their entries
Revenge trading after losses
Overtrading sideways markets
Needing action, even when none exists
Cutting winners too early
Holding losers “until it comes back”
Getting chopped in mid-range
Forgetting that “no trade” is a trade
Confusing volatility for opportunity
Fighting clear trends
Flipping bias impulsively
Trusting indicators over price behavior
Letting macro noise override micro setup
Changing the plan once in the trade
We’ve all been guilty.
The edge comes from doing less, but doing it better.
Here’s what we aim to do instead
Stick to a process that offers results.
While most waited on CPI noise to hit 24 hours later, we tracked behavior.
Price flushed back into 6260, a zone we’ve been watching for days.
No need to predict — just observe.
The Opportunity was posted
The entry criteria and price behavior required was met
It reclaimed.
We entered on structure, not story.
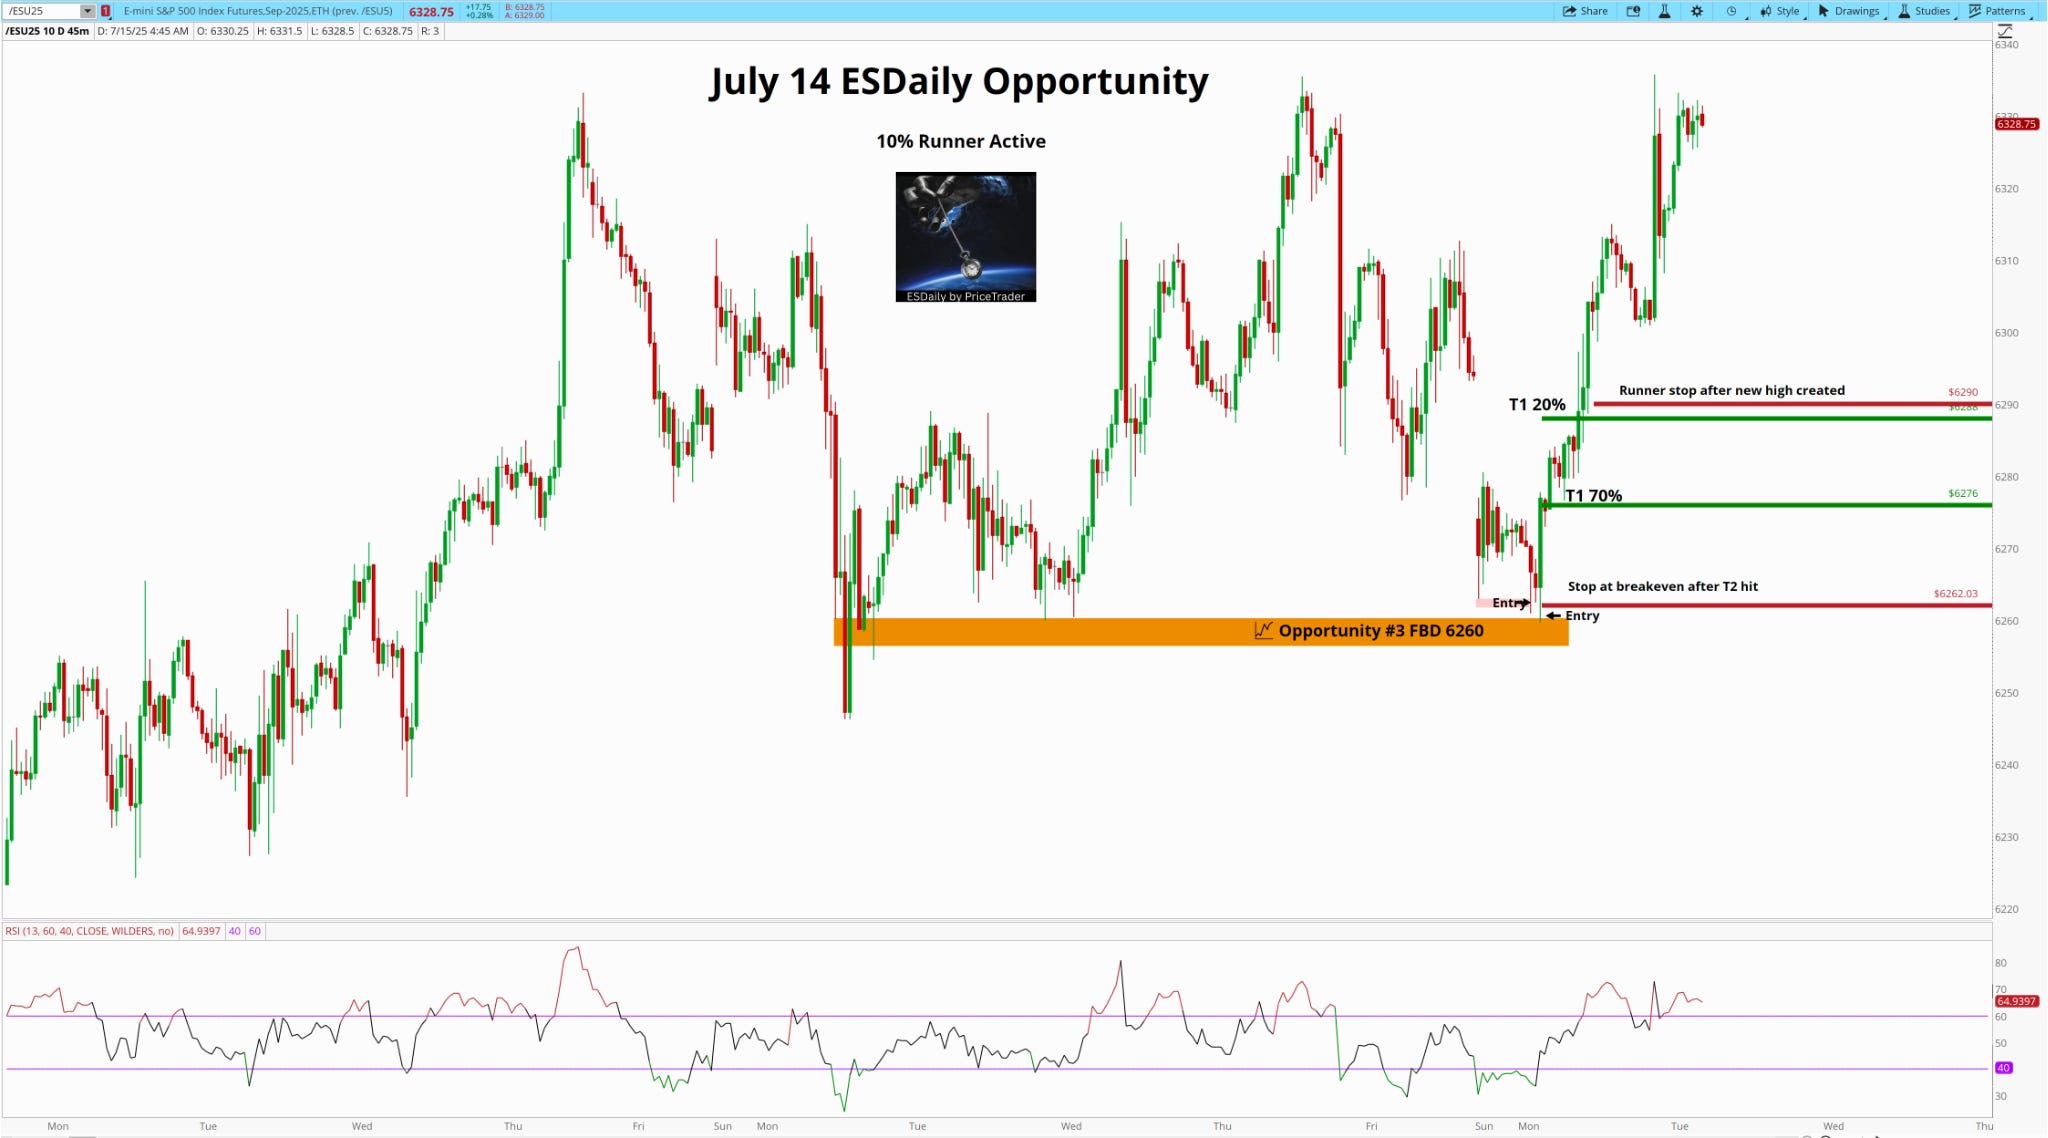
T1 hit at 6276 (70%)
T2 hit at 6288 (20%)
Runner stop trailed above 6290
A clean read. A clean trade.
No forecast needed.
We didn’t forecast
We didn’t watch the news
We didn’t scroll Twitter
We didn’t get out early
We weren’t shaken out because of a 20 point pullback
We didn’t trade inside the chop
We did it… different.
I hope the idea of “being different” when it comes to trading sits in.
It matters.
So where are we at now?
The 30 Day 4-hour chart tells the story:
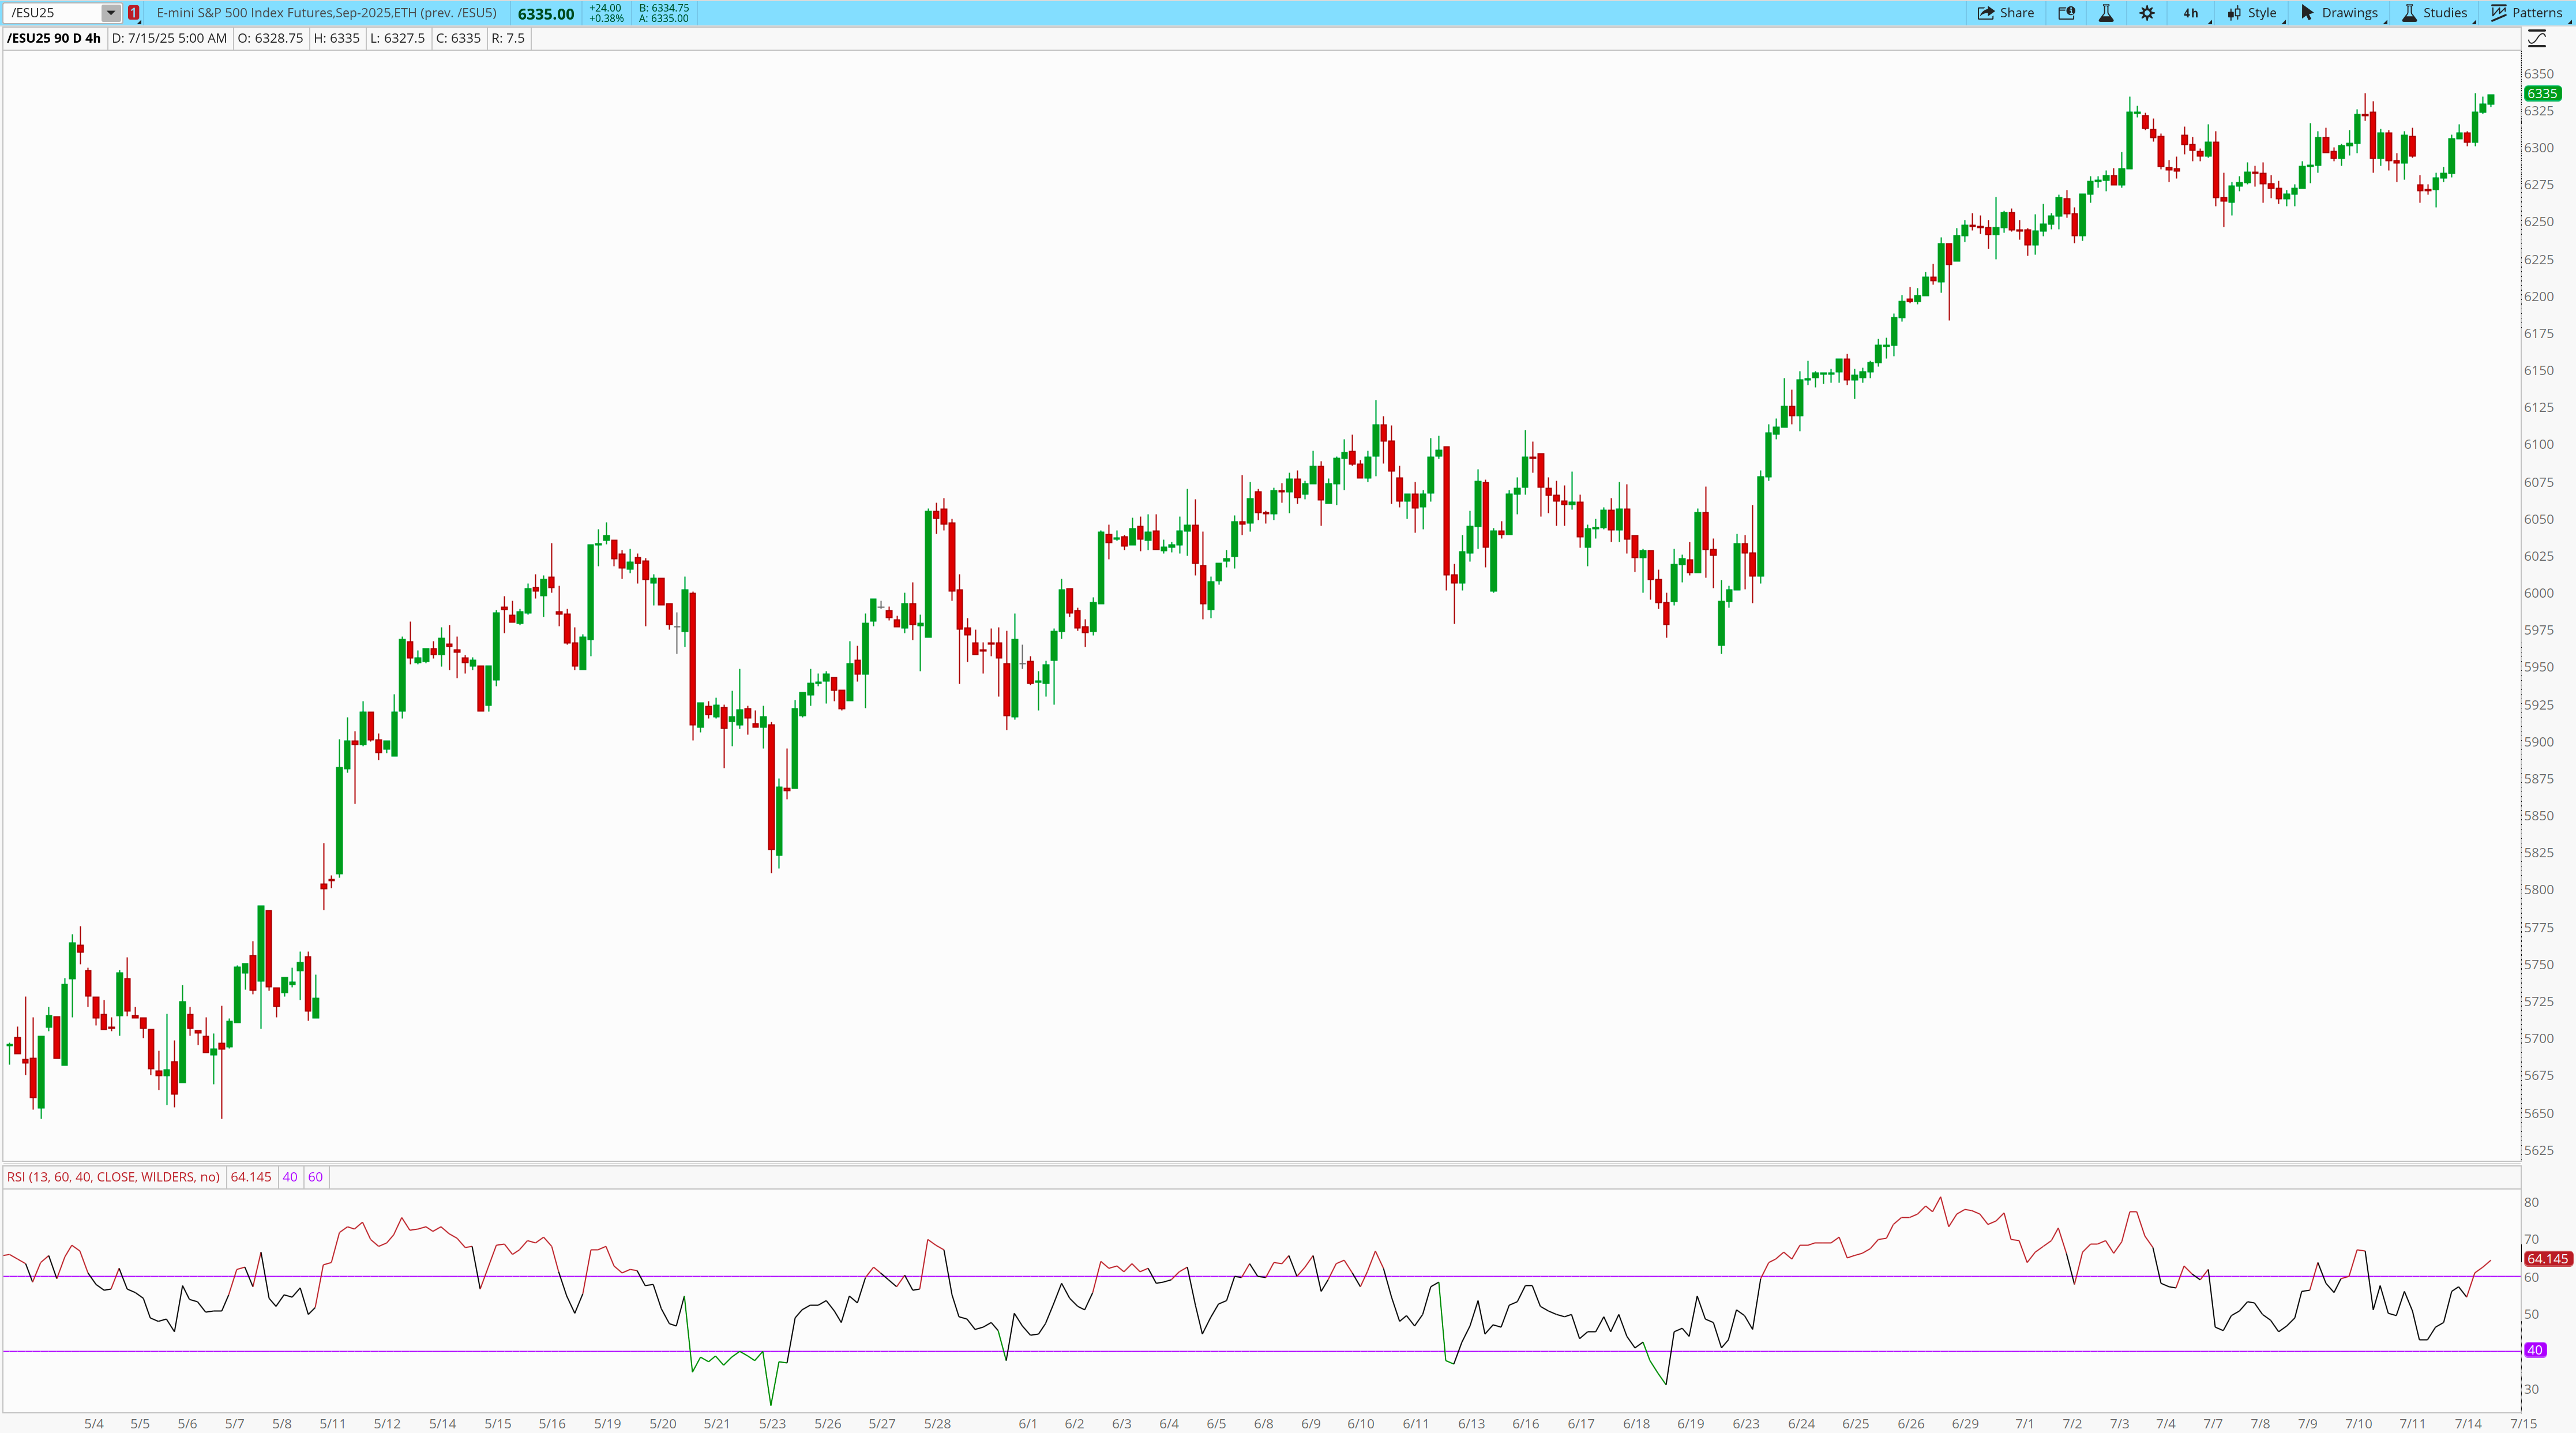
Price remains in a higher-high/higher-low structure
RSI divergence is emerging — momentum slowing, even as price climbs
But no lower low in place yet.
We’re above RSI 60 and pressing into new high territory
The takeaway?
Caution is warranted, but no signal to fade.
Let the chart decide.
Not your ego.
Not the news.
The trend is up.
We will trade it as such
What Actually Matters
The edge isn’t in predicting CPI.
It’s in reading the flush after CPI.
It’s in watching for failed moves, reclaimed levels, liquidity tests.
Everything we need is already there — on the screen.
That’s the whole game.
Let’s keep playing it.
Here’s what I’m looking at for today
Tuesday’s ESDaily Gameplan And Opportunities
Likely Supports For 7/15 are: 6327-6325, 6322, 6319-6315(D), 6310, 6301(CRA), 6295, 6290, 6286, 6280, 6276-6271(D), 6268, 6262-6260(CRA), 6255, 6246 (CRA), 6236 (CRA), 6227, 6222 - 6217(D)
Likely Resistances For 7/15 are: 6340, 6345, 6348 (CRA), 6352, 6359, 6365(CA), 6380, 6384-6387, 6400-6404, 6414, 6419-6423, 6428, 6433, 6439, 6443, 6452, 6468, 6470
While we don’t trade CPI it’s important to note that volatility will pick up. This means, many low time frame supports are easily broken. Many 15 min demand zones are fragile. Many overnight levels fail.
On top of that, we had a large move from the 6260 trade yesterday. We know after a big run in price, the worst time for traders to buy is at 1st and sometimes even 2nd level supports as price often violates these areas as liquidity seeks occurs.
I can only speak for myself, but for me, knowing I have the runner from 6260, I’ll only be looking to add at areas a true breakdowns and reclaims. I’m not interested in take small time frame levels today high up on the curve. I want to create an edge for myself, and I do that by remaining patient and taking only the best setups.
As always but today especially with the uptick in vol coming…
There will be no knife catching. We will be waiting for price to tell us a bottom is in reclaim a critical area and then proceed.
📈 Opportunity #1 FBD 6301
Yesterday afternoon at 4:16 I noted 6306 and 6299 were first level supports after running above the 6314 CRA. They held and now price is 6337 13 hours later. We’re pushing into new high territory - This can be wiped out easily and traversed. If price breaks down and flushes this multi-touch support I may be interested. I’d be looking for a flush, and price to find it’s bottom above 6295 (yesterday’s gap and today’s support), accept that price as the low of the flush, form a reversal, and reclaim with strength.
📈 Opportunity #2 LTB 6283 - 6276*
Yesterday from 5-9AM we formed a tight coil in this area creating a pocket of 1 hour demand. The rally from 6260 consolidated here and then a burst higher closing the gap from Sunday and leading to 6314 where the first pullback occurred. There was strength and size from this area and I’d be interest in a pullback into this range. However, bidding direct will be difficult as any pullback here would likely put RSI below 40 on the 1 hour. If that occurs, we could look for a confirmation trade, one where price enters into the level, forms some type of divergence on the 15 minute and then exits the level.
Other Honorable Mention levels -
-*15 minute demand 6276-6271 - If trade opportunity 2 doesn’t display the price behavior required and is broken, we could tag this area. If tagged and 6283 is reclaimed opportunity 2 could turn into a FBD trade.
-15 minute demand 6319-6315
- 6260 FBD
- 6222 - 6217(D)
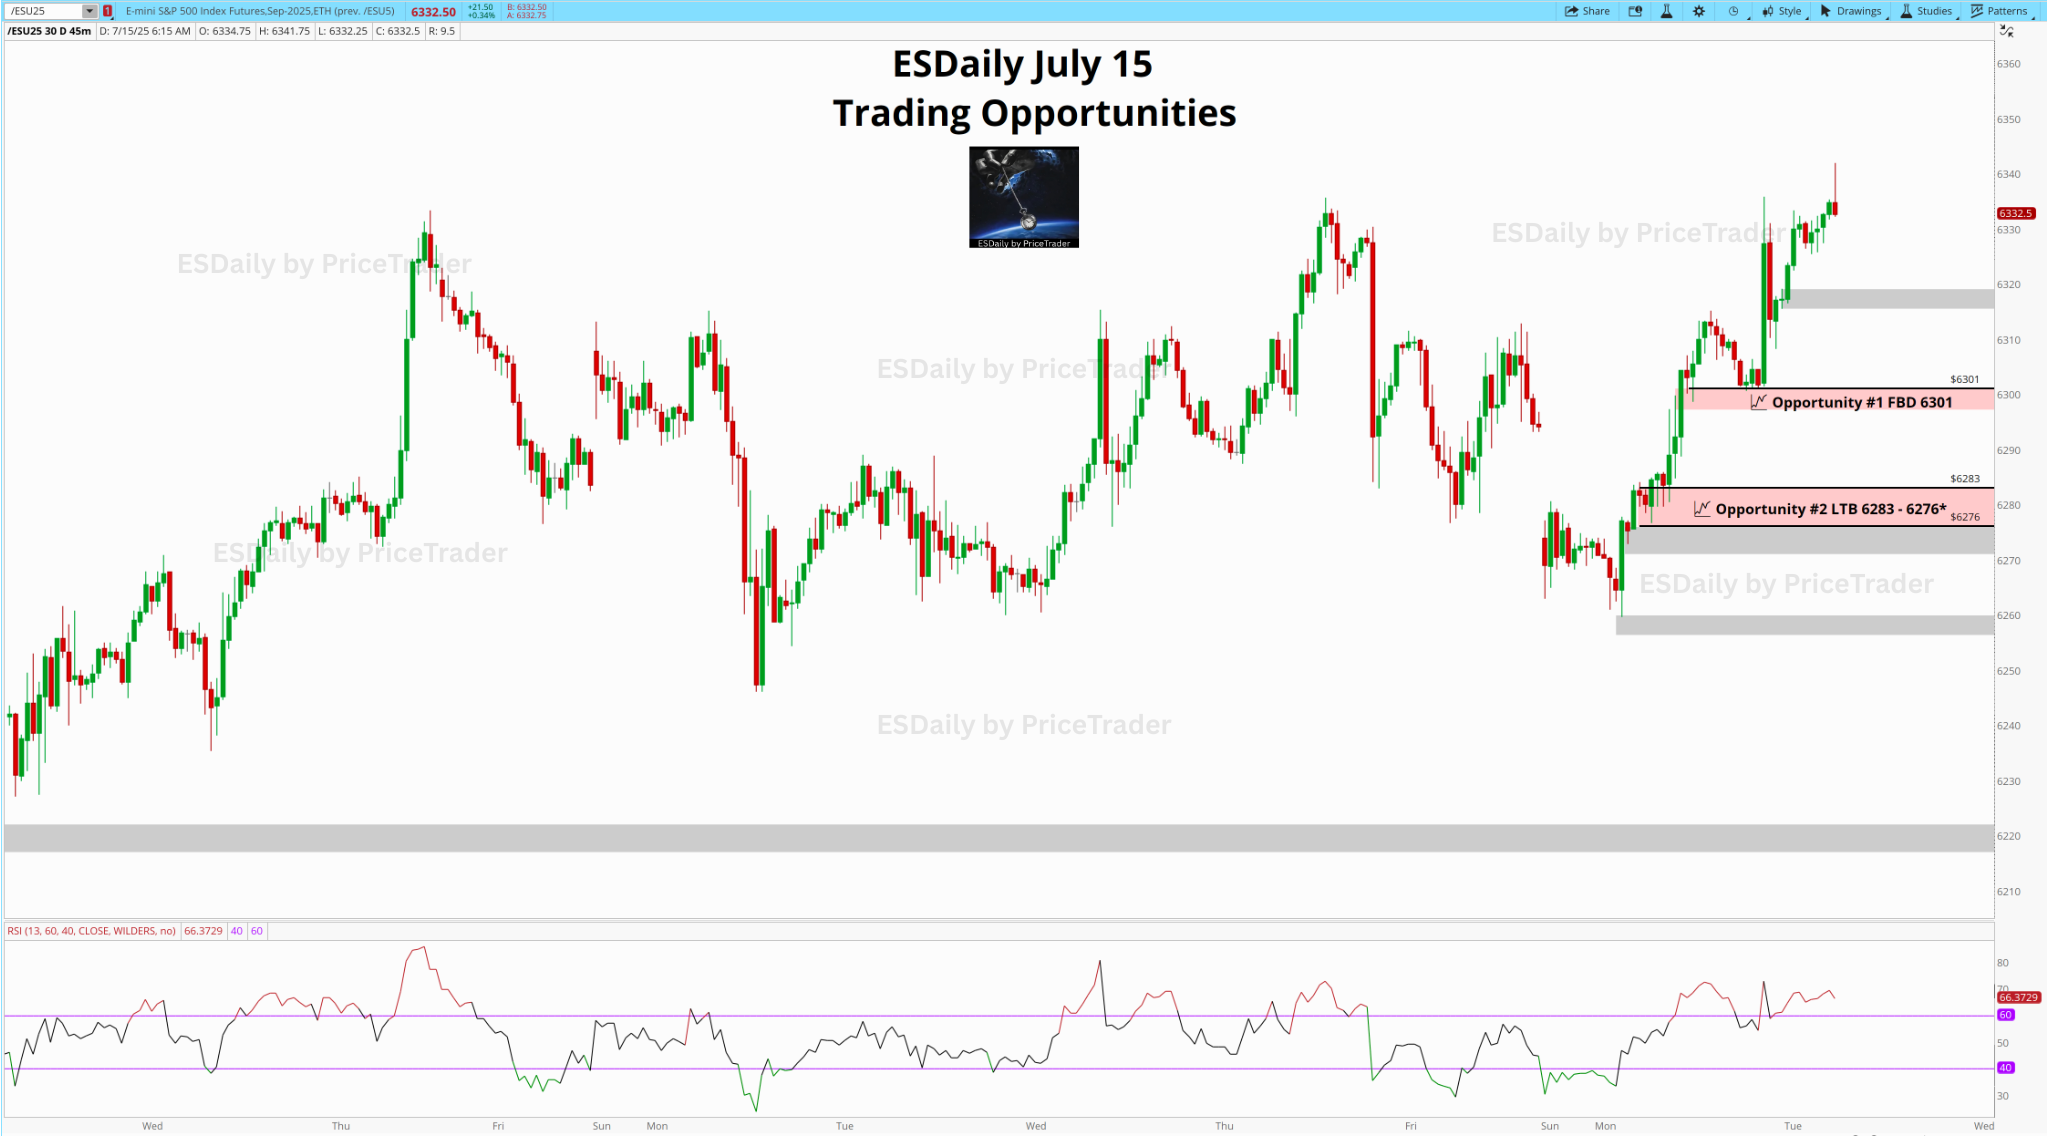
Trend is holding up, I will not be shorting today. If I wasn’t interested in shorting yesterday when the 4 hour was up and the 15 was down, I certainly wouldn’t be interested when the 4 hour is up and the 15 is up - regardless of the 4 hour divergence.
As always stick to the plan.
No overtrading. No getting in and out of trades. No impulse decisions.
Let the runner work.
Wednesday July 16, 2025

Since ESDaily started I’ve always expressed the importance of abiding by the risk management and profit taking system.
I do this for a reason.
I constantly remind myself of the system I’ve put in place that’s generated consistency — the one that transitioned me from a losing trader to a winning trader — the one that’s made trading as stress free as possible.
I know what having this in place has done for me and my family — I want to share it with all. I’ve been trading everyday for nearly 15 years. I’ve had my 10,000 screen hours and I’ve spent hundreds of thousands of dollars in “tuition” fees. If I can help anyone fast track that, at a much cheaper expense 😂, I want to.
If you read the newsletter in it’s totality, you’ve notice I include this every day, never changing a word. But banner blindness can cause us to subconsciously associate it with irrelevancy.
I’m going to highlight some of these points today.
Structure
Each session is a building block laid on top of the previous day.Trading rewards patience, not action.
We need to take a PIECE of the action, not get all of it.
Take the majority of profits at T1, more at T2.
We always leave a runner when permitted. The runner is the unlock.
Limit your trades.
The market doesn’t hand out trophies for participation.
The job is not to trade all day.
Let’s Talk About Structure
The Tariff bottom price printed was 4877.5 April 7th, we rallied to 5563.25 2 days later.
Then we sold off to 5168.75 by April 21.
Since then, ES has been on an incredible run.
Yesterday, we printed 6343.
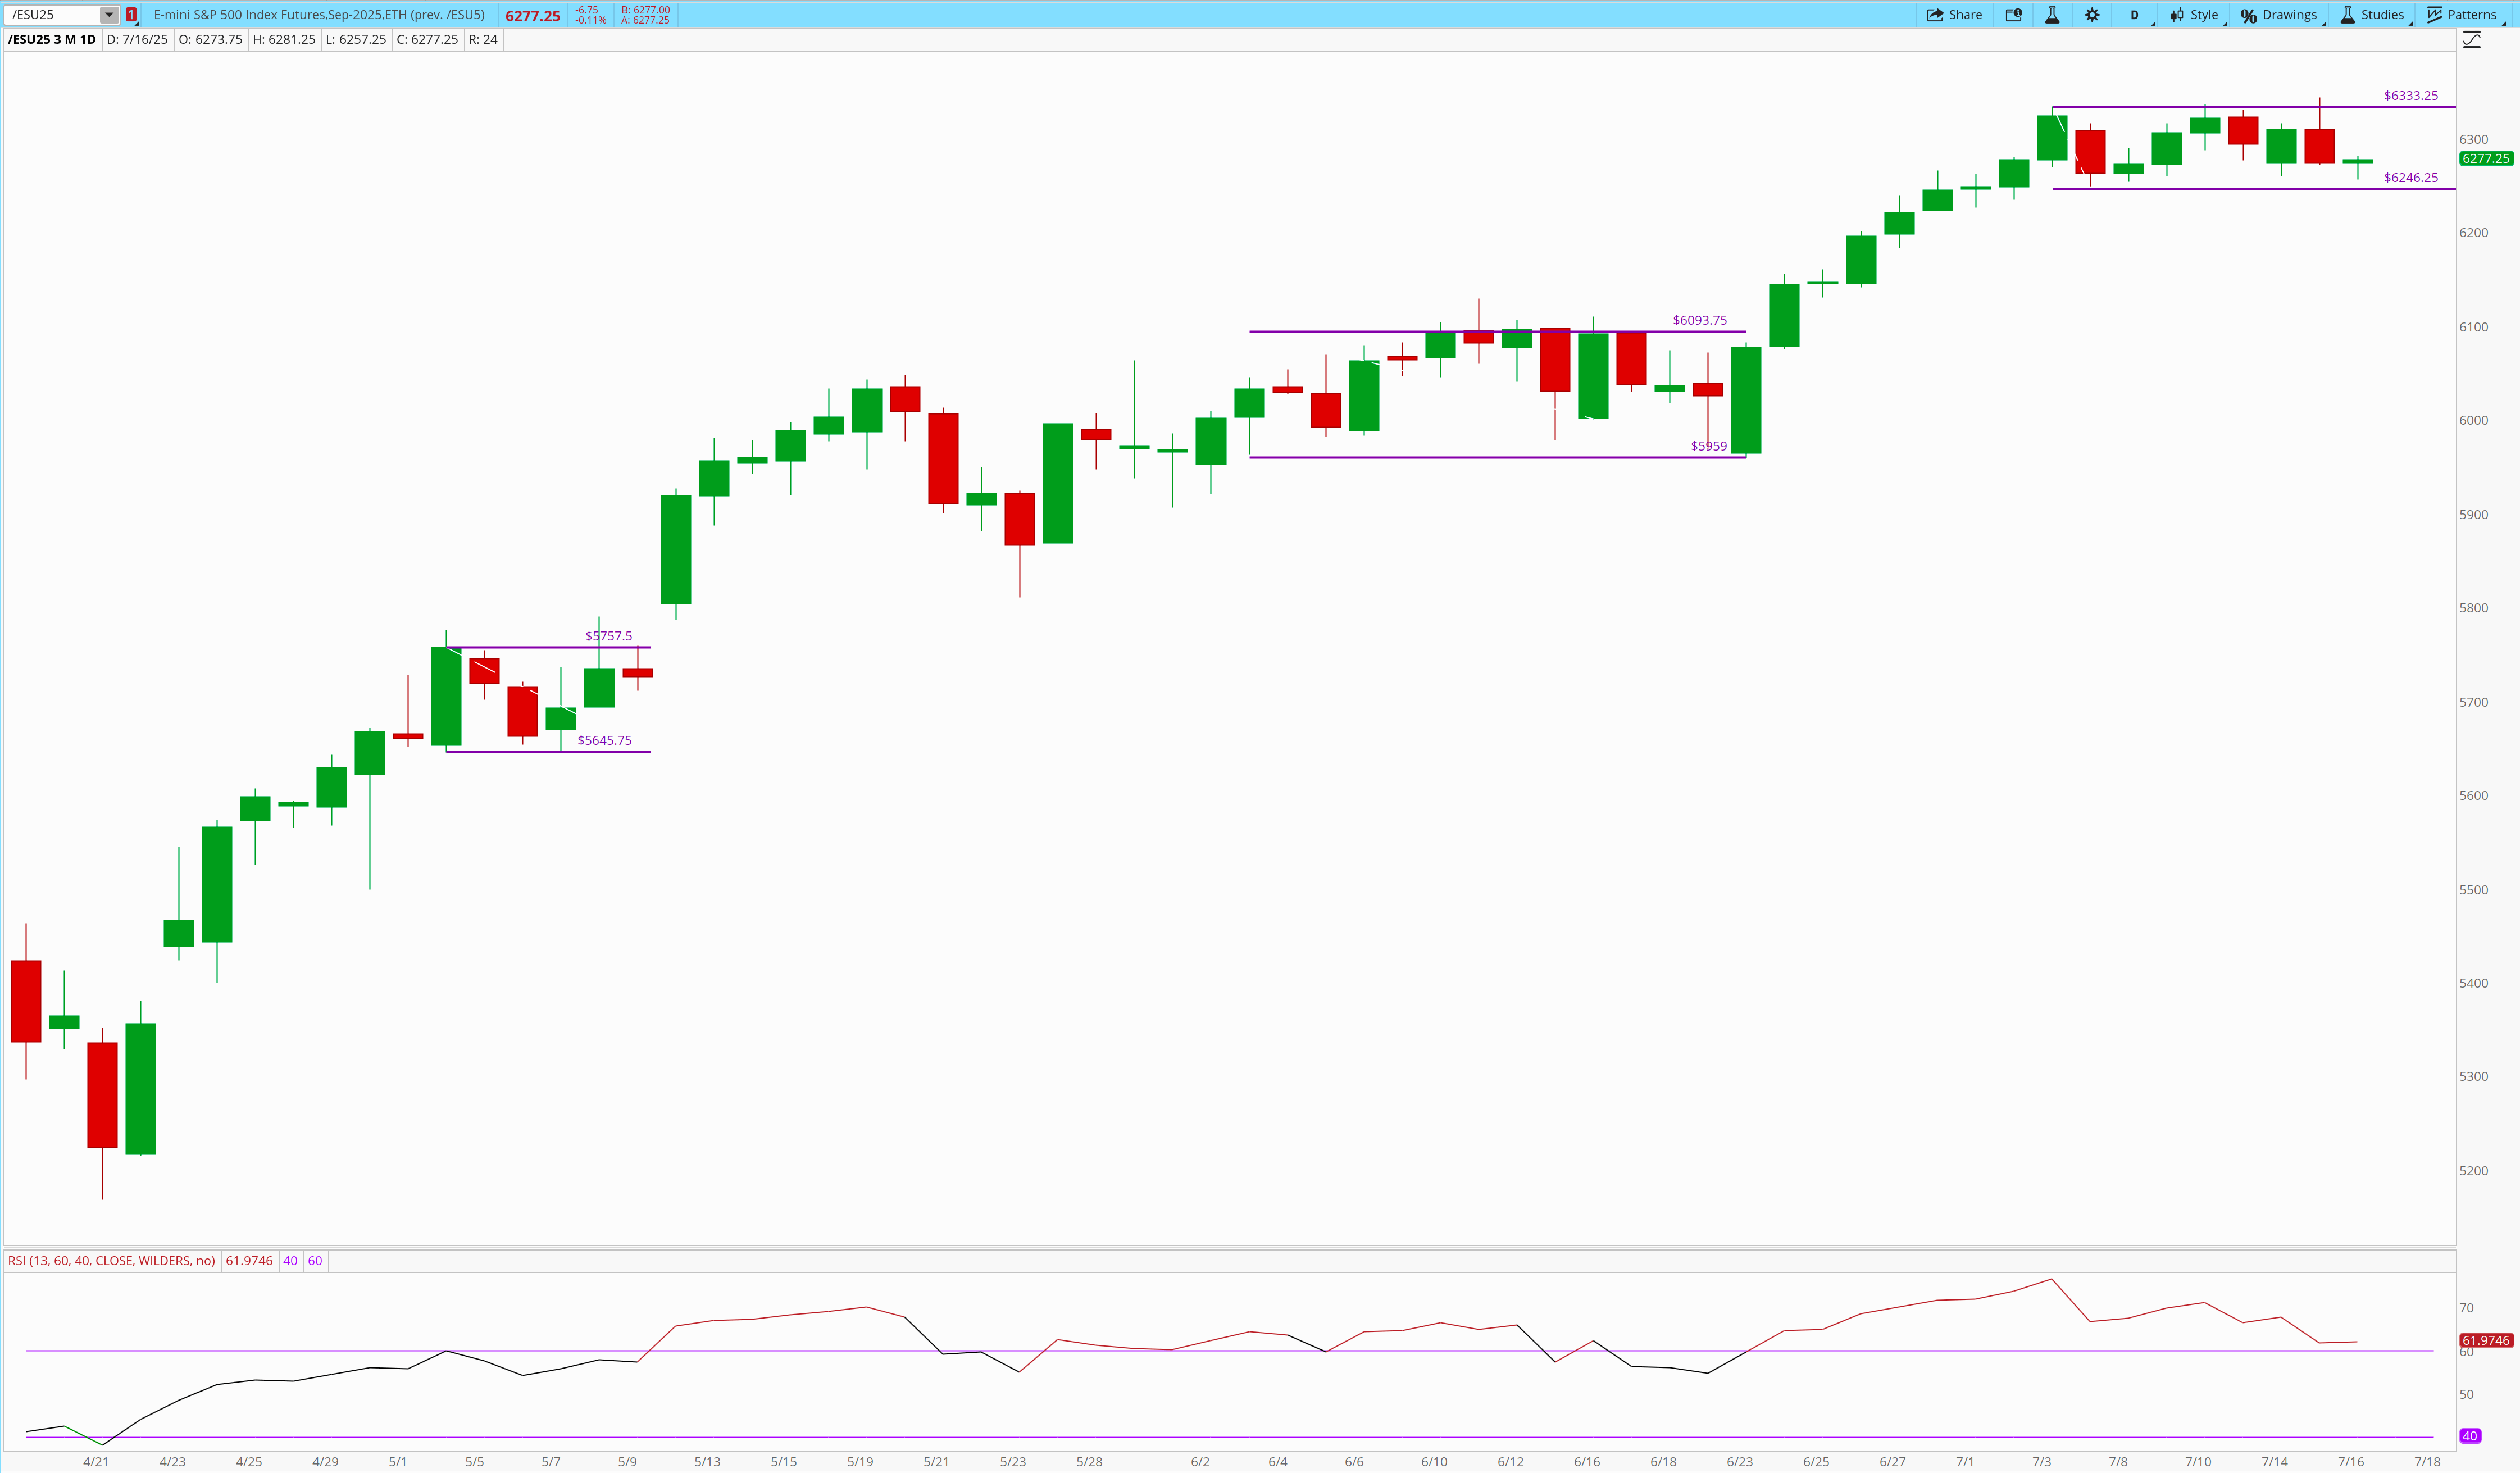
But during this remarkable climb, we’ve had periods of muti-day consolidations in wide ranges.
During these consolidations we can see that RSI falls as each day of the consolidation continues, but never dips below 40. At no point have we dipped below 40 on RSI. (I talk about what to look for in trend changes here).
These consolidations ultimately result in the next leg of the move. A leg that we never know which direction is going to go.
The fact remains though: most trends continue.
We are in one right now. But as we zoom in we can see a smaller story inside the large one.
Here’s the 4 Hour:
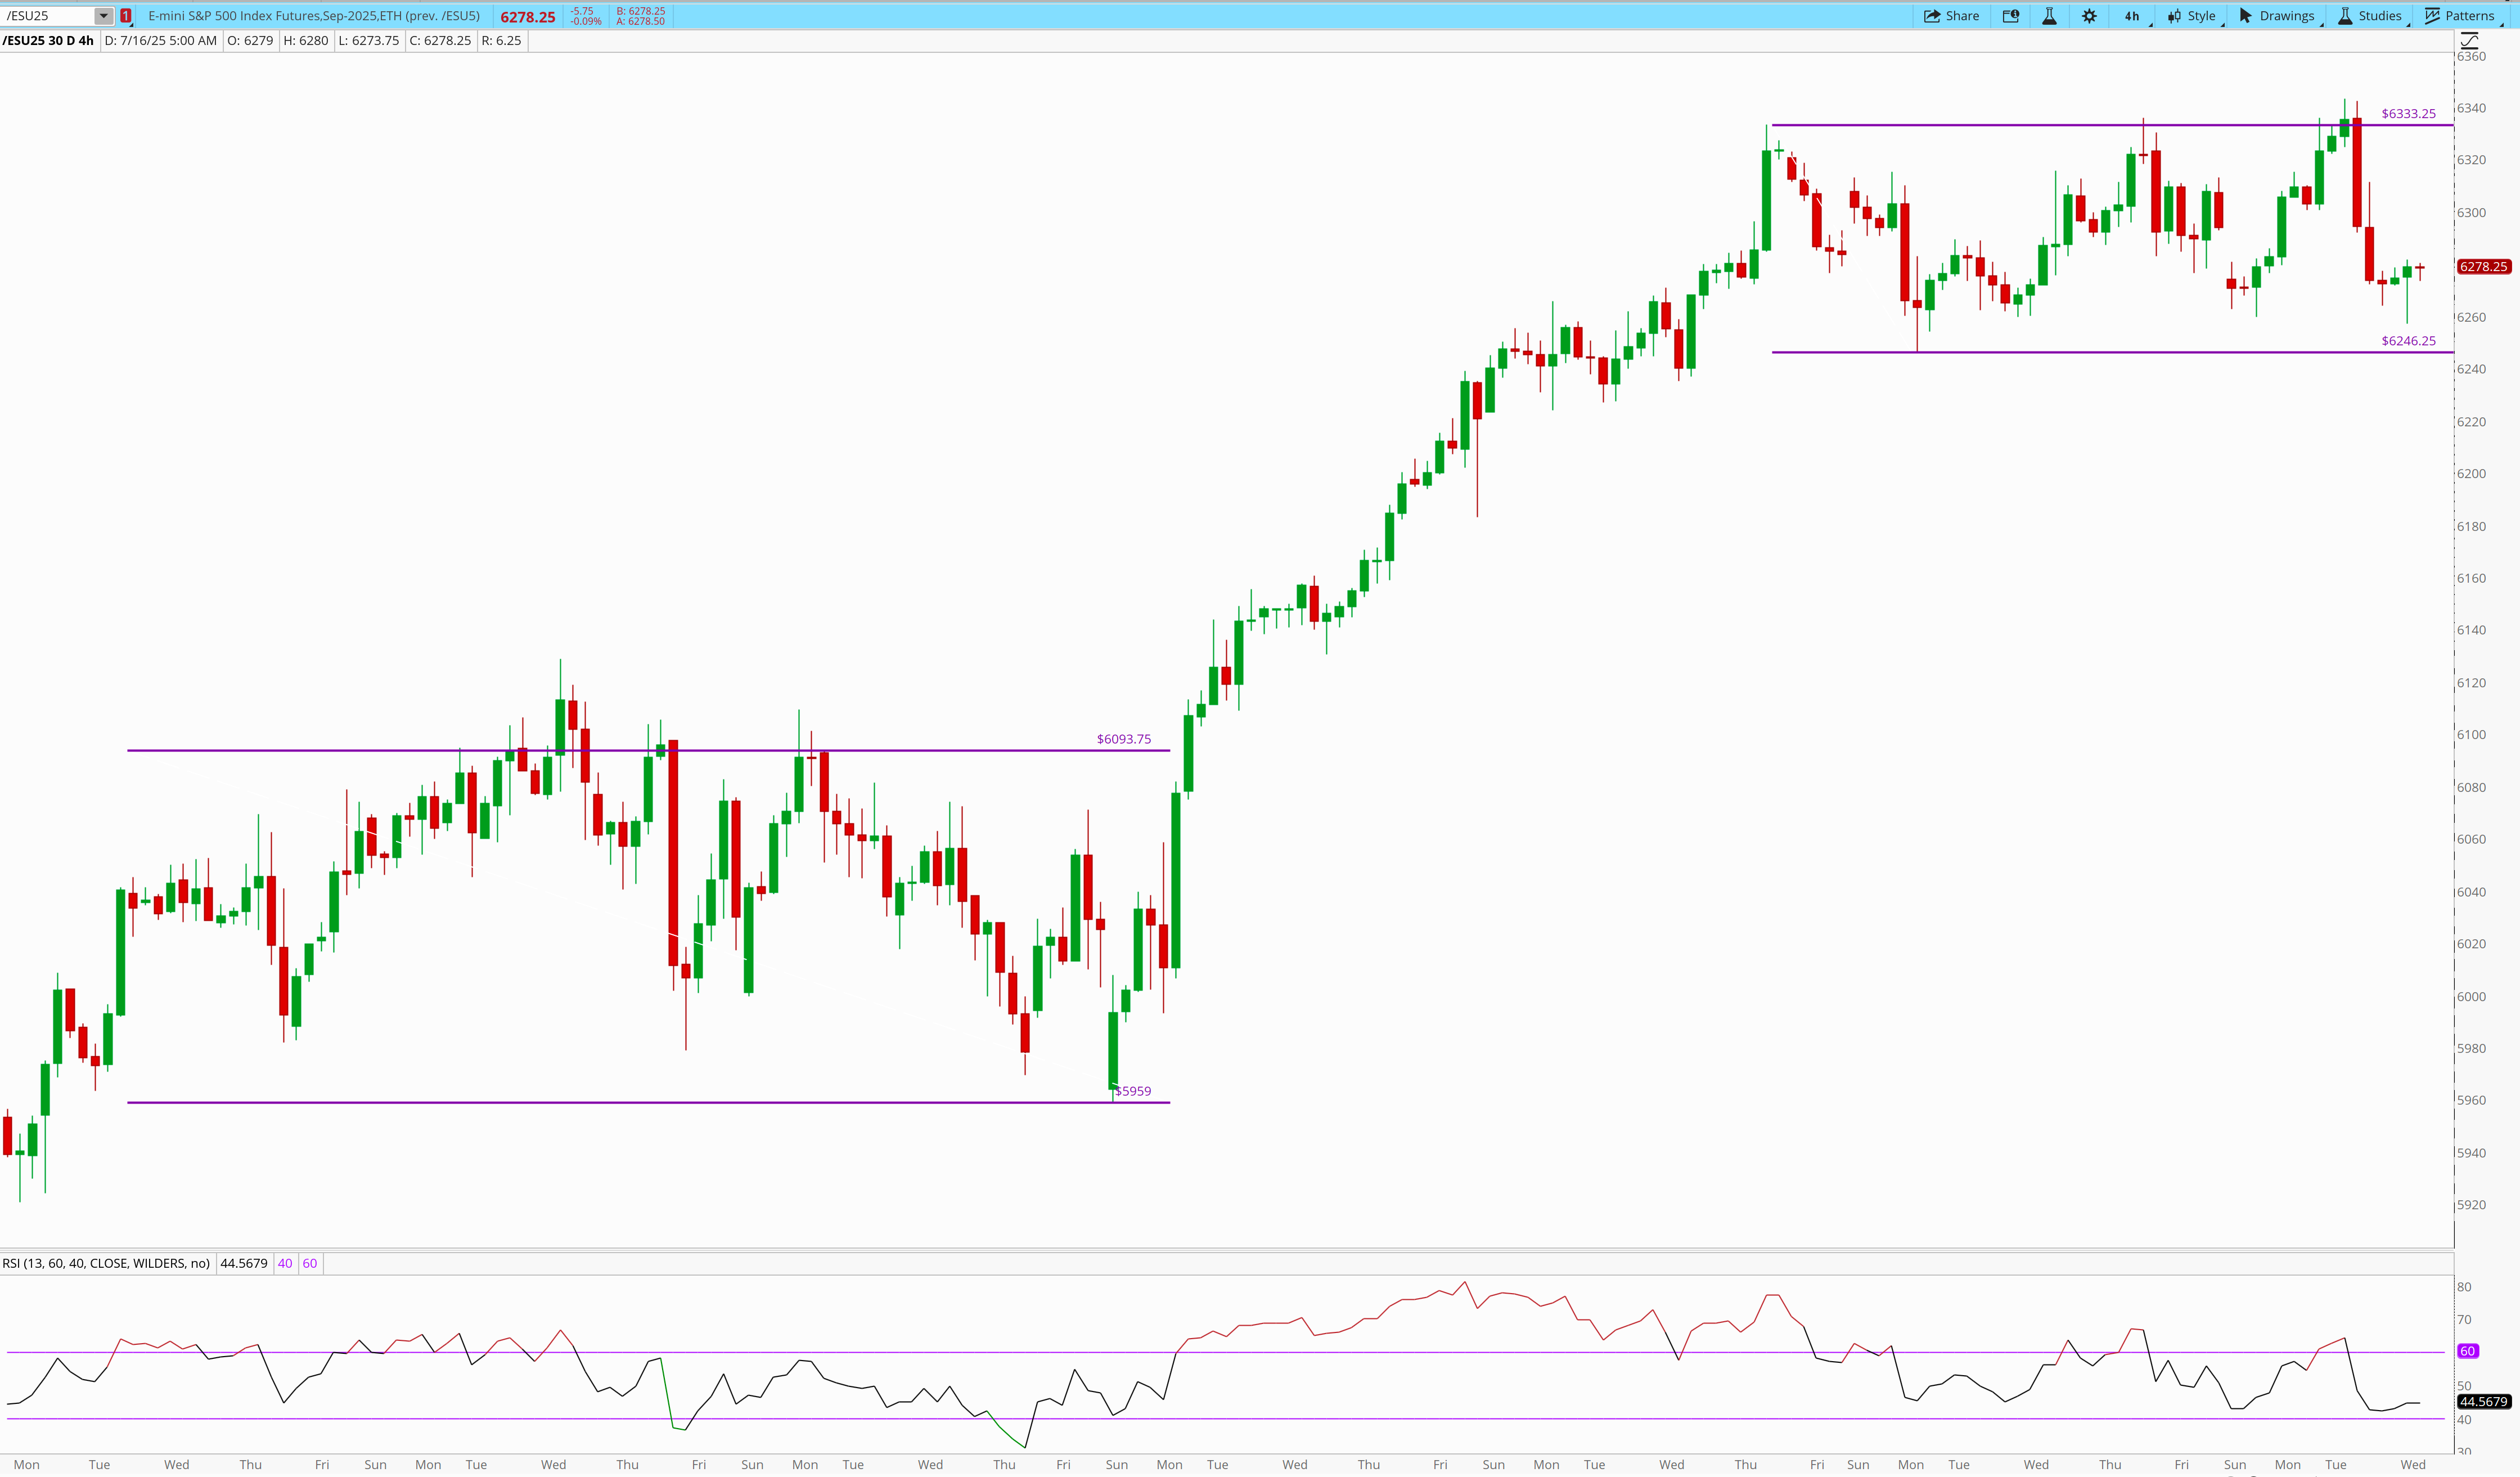
One thing that stands out here for me is the size of the impulses. Impulses are large, extended range candles that dwarf their peers.
ES has the ability to short squeeze like non other — breaching resistance point after resistance point inside these 4 hour candles. But we find that in most 4 hour windows, the impulses are to the downside.
This is because ES sells are like elevators going from the 10th floor down.
These elevator drops often result in a breach of critical reclaim areas, on the edge of the consolidation.
Institutional buyers don’t think in terms of 45 min
Let alone 5 minute windows…
The next 20 points are irrelevant to their campaign.
They think in terms of days, weeks, and 3 month periods.
If institutions believe their data on economic outlook leads to higher prices over the next quarter, they want to participate. They are also aware that most trends continue…
They want to be buyers.
But only at prices that give them an advantage. Only at prices where they won’t bid the price up on themselves.
We rarely see institutional orders take place in the middle of the curve, which is why most days result in “Chop.” When volatility comes into the market or when a key player causes large market swings (*cough* Trump *cough*), this chop can wider. We’re in a ~90 point chop now. 6333-6246
Where can they get their large orders filled without bidding the price up on themselves?
At areas where large selling takes place.
Often, at the low of the consolidation — the low of the chop.
I called these areas Critical Reclaim Areas
That’s the essence of structure breaches and reclaims.
This is where we find opportunity.
This is where large orders can be filled.
This is where I believe we have a true edge.
As we zoom in to locate these edges, we find ourselves in the 45 min chart:
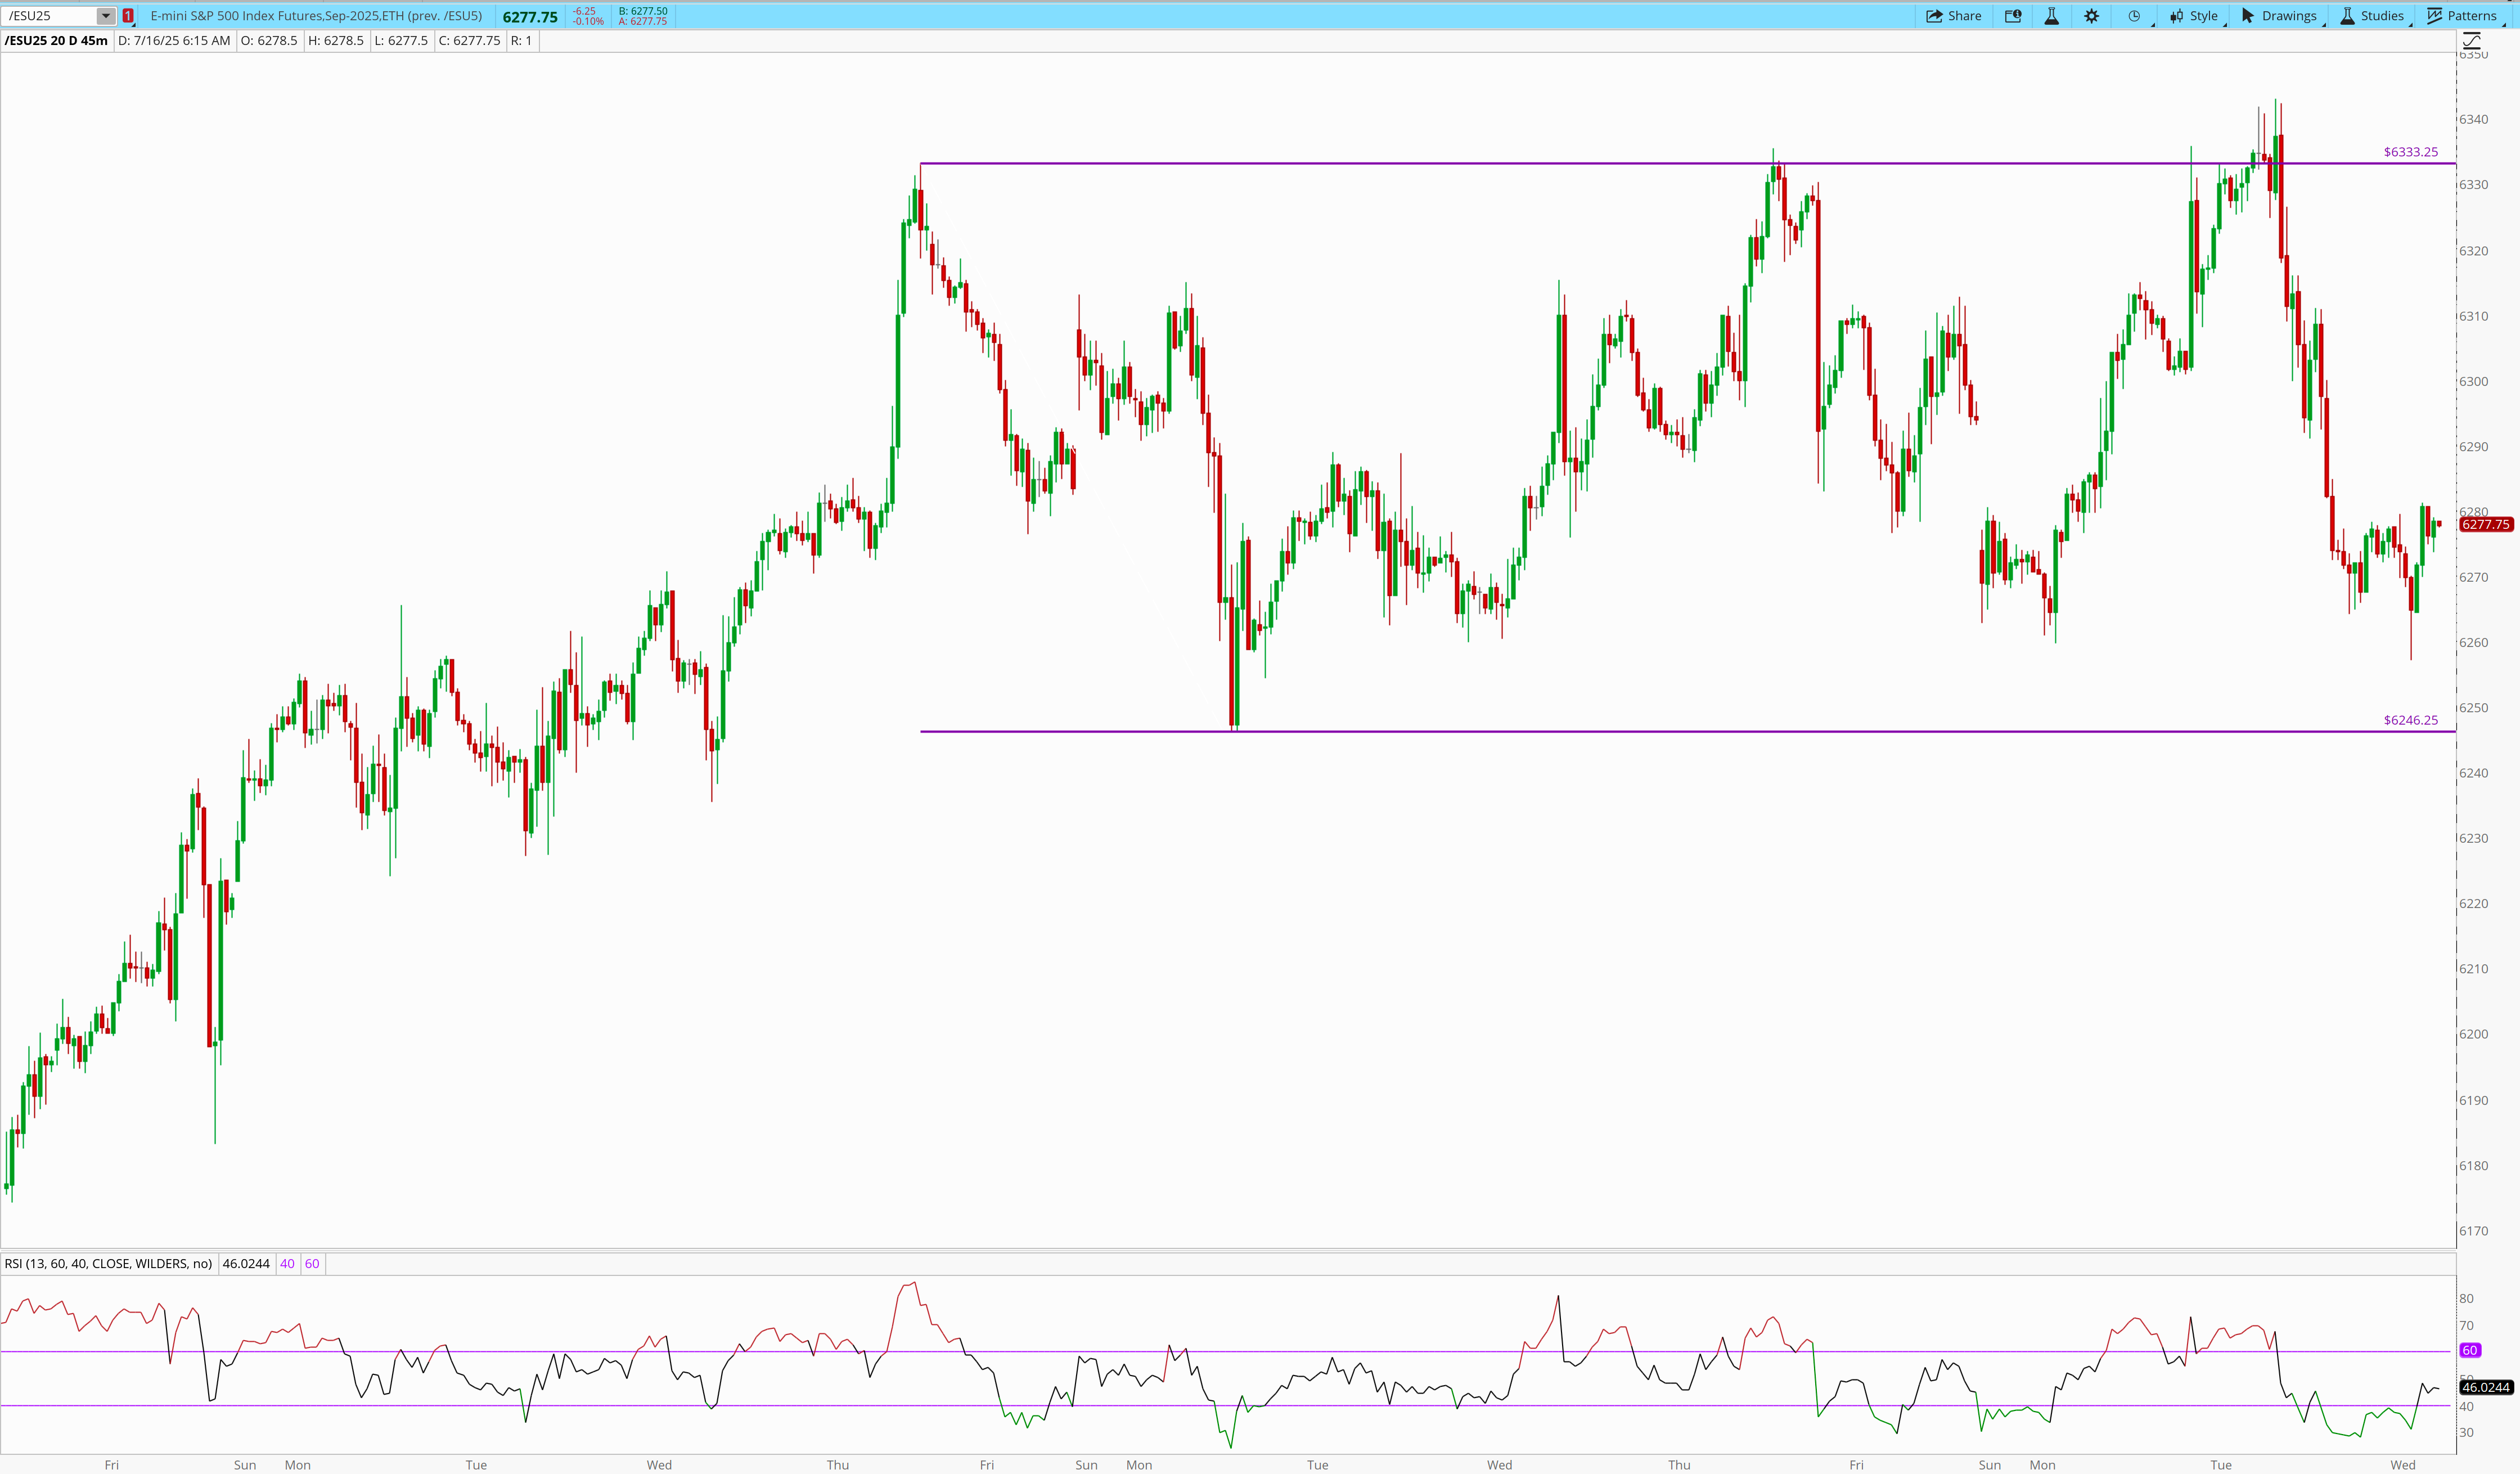
This wide chop results in edges that can offer real opportunity in terms of monetary gain and ES point value.
In Monday’s letter I discussed multiple opportunities we participated in.
Wednesday July 9th’s 6278 LTB
Thursday July 10th’s 6295 FBD
Friday July 11th’s 6283 FBD
And Monday the 6260 FBD and Tuesday’s 6301
Notice the price point of these trades.
Nearly all in the lower 3rd of the consolidation.
Nearly all hit T2
The ones in the middle or upper edge of the lower 3rd — 6301 and 6295.
Guess what happened?
Only T1.
This is what happens in trading.
When we take advantage of the critical reclaim areas at the lower part of the consolidation we’re participating when real buying steps in, helping to propel our trade in our direction.
We leave a runner because we never know when the breakout will happen.
We take T1 and T2 at the next level up because our job is to make money, not assume the high of the consolidation will be hit.
The better we can wrap our heads around understand what is outlined above, the easier it is to ignore most moves.
Let’s get into today’s opportunities as price is printing 6278
Likely Supports For 7/16 are: 6273, 6270, 6264, 6260(CRA), 6252, 6250(CRA), 6245 (D), 6236 (CRA), 6227, 6222 - 6217(D), 6208(CA), 6199, 6183 (CRA), 6176 (CA)
Likely Resistances For 7/16 are: 6280, 6284(CA), 6290, 6295-6300(S CRA), 6306-6310(S), 6314, 6319-6326(S), 6332, 6340, 6345, 6348 (CRA), 6352, 6359, 6365(CA)
I wrote this Monday and it came to be this morning:
One could potentially look at the 6260 again if we unwind from here
As price is attempting to use this mornings 6260 FBD as a bottoming point (I got long around 3:15AM with others inside the chat. My avg price is 6260.97) we can look above and see there is a lot of work to do. Level on level supply zones are overhead as a result of the selloff that occurred yesterday.
Bulls will look to see these level on level supply zones hit with momentum in there favor. If this occurs will likely see any reactions at these supply zones bidded up. In addition, they won’t want to see below 6268 hit. This is their ultimate scenario.
As always I defer to the trend until I’m told otherwise.
📈 Opportunity #1 FBD 6254
Last Monday we bottomed at 6254 at the evening session open, right in the beginning of the consolidation window period that we’ve been living in. If price breaks down from here (6280) and creates a new low this would be the first area I’d want to be alerted. Entry criteria and price behavior desired would be a flush below 6254 that forms a bottom above 6248 and reclaims with size. The fact opportunity 2 is just below this inherently leads me to believe if price determines this is the bottom, it will be a fast move. Any bullish candle pattern could result in entry so long as the fill is close to 6255. Position sizing will be smaller than normal in this scenario - a rapid exit.
📈 Opportunity #2 FBD 6246
The tweezer bottom from last Monday is an obvious opportunity for a FBD if selling persists today, same one printed earlier this week. It’s just below Opportunity 1 so a deep flush may not occur. A drop below this area that forms acceptance that ideally finds it’s low above 6236 would be the setup I’d be looking for. A hard flush… a low above 6236, a test up, a failure that has a higher low, and then a strong reclaim of the tweezer bottom. The reclaim would be the trigger point on a shallow flush. On a deeper flush, to reduce risk, we could wait for a reversal pattern to display it self, create higher lows in the midst of divergence and enter.
Honorable mentions
6284 reclaim breakout
- 6222 - 6217(D)
For short sellers selling at the supply zones listed above offer opportunity. Remember, my requirement is selling at supply with RSI lower than 60. It’s counter trend, but for those that think this consolidation window’s next leg is down, the high r:r: is selling at supply areas.
Trade safe.
I’ll be in the chat and updating as new opportunities present themselves.
If you found the top level breakdown in today’s newsletter educational, share it with others by clicking the button below.
We’re all trying to grow
Thursday July 17, 2025

“Trading rewards patience—not action.”
Long-time ESDaily readers know how deeply I believe this.
It's not just a motto—it's the cornerstone of lasting success in this business.
Less is more. Overtrading is the reason most traders fail. There simply isn’t always a trade worth taking.
Most traders know this... but still fall into the trap. They zoom into price, see the frenzy unfold, and feel pressure to participate.
They respond to impulse.
They abandon the work they did hours earlier.
They buy because it’s going up.
They sell because it’s going down.
and just like that…
They throw everything they know out the window in an effort to participate
Your job—our job—is to kill this instinct.
Every single day.
On Tuesday I said this:
“I hope the idea of “being different” when it comes to trading sits in. “
Being different means you're consistent when others are reactive. It means you bring structure where others chase noise.
It shows up in your:
Preparation
Price behavior analysis
Setups
Execution
Profit-taking and risk management
And how you scale
This is how we trade with clarity. And this is why we stay green.
Yesterday I talked about structure
I think it’s worth a re-read.
I write Gameplans each day from a top down level approach. The newsletter yesterday details how I go through that process and why I believe the setups I deliver offer an edge to traders.
For those who followed, we’re up 70+ ES points from our 6246 opportunity.
The precision here from ES is remarkable.
But I wasn’t guessing.
I was using what I wrote about Wednesday morning as a framework for how ES prints price, and where real money is about to step in.
And why…
It worked quite well as you can see below.
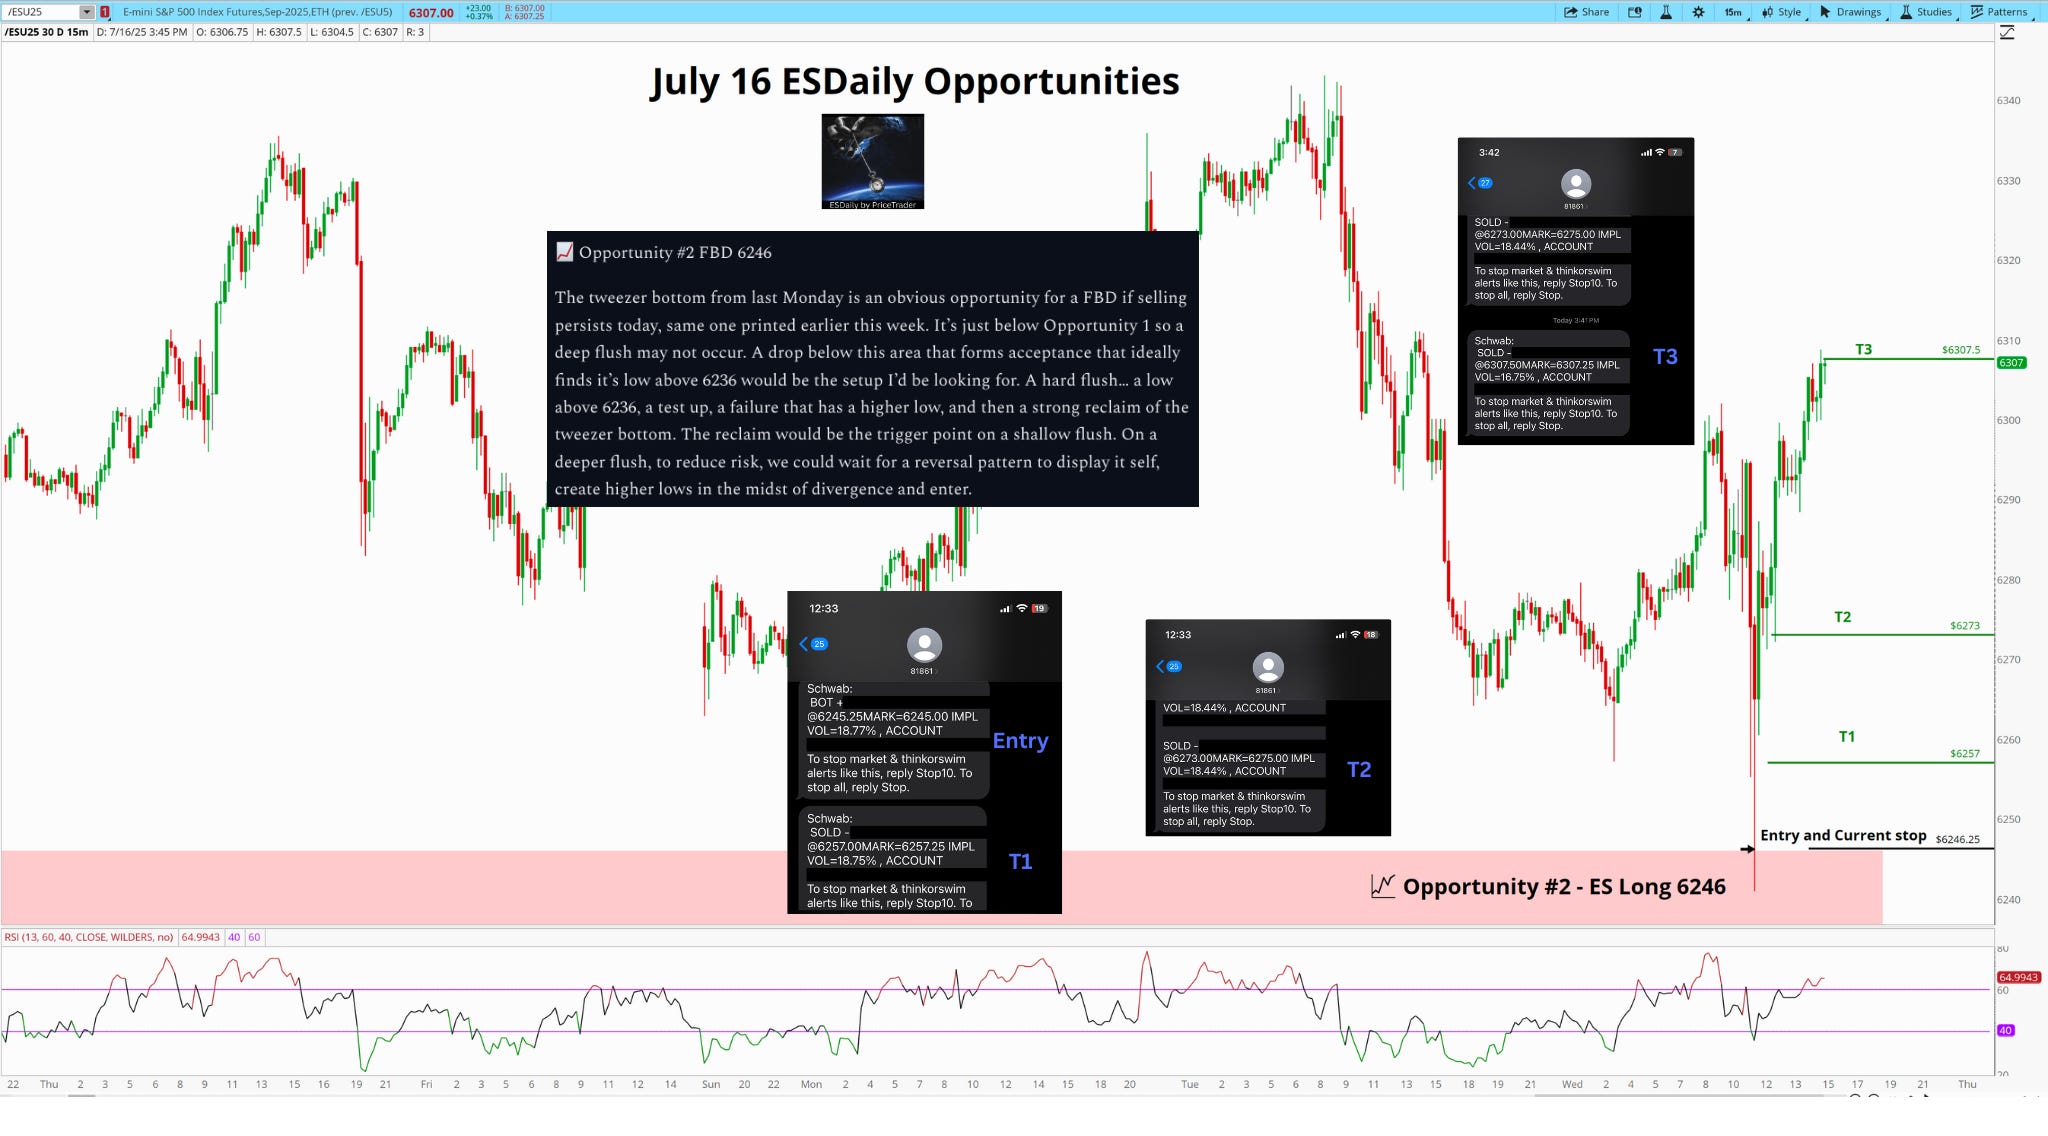
Here’s a chart below of the image I share with readers yesterday about where we were in the structure, on the right hand side of the image, I’ve included what’s happened since with a shade of light blue.
You can see that ES held the structure.
You can see the idea that institutions use what I call critical reclaim area breakdowns as price points in which they can fill their very large orders
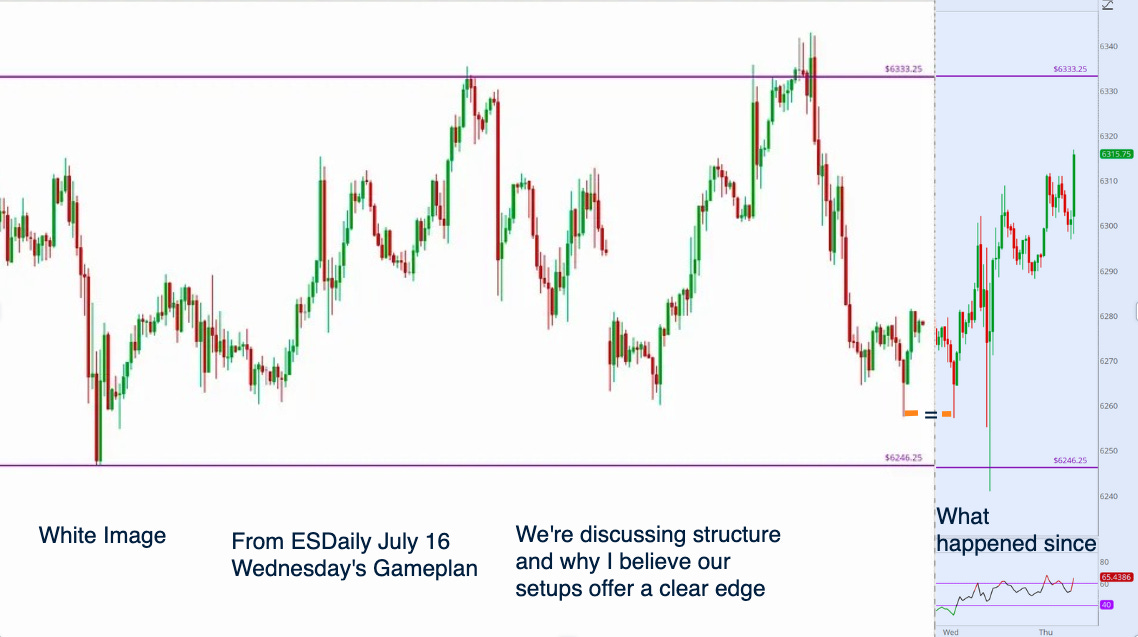
Then, you can see chasers chase price higher. As price reaches resistance areas and fades 10-20 points, you can see dip buyers bidding up the price, resulting in a higher high then when the dip started. Trend followers and EMA traders and breakout traders start buying. You can then begin to see RSI stay above 40.
All of these things propel ES in the direction of our trade
Yesterday ES put in a masterclass if you know how to read price.
Opportunity defined
Patience in waiting even when ES was printing 6300
Patience as price approached the lvl (I’ll include the screen shot of my chat notes as price was coming down here:
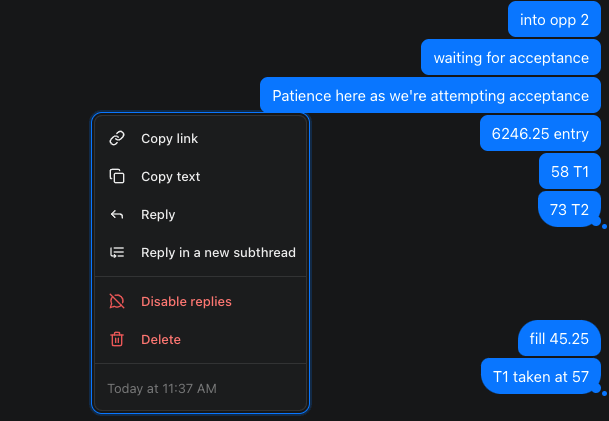
Execution when price displayed the required behavior
A beast of a failed breakdown. Right where the opportunity said it would.
I urge myself each day to remember why the edge I have works and resist the impulse to trade when an edge doesn’t exist.
I think everyone should remind themselves of this daily as well.
So where are we at now? Where are other opportunities
Since I’m long ES 70 points below (here’s the 6245.25 trade review link) I’m not pushing anything here.
We’re in the upper 1/3rd of the consolidation window.
My job is to wait for great setups.
Not to trade just because the market is moving.
Let’s get into today’s opportunities as price is printing 6310
Likely Supports For 7/17 are: 6298, 6293-6290, 6283, 6279, 6273, 6270, 6264, 6259, 6252, 6245, 6241, 6236 (CRA), 6227, 6222 - 6217(D), 6208(CA), 6199, 6183 (CRA), 6176 (CA)
Likely Resistances For 7/17 are: 6306-6310(S), 6314, 6319-6326(S), 6332, 6340, 6345, 6348 (CRA), 6352, 6359, 6365(CA)
📈 Opportunity #1 6288 FBD
After yesterday’s impulse up we formed key support at 6288, one that bulls will want to defend ferociously. Because there’s not too much below. If we flush this area and find a bottoming by 6279 one could catch some points on a reclaim of the area around 89-90. But, if we come in very weak, I’m prepared to sit out. Each time we’ve taken trades in the middle of this consolidation we’ve only hit our first target (remember this when profit taking) and we’d want to be aggressive with our targets. Doing less would be a gamble that we’re going to break out.
📈 Opportunity #2 6271 FBD
Very similar to 6288 - After yesterday’s impulse up we formed key support at 6271 as well, one that bulls will want to defend as a final last stand. If we flush this area and find a bottoming by 6264 one could catch some points on a reclaim of the area.
I’ll be in the chat and updating as new opportunities present themselves.
Let’s trade well today.
I’m pressing today to remind myself to not do too much.
Remember:
Trading rewards patience—not action.
Friday July 18, 2025
Letting the Runner Work — Why I Didn’t Chase Thursday’s Breakout

We came in holding the 6245.25 long, sitting at the upper third of the consolidation window.
Gameplan was simple:
Wait for great setups.
Not just movement.
Not just momentum.
Structure + edge = entry.
Everything else is noise.
I was open to adding — but only if price gave me a valid reason.
It didn’t.
ES respected every first-level support, and then finally broke out of the July 3rd–17th range in the overnight session.
That same sequence repeated all day:
Tag first-level support
Bounce cleanly
Revisit supply
Pull back 15–20 handles
Tag the next first-level support
Bounce again
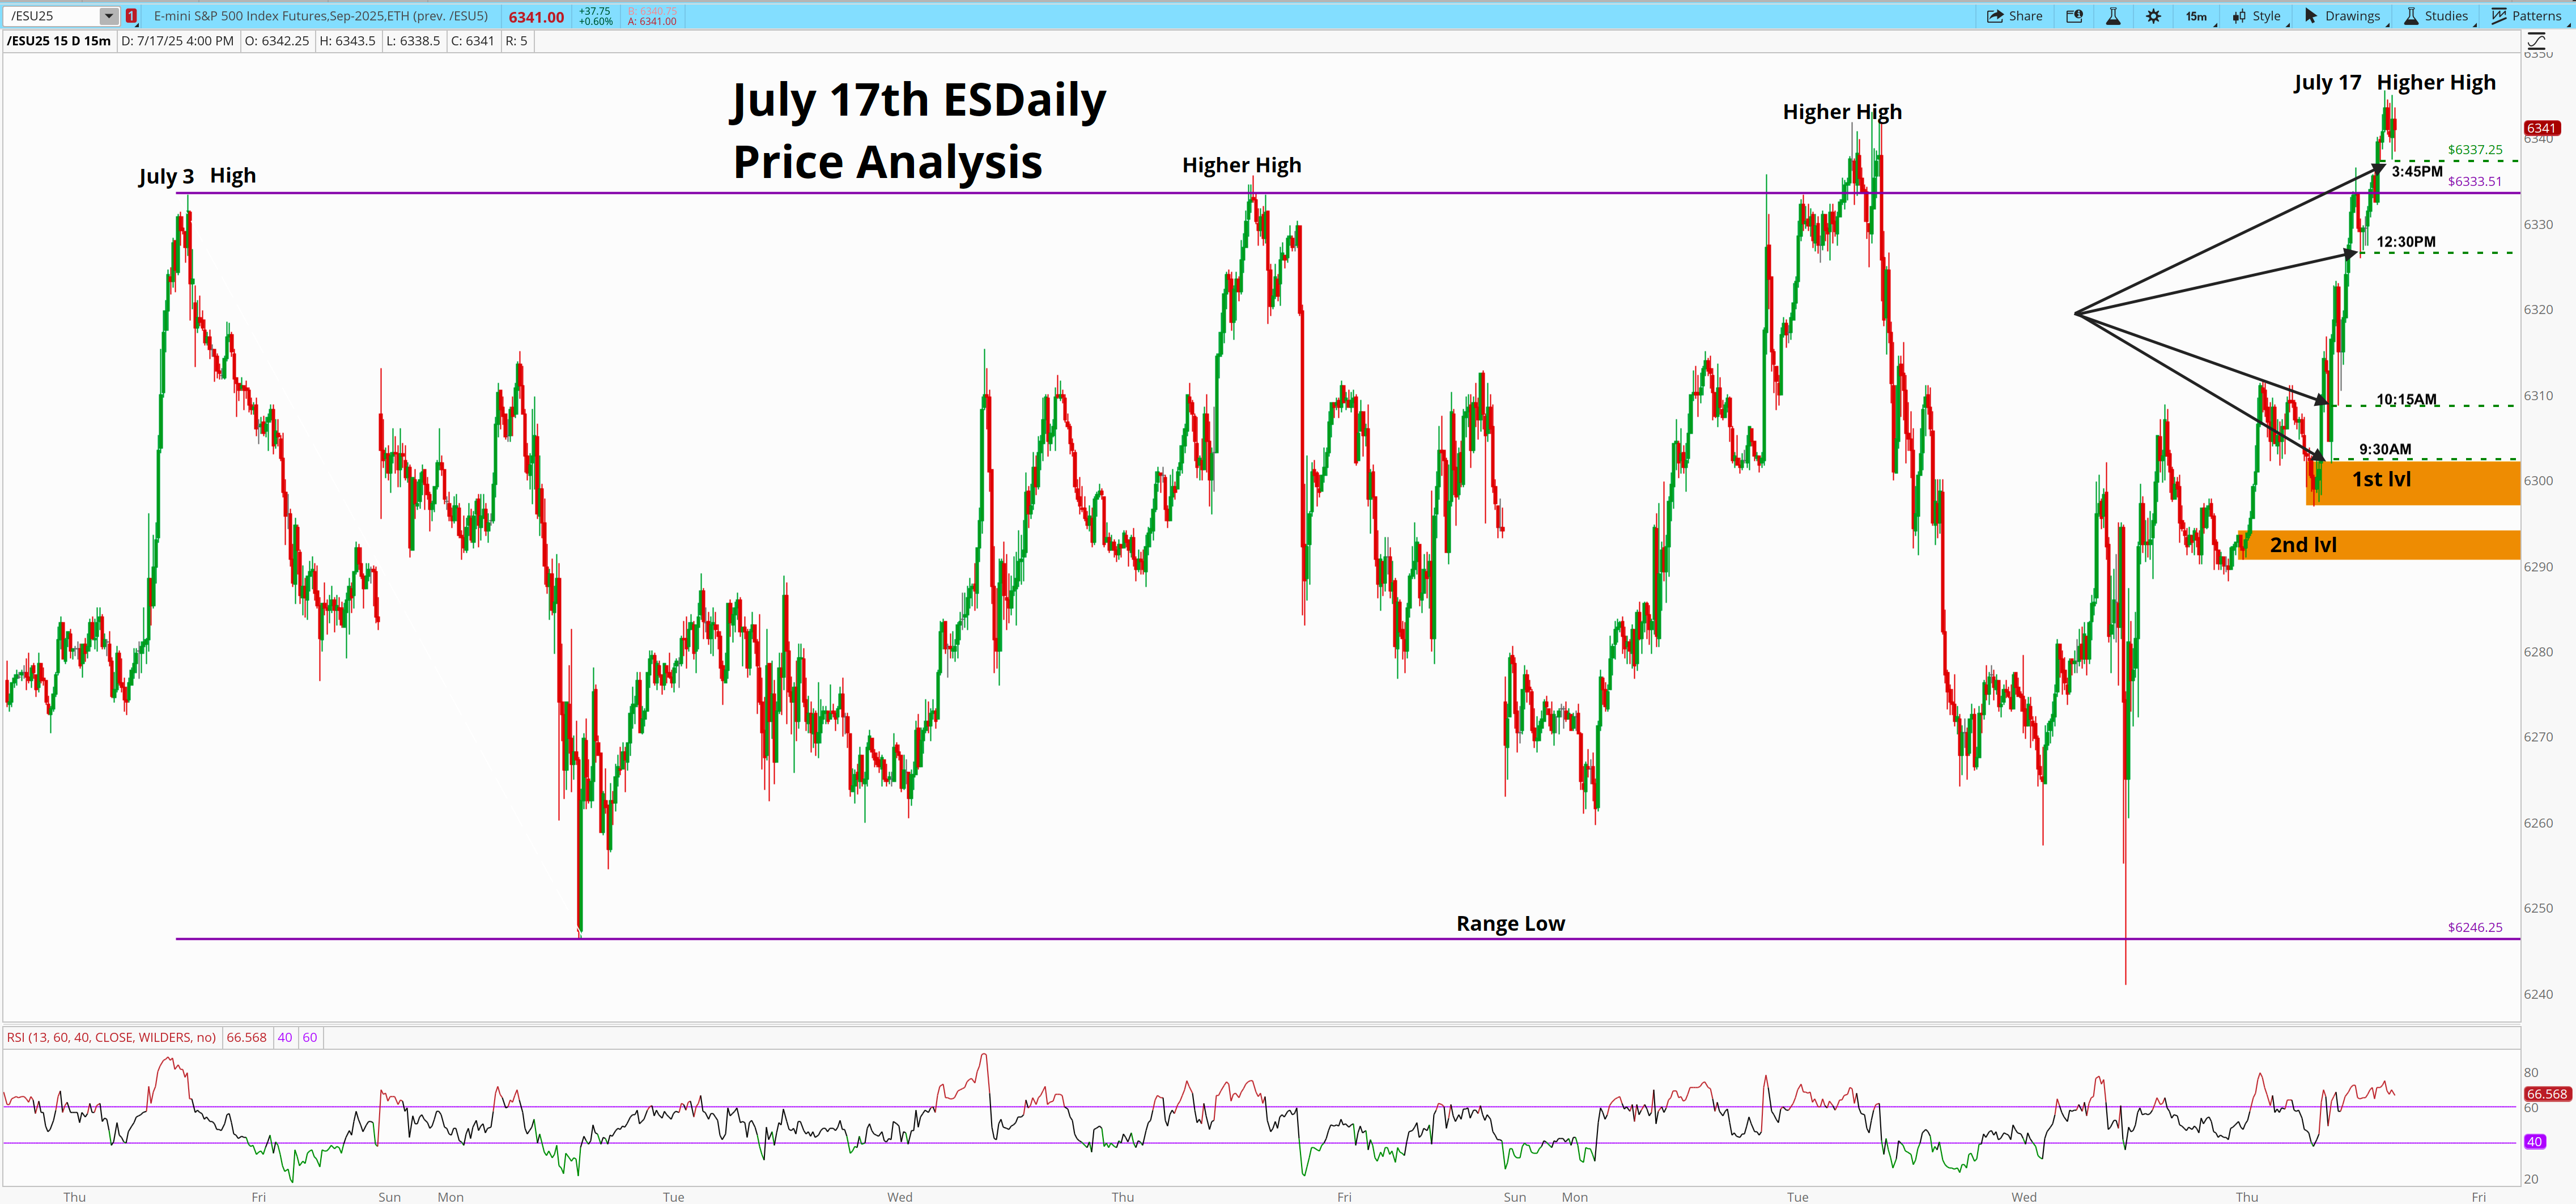
Intraday trend followers were rewarded.
And we saw it play out in real time — the sequence matched the July 17 Gameplan almost perfectly.
But...
I didn’t buy.
Not because the market wasn’t moving.
But because the risk/reward was gone.
Price was:
Sitting at the top of a range
Reacting into layered supply
Holding above RSI 60
Sitting just beneath a potential breakout
These are the areas where chasers get trapped.
Not where I build size.
Here’s What Most Traders Miss
If you make a habit of:
Buying first-level pullbacks at the top of a channel...
Buying into layered supply...
Buying just because “it’s running”...
That’s not edge. That’s emotion.
And over time, that behavior will bleed your account.
I’ve done this long enough to know where the real odds live:
Where structure shows likely liquidity pockets
Where failed breakdowns trap sellers
Where large orders get filled
Where smart money enters, not exits
So I waited
I let the 6245.25 runner work.
Could I have chased? Maybe.
Would it have worked yesterday? Probably.
But most days aren’t like yesterday.
Most days, ES chops.
Most days, buying high means getting punished.
Scalpers and Chasers Were Rewarded — and That’s What’s Dangerous
The first thing most scalpers and day traders ask is:
“Where are we going next?”
If you want a long, successful career in trading, try flipping the question:
“Where’s the edge?”
“Where’s the structure?”
“Where are the actual opportunities?”
Edge doesn’t come from buying first-level pullbacks at the top of the range.
It doesn’t come from buying into supply.
It doesn’t come from chasing channel tops.
Over time, doing that doesn’t just lose money — it kills conviction.
This week has been a textbook on failed breakdowns at the edges.
The traders who waited?
They won.
The ones who chased?
They got lucky. (For now.)
But edge isn’t about luck.
It’s about discipline.
Here’s what I’m looking at considering the structure of ES with price at 6347:
Likely Supports For 7/18 are: 6344, 6341, 6333, 6327(CRA), 6320-6317, 6315-6311, 6308, 6305, 6301-6297, 6293-6290, 6283, 6279, 6273, 6270, 6264, 6259, 6252, 6245, 6241,
Likely Resistances For 7/18 are: 6348, 6350,6354, 6359, 6361(CA), 6364, 6372 - 6375(CA), 6381, 6385, 6389, 6397-6402, 6418(CA), 6427(CA), 6433, 6439, 6443, 6457(CA), 6465, 6470(CA)
📈 Opportunity #1 6334-6326 LTB
We broke out of the range we’ve been in and topped at 6357. We’re pulling back inside the range after traders digest this move and the 6330 level offers demand — the place that propeled us to the breakout. This is the first major level I see on the chart. I’d want to see RSI above 40. If we come underneath 40, I’ll be waiting to either take a confirmation trade or wait for a breakdown of the 6327 to as low as ~6323 and looking at a reclaim of the area. The approach to this zone is crucial. I won’t want a slow grind into the level that hovers around 6337. I’d want to be a move that allows room for our T1 to work for our R:R.
📈 Opportunity #2 6311 FBD
Note: above this is a 5 minute demand zone at 6317-6320 (this could be an area where we get a reaction first as it would be a retest of yesterday’s ORBO). 6311 is Thursday AM overnight high and 11:20AM bouncing point and it offers a well define area where we could large orders being filled on a reclaim. A flush beneath this area that forms acceptance above ~6305 and reclaims would be something I may be willing to participate in.
If we selloff hard today and go back to the bottom of the range, 6289 and 81-71LTB are below and areas of interest as well.
I’m sticking to the trend and holding the runner long with stop at 6280. Only engaging in areas that offer an edge and not thinking that just because 1st level pullbacks worked yesterday, that they are going to work again today, at the top of the range….ES needs a breakout that is confirmed before we are done with this channel range
Let’s trade well today and remember where we are in the structure.
🧠***ESDaily - My Thinking - My Trade Rules***🧠
This is the backbone of consistency in trading. Repeating what’s outlined below:
day-after-day, rain or shine, noise or flow…
Every.
Single.
Day.
What’s outlined below helps strip away hesitation and eliminate decision fatigue. When the rules are clear, there’s no need to think—just execute.
I can’t say this loud enough:
*Take the majority of profits at T1.
If I could write it in blinking lights, I would.
It’s that important.
We do this for one simple reason—it keeps the win rate high.
-If T1 hits and we stop out after? We’re still profitable.
-If T1 and T2 hit? We move the stop to breakeven and let a runner work.
-If T1, T2, and T3 all hit? That’s a big win—and we’re still in if ES wants to push.
Just look at the Scoreboard. The results speak for themselves.
This system works because we take profits early and we’re surgical when it comes to managing risk.*We always leave a runner when permitted. The runner is the unlock.
It reduces FOMO.
It keeps us mentally level.
It frees us from trying to nail the top.
We take most off at T1, and we stay patient, ready to build back in as the tape develops.*Limit your trades.
Know when there’s opportunity—and when there’s not.
It’s hard to sit still. I get it. But learning to wait is a core skill in this business.
We don’t earn steady wages.
We get paid when we execute our setups, with discipline, in the right spots.*The market doesn’t hand out trophies for participation.
Too many traders stack early wins, only to give them back with one bad decision.
One overtrade.
One impulse long.
One “I’ll just try this” at the wrong time.
That’s how edges disappear—and capital evaporates.*Trading rewards patience, not action.
Sit on your hands until your spots come to you.
Let the setup build.
Let the tape reveal its hand.
If it’s not clean—skip it.*The job is not to trade all day.
The job is to extract high-quality risk from the market, and guard your capital like it’s your newborn baby.*Each session is a building block laid on top of the previous day.
Before we can trade well, we need to understand where price is, what structure has been created, and what new structure has evolved since the last session. This helps to identify where the next opportunities exist — which areas are critical — and which are not. That’s why I spend so much time on the trade recaps. I had slight heart palpitations pulling these from the daily letter😂, — Because they are that important. Just because we’ve moved them to a separate page, please make it a habit to review the trades. The winners and the losers. Patterns repeat. Structures evolve. If you know what to look for, it becomes fluid.Wait for the setup → Execute by the rules → Rinse and repeat.
The real work is in the prep.
🧠Why Does ESDaily Strategy Work?
You can see all the different types of trades we take here.
Are they all home runs? No.
Are they all perfect? Definitely not.
But our win rate stays high because we stick to our rules—tight risk, smart profit-taking. That’s what keeps us green.
If T1 hits and we stop out after? We’re still profitable.
If T1 and T2 hit? We move the stop to breakeven and let a runner work.
If T1, T2, and T3 all hit? That’s a big win—and we’re still in if ES wants to push.We always leave a runner. The runner is the unlock.
It reduces FOMO.
It keeps us mentally level.
It frees us from trying to nail the top.
Because we’re already in.We take most off at T1, and we stay patient, ready to build back in as the tape develops.
🧠That’s the key: we’re not chasing the whole pie—
just a clean slice.
We need to take a PIECE of the action, not get all of it.
…Remember, we may just be provided 1 or 2 great opportunities a day. We don’t need multiple.
If we nail it, cool.
If we miss it, cool.Our job is to identify opportunities before they happen, and then execute.
🔑🧾Key Level Codes -
Demand (D)- A high-quality institutional zone where aggressive buying significantly outweighs selling, often leading to strong upward moves that follow thru.
Supply (S) - A high-quality institutional zone where aggressive selling significantly outweighs buying, often leading to strong downward moves that follow thru.Critical Area (CA) - A key level where often support becomes resistance or vis versa
Critical Reclaim Area (CRA)- Not to be confused with CA, CRA is key level where, if reclaimed by bulls or bears, momentum shifts decisively in their favor, often confirming direction with stronger conviction.Level Track-Back (LTB) - A key level price may revisit before continuation
Failed Breakdown (FBD) - When price breaks below support but quickly reclaims it, trapping shorts and often fueling a move higher.
Failed Breakout Reversal (FBR) – When price breaks above resistance but quickly falls back below, trapping longs and often triggering a move lower.Channel Top (CT) - The upper boundary of recent price. Often acting as resistance.
Channel Bottom (CB) – The lower boundary of recent price. Often acting as support.Breakdown (BD) – When price falls below a key level with momentum and room to run, signaling potential continuation lower.
Breakout (BO) – When price pushes above a key level with momentum and room to run, signaling potential continuation higher.For added confluence, please refer to the Core Strategy and Odds Enhancers
🧠Wait for price to tell you where it’s headed — then react.
Do not forecast or assume.🧠Follow our rules, protect our capital, size risk accordingly, take profits when they’re due, and only take Grade A+ setups
We’ll have to wait and see what price delivers today.
As always, stick to the plan.
Note: Important Note: In 94% of trading sessions, ES moves less than 2%. Prices listed as support/resistance are reference points on the chart I am watching as likely bouncing/turning points for price within a 2% range of price at the time of writing. Not all supports and resistances are “engage-able”. Most are not. There’s a time to engage, and a time to watch. I do not buy/sell these. I’m tracking, taking profits, and using them as confluence to trade ideas.
This post will be updated once a day each morning to reflect new levels as ES evolves. The previous days opportunities and support/resistance areas will be left as reference.