
August 11 - August 15 ESDaily Gameplans
Last Updated - August 15 6:31AM

August 11 - August 15 ESDaily Gameplans
New traders to the ESDaily —
Welcome! And from the entire crew here, thank you for your support🙏.
Existing members: Let’s give a warm welcome to our most recent traders who joined last week:
👏👏👏
Ali, Khudhur, Ronnie, Christopher, Walter, Spencer, Adam, Dean, Joe, JChaney, Warrior, David, Paul, Jaydeep, Kurt, Rich, Le, Jay, CMW, Tony, Scott, Manny, Cliff, Denny, MrGeek, Neaman, Chris, Daniel, Hien, HimR, Ross, Pawn, Rich
Current Open Position(s) as of Friday August 16 6:30AM
6391.50 ES Long - T1 Hit 6404 - T2 Hit 6417 - T3 Hit 6461 Runner 6405
6461.50 ES long - T1 Hit 6471 - T2 Hit 6482 - Runner Breakeven
Open and Closed Position(s) Yesterday - Same day trades
Daily Gameplans Listed Below
- Monday August 11
- Tuesday August 12
- Wednesday August 13
- Thursday August 14
- FridayAugust 15
- ES Strategy - Trade Rules - Key Level Codes (New Reader Must-Read)
Monday August 11, 2025
Back at the Screen – ESDaily Gameplan
I’ve been off the grid the past few sessions — trading screen swapped for the Florida keys, pulling in yelllowtail, snapper, mahi, and lobster traps instead of levels. I really value the time away from the screen. Clearing my head with just my wife and kids puts all this work we do here into perspective.
Atleast once every other month or so I take these breaks. I’ve found them to be super helpful in not only being a better husband and father, but also a better trader.
Sometimes the cleanest risk management is resetting, entirely.
But during my time off, ES didn’t stop moving, and the daily chart tells the story of exactly where we’ve come from and why today’s levels matter.
Let’s review the last few weeks then focus in on last week a bit for context. It is a very valuable habit to understand where we came from before we understand where we’re going and what’s important.
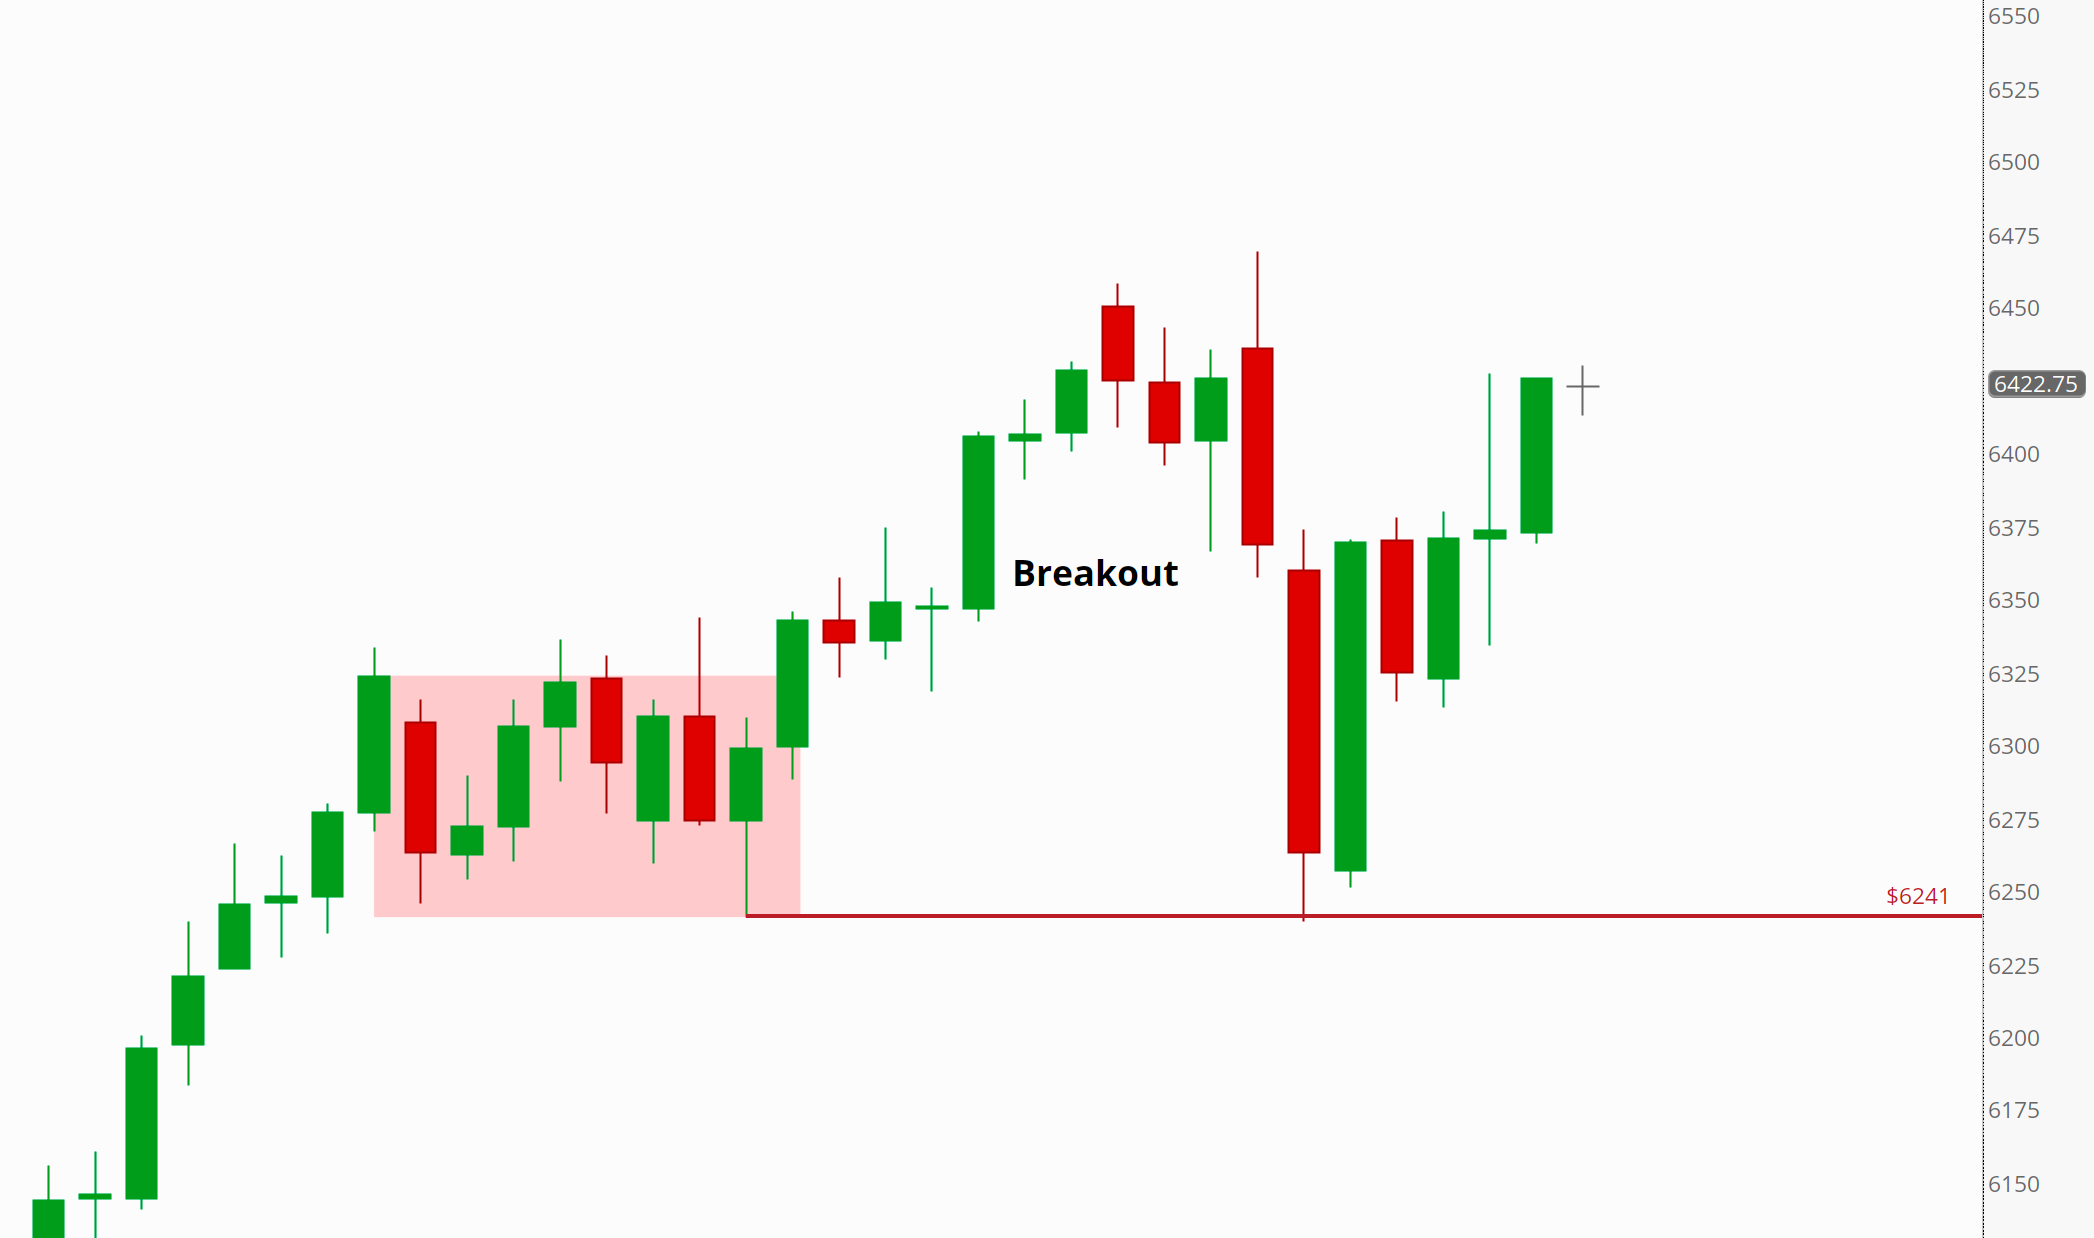
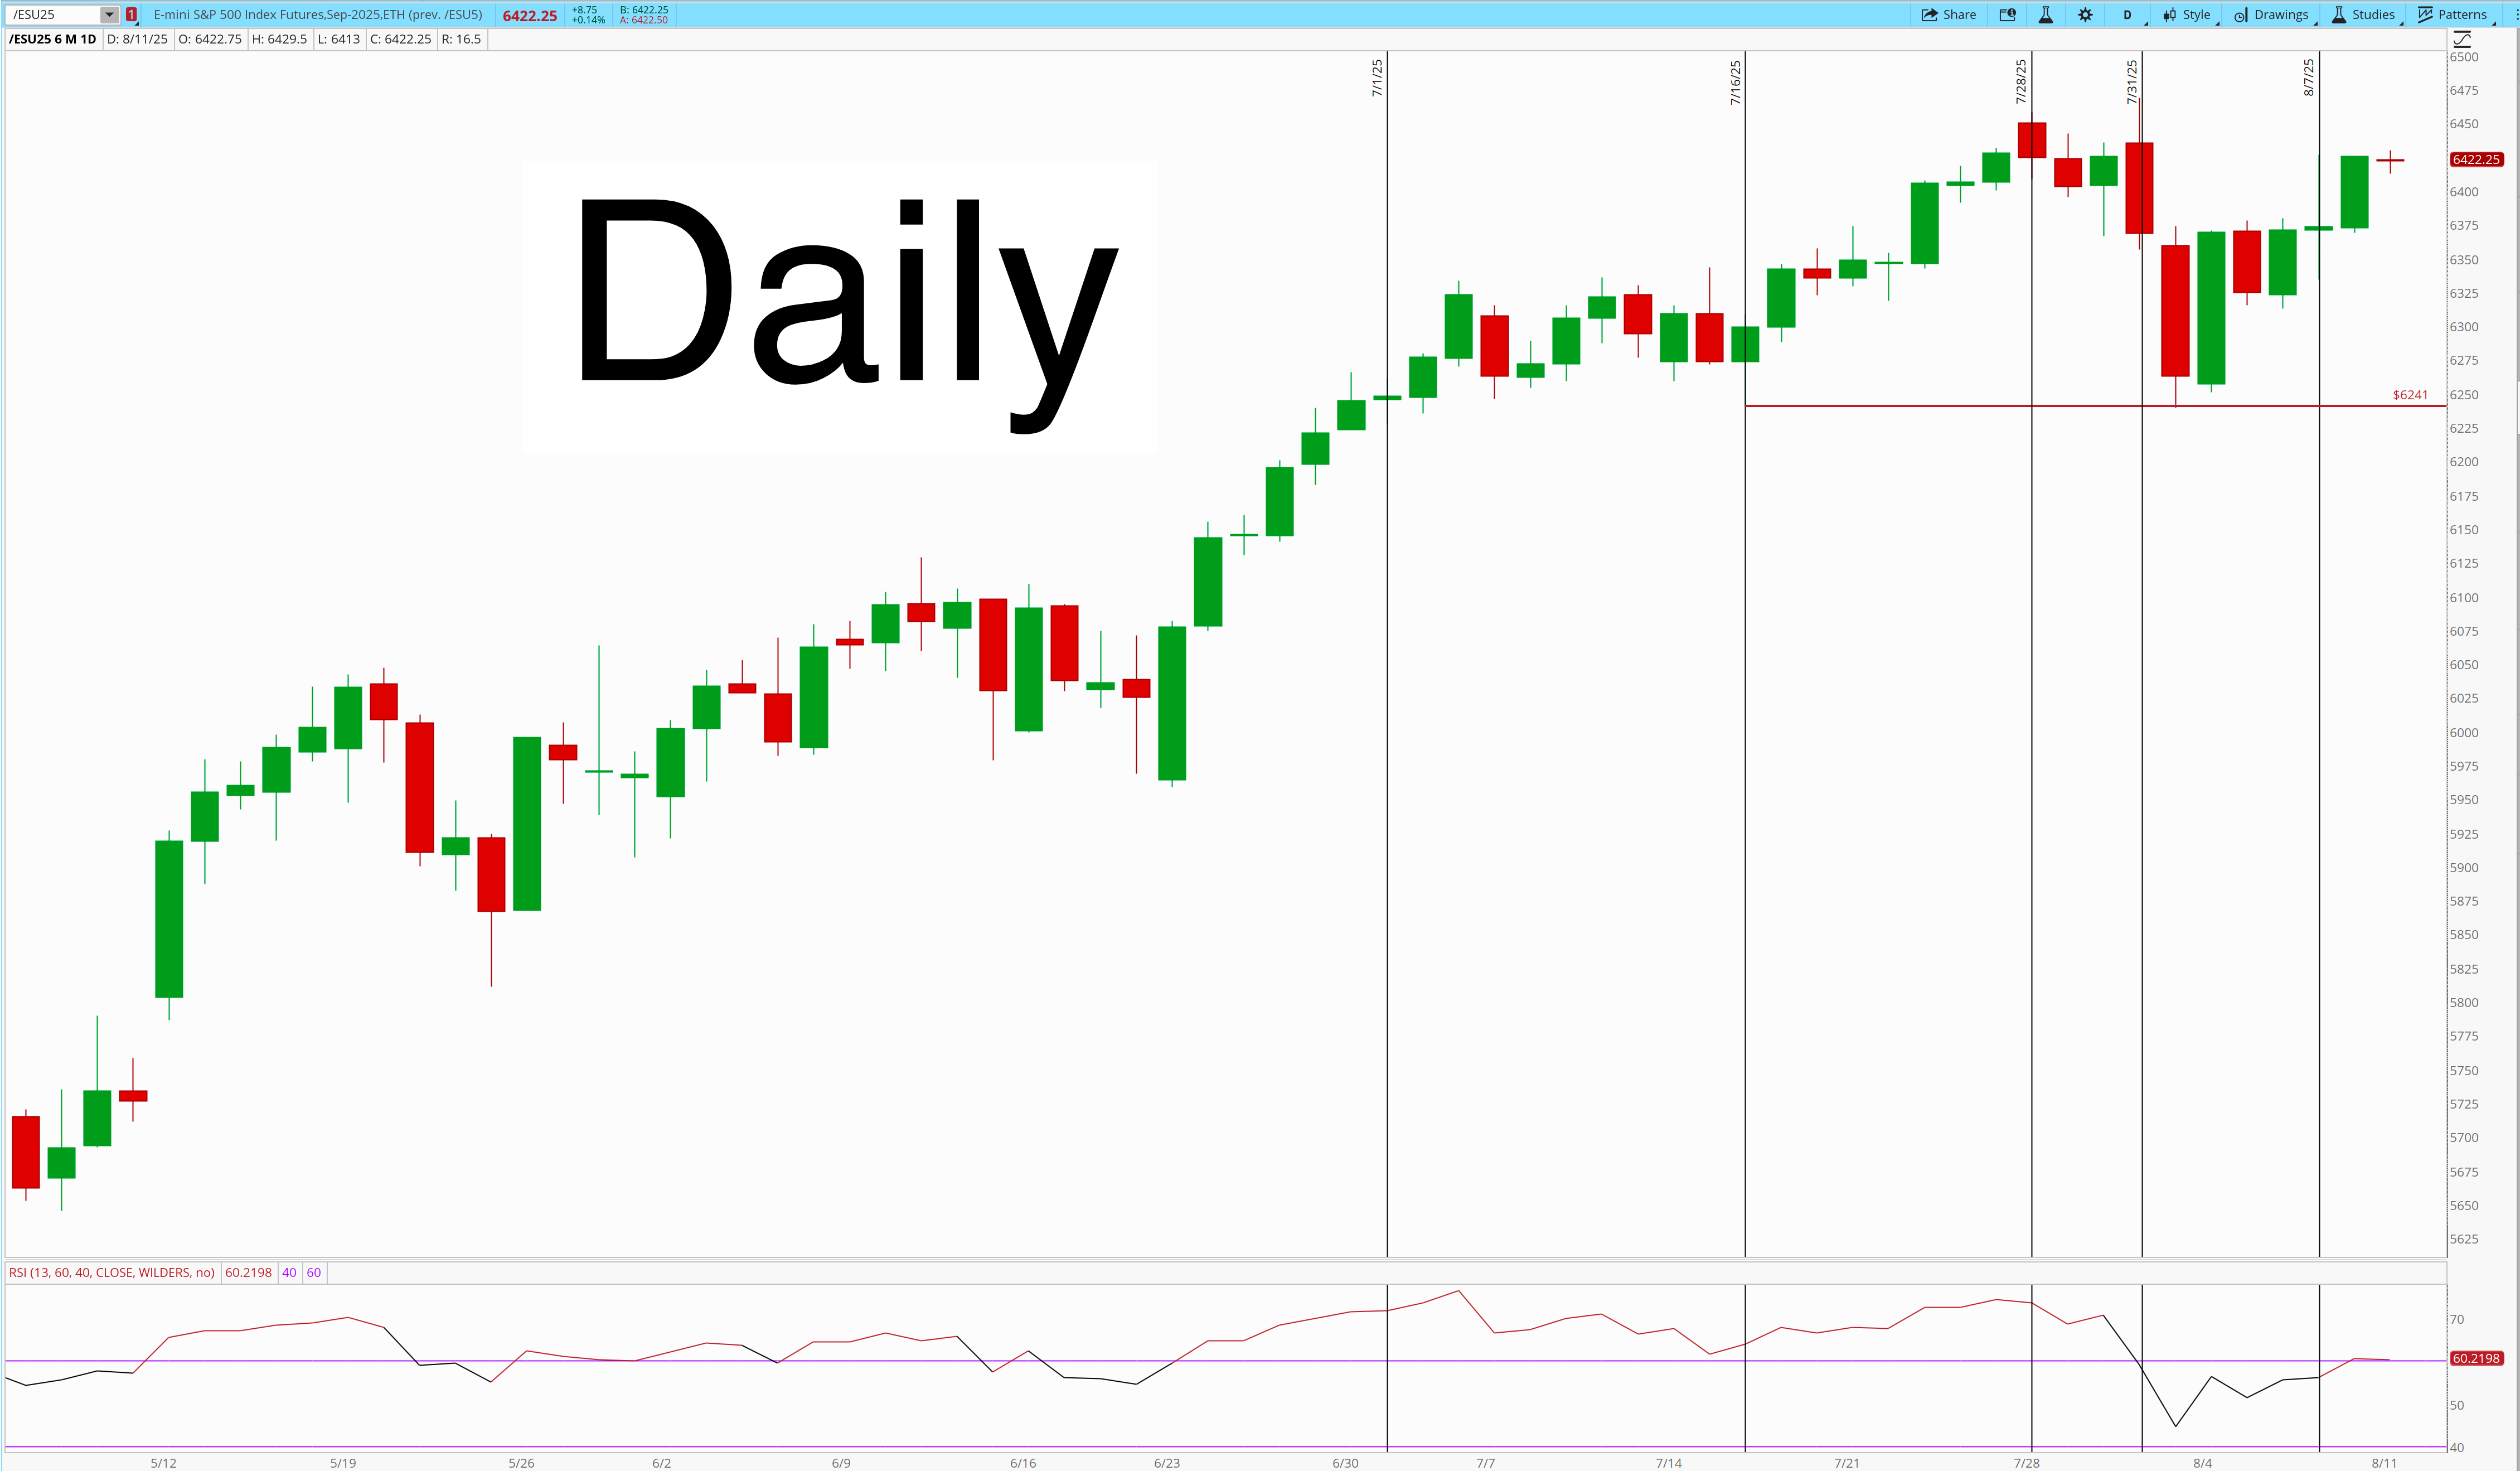
Daily
July opened with the same engine that carried June — buyers in control, shallow pauses resolving higher, and a clean staircase of higher lows.
We built out a massive consolidation range from July 1 - July 16
6235 - 6345
During this entire time the structure was respected well, and we traded it well. One of the best trades of the year was the July 16 6245.25 long. We scaled out 4 different targets on it’s way to 6468 and trailed out 6380.
Each dip during this consolidation found support without breaking structure, with RSI riding above 60 as ES coiled.
From July July 22-July 31 ES staged a post consolidation breakout, a very difficult one to trade.
Late July brought the first real change in character.
Price pressed into the upper band, poked at the highs, and the candles widened and got sloppy — classic end-of-leg behavior.
That set the stage for the fast August shakeout: a hard liquidation that undercut the late-July shelf, pulled us back through the short-term averages, and flushed RSI toward the lower band.
That break didn’t stick.
The very next sessions reversed sharply, printed a strong rejection wick at 6240, and spent the rest of the week repairing damage — higher low, higher close, and a clean reclaim of the July 16 breakout zone.
Now, as we come into August 11, price is camped just under the same top shelf it failed from in late July. Short-term moving averages have flattened and are starting to curl back up, RSI is curling from sub-45 toward neutral-to-bullish, and the deck has been reset.
Net: trend still points up on the daily, the early-August washout reloaded buyers, and the next clean edge comes either from a decisive breakout/hold above the shelf — or a flush back into the nearest proven reclaim zone where demand has already stepped in.
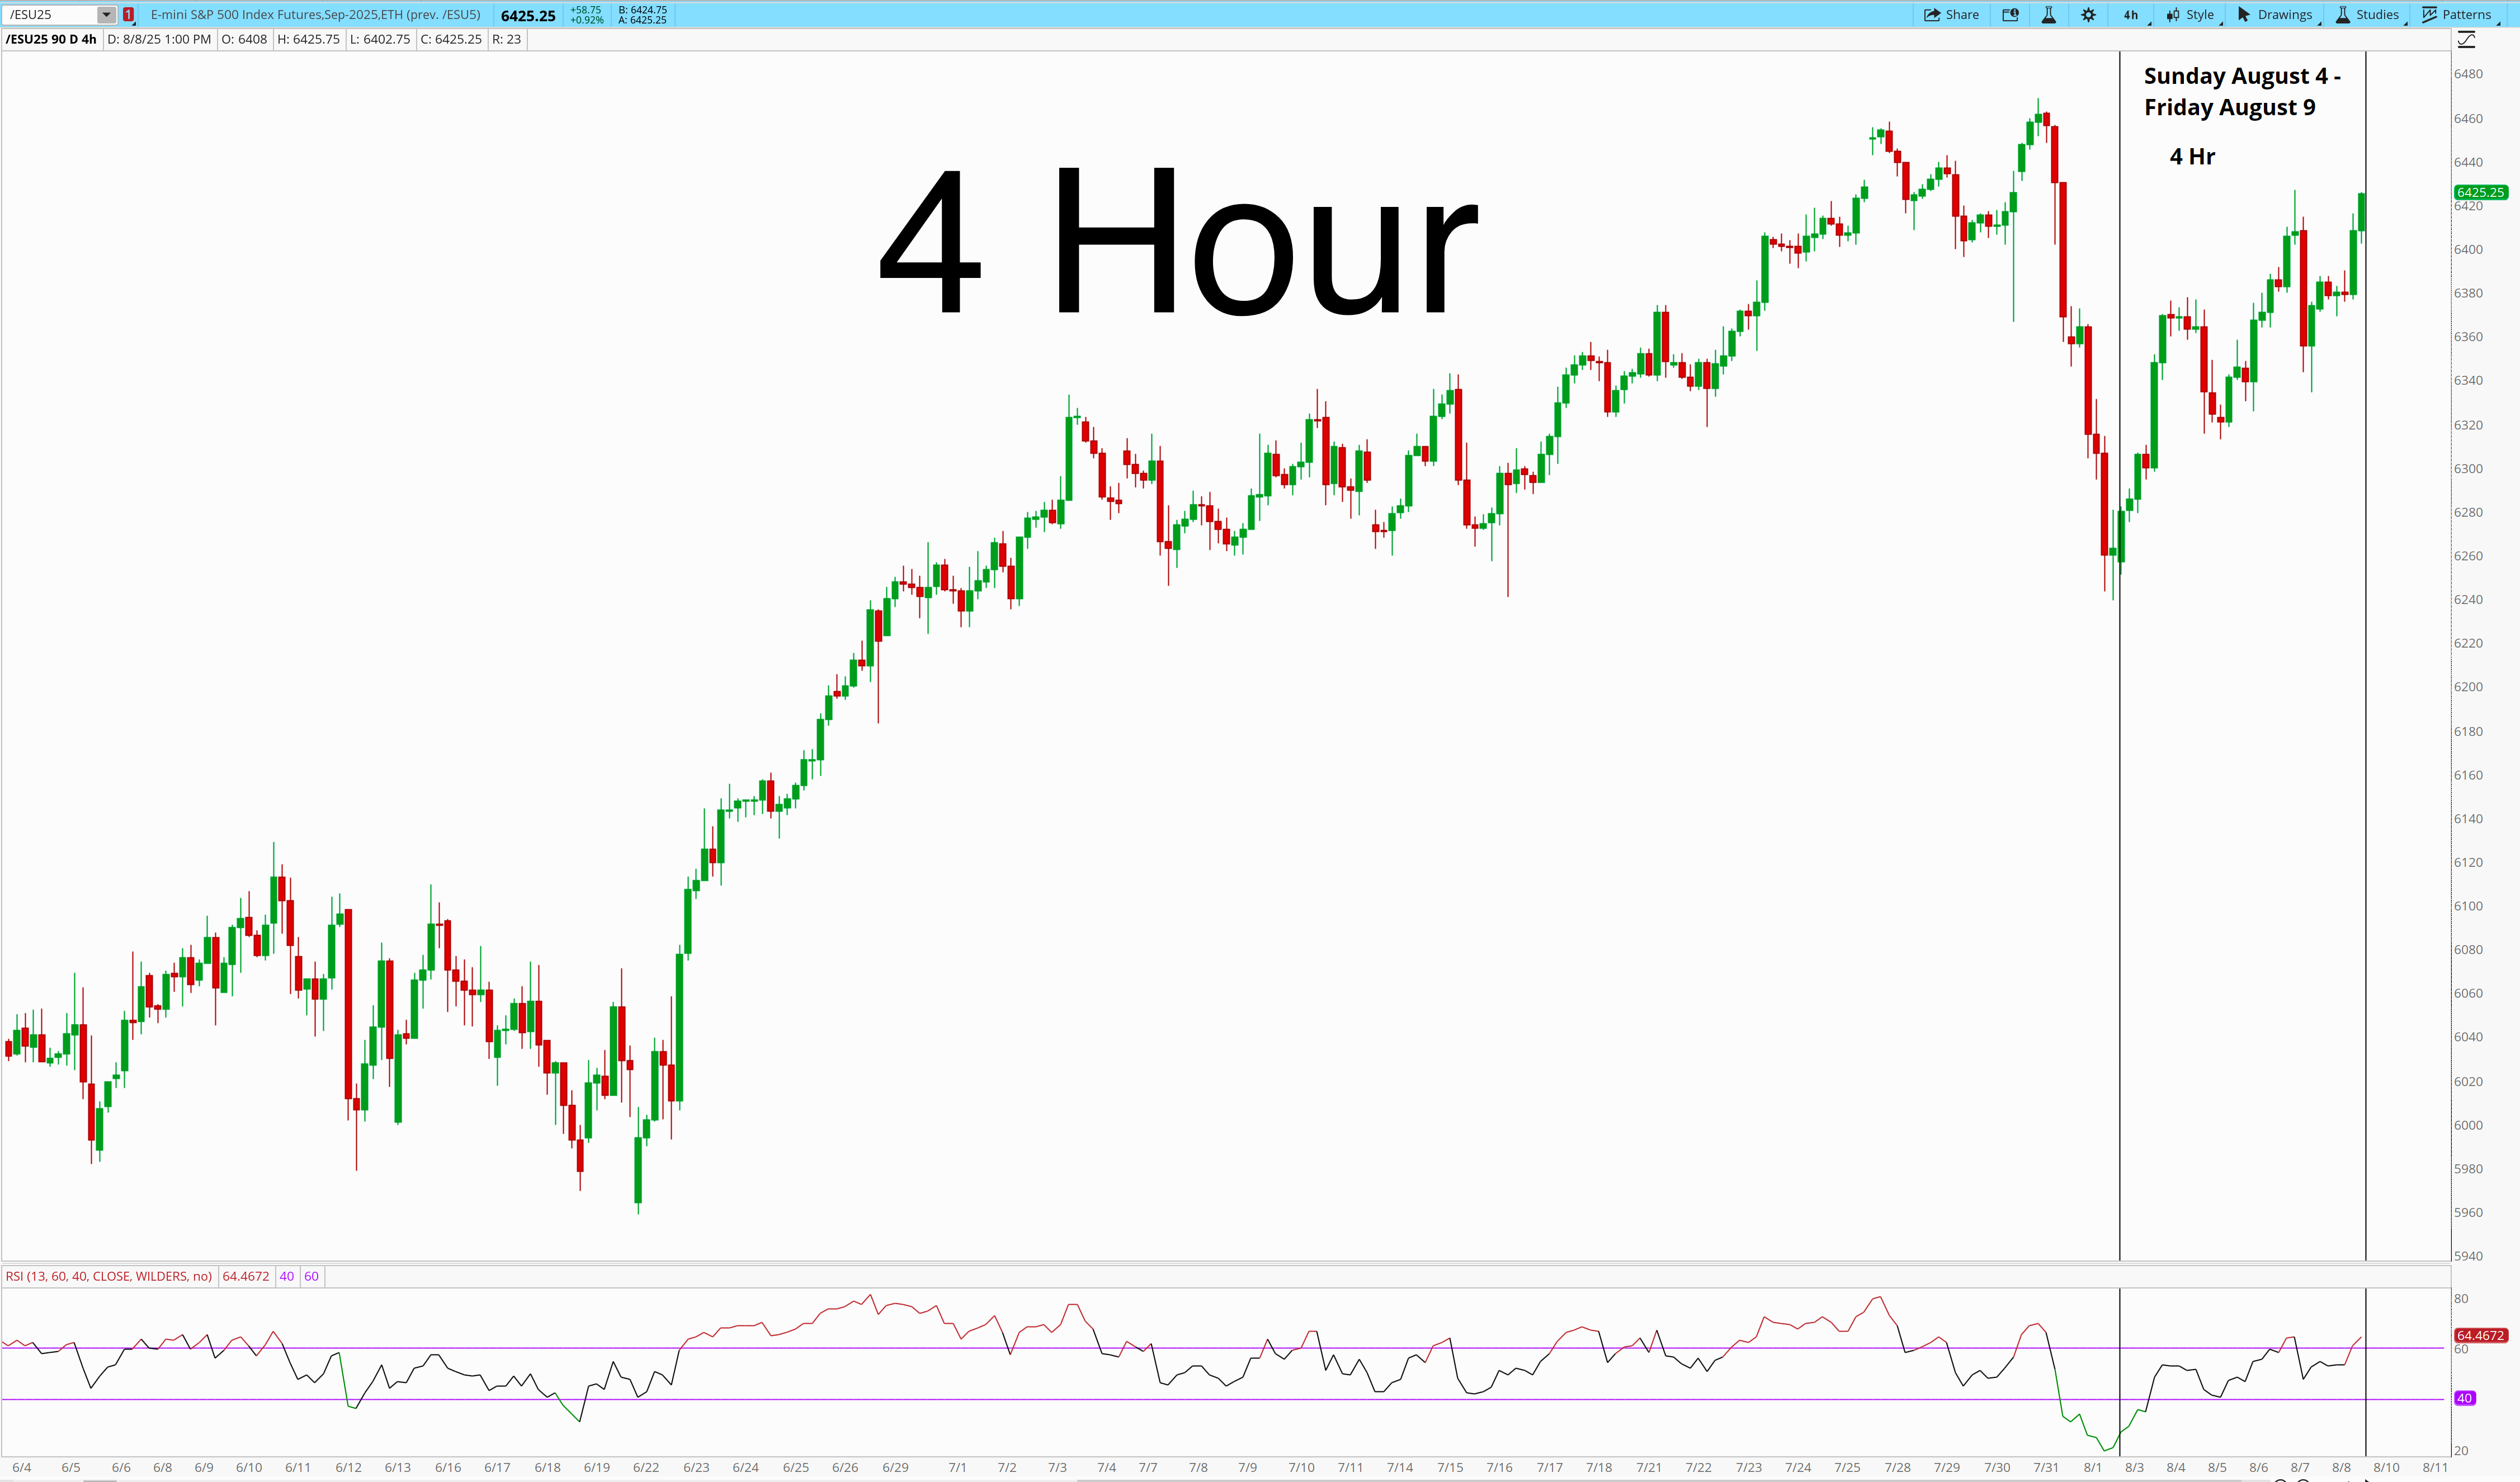
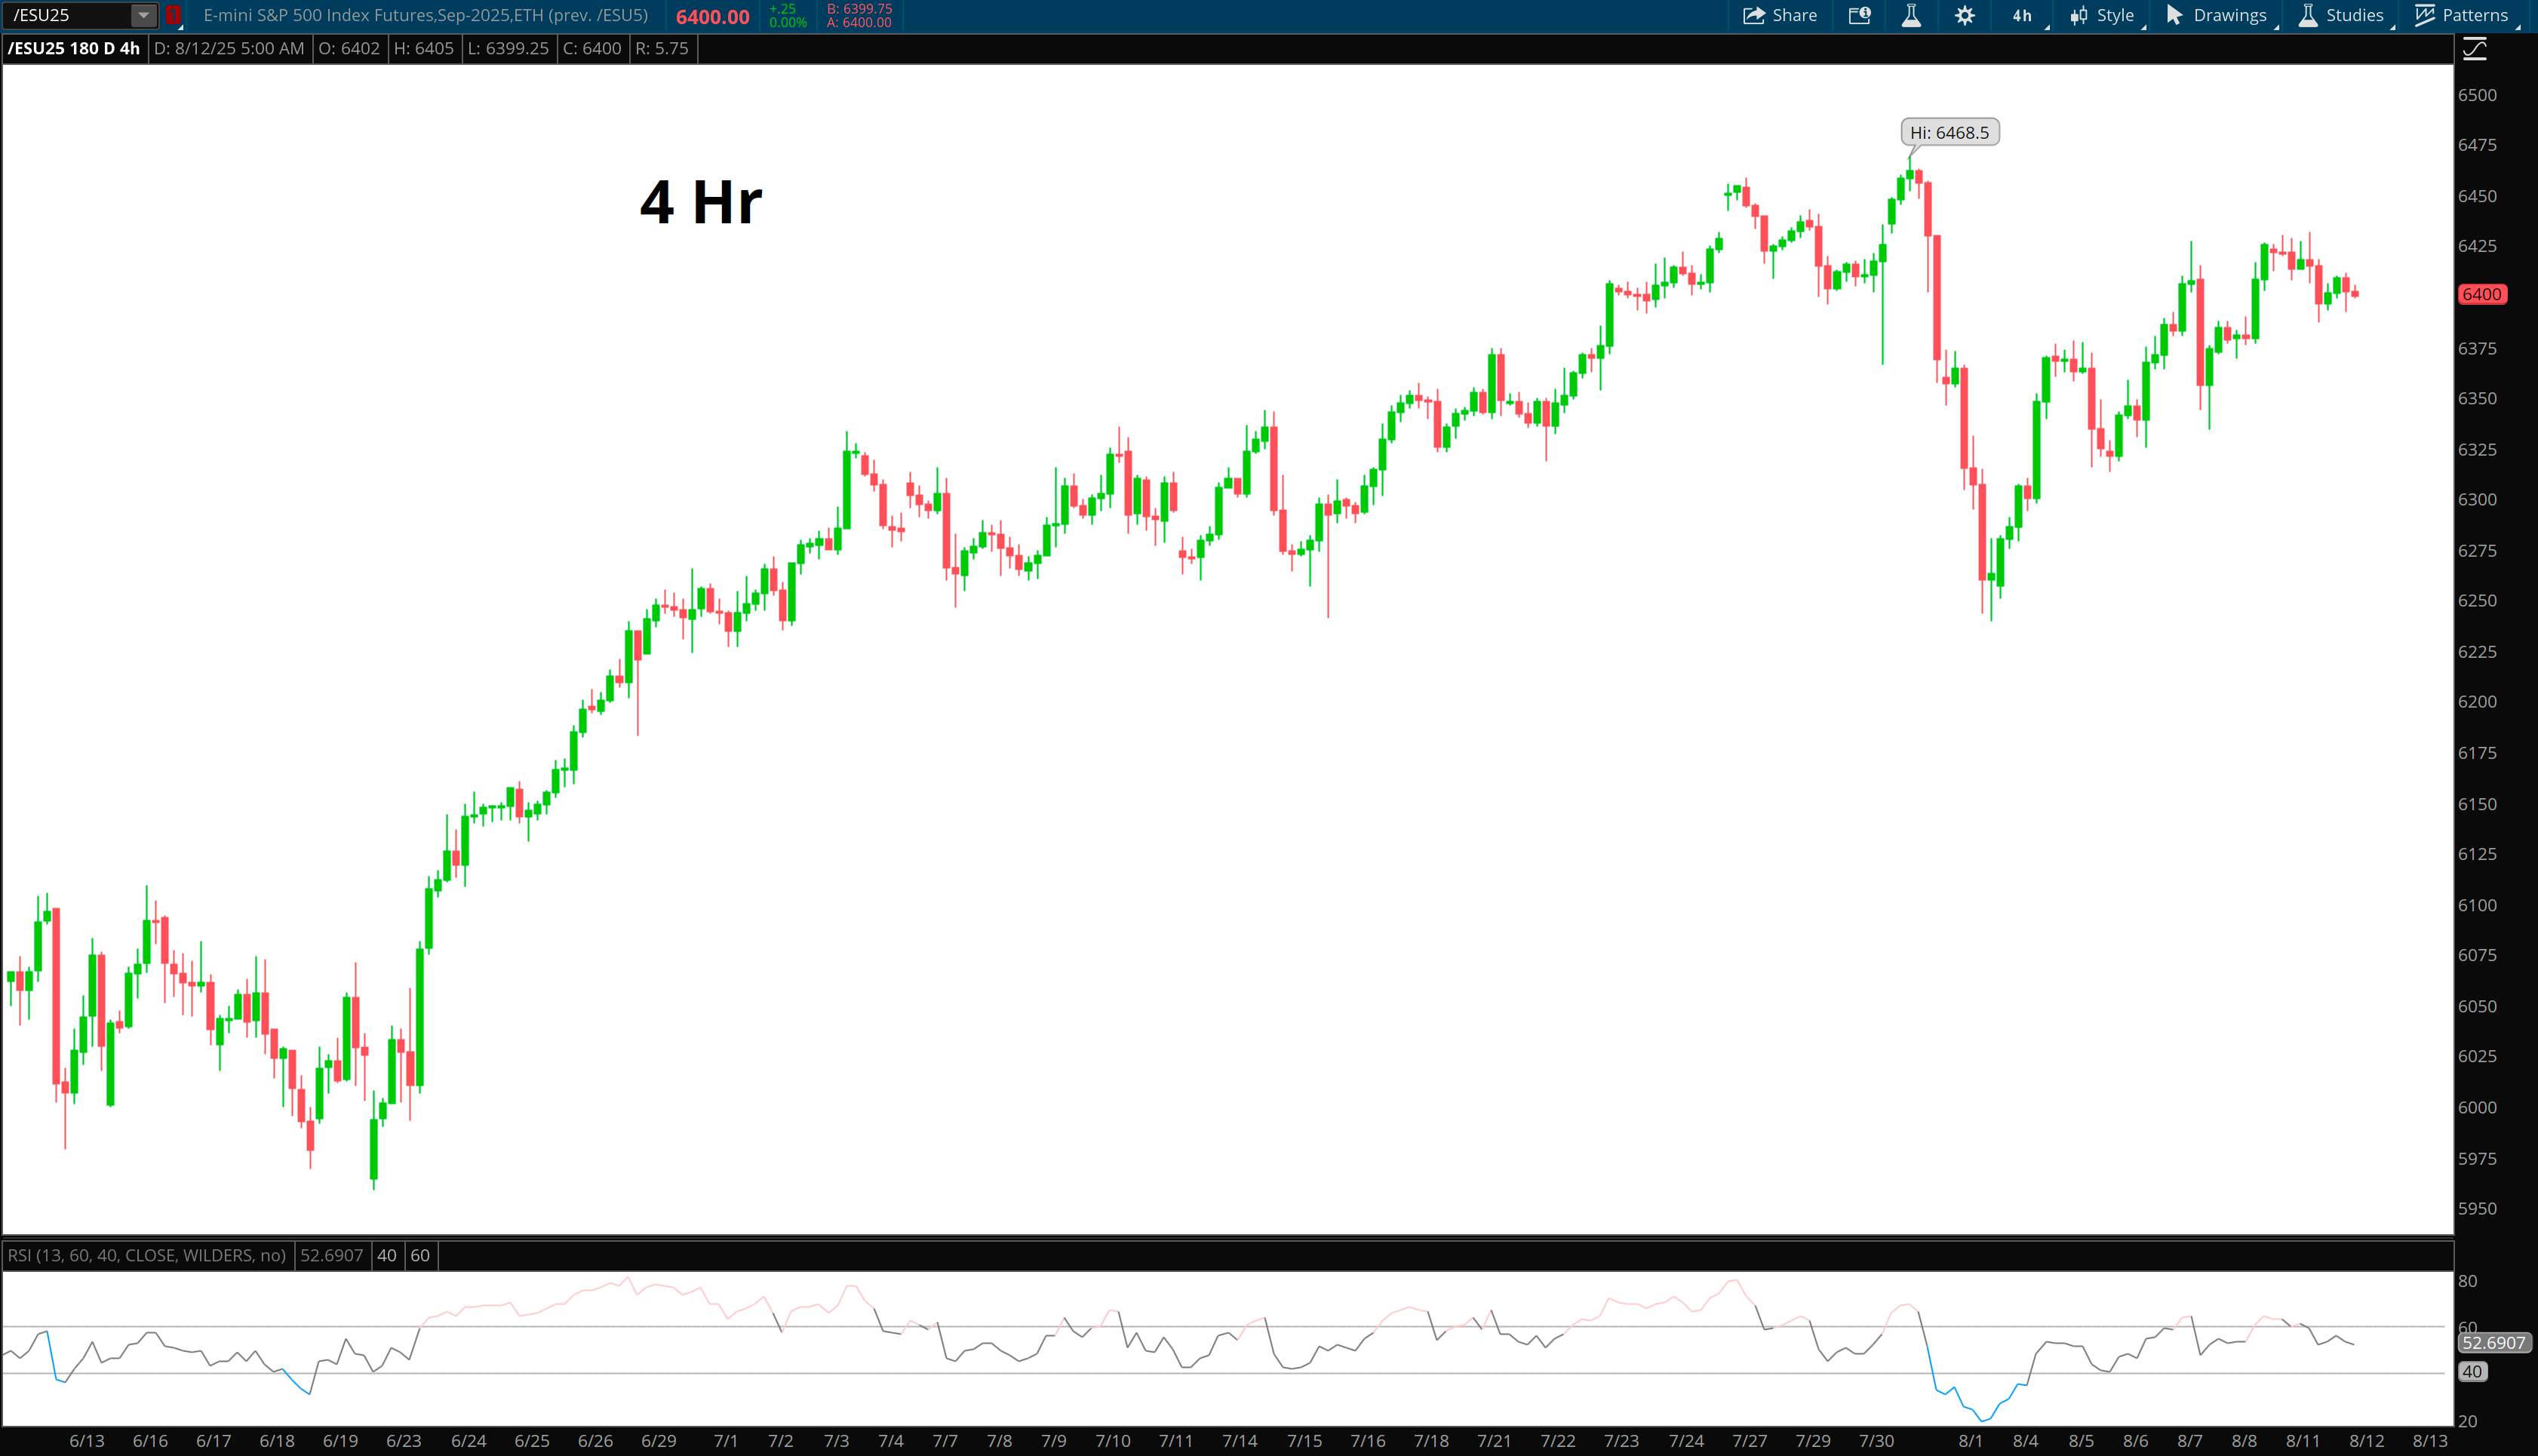
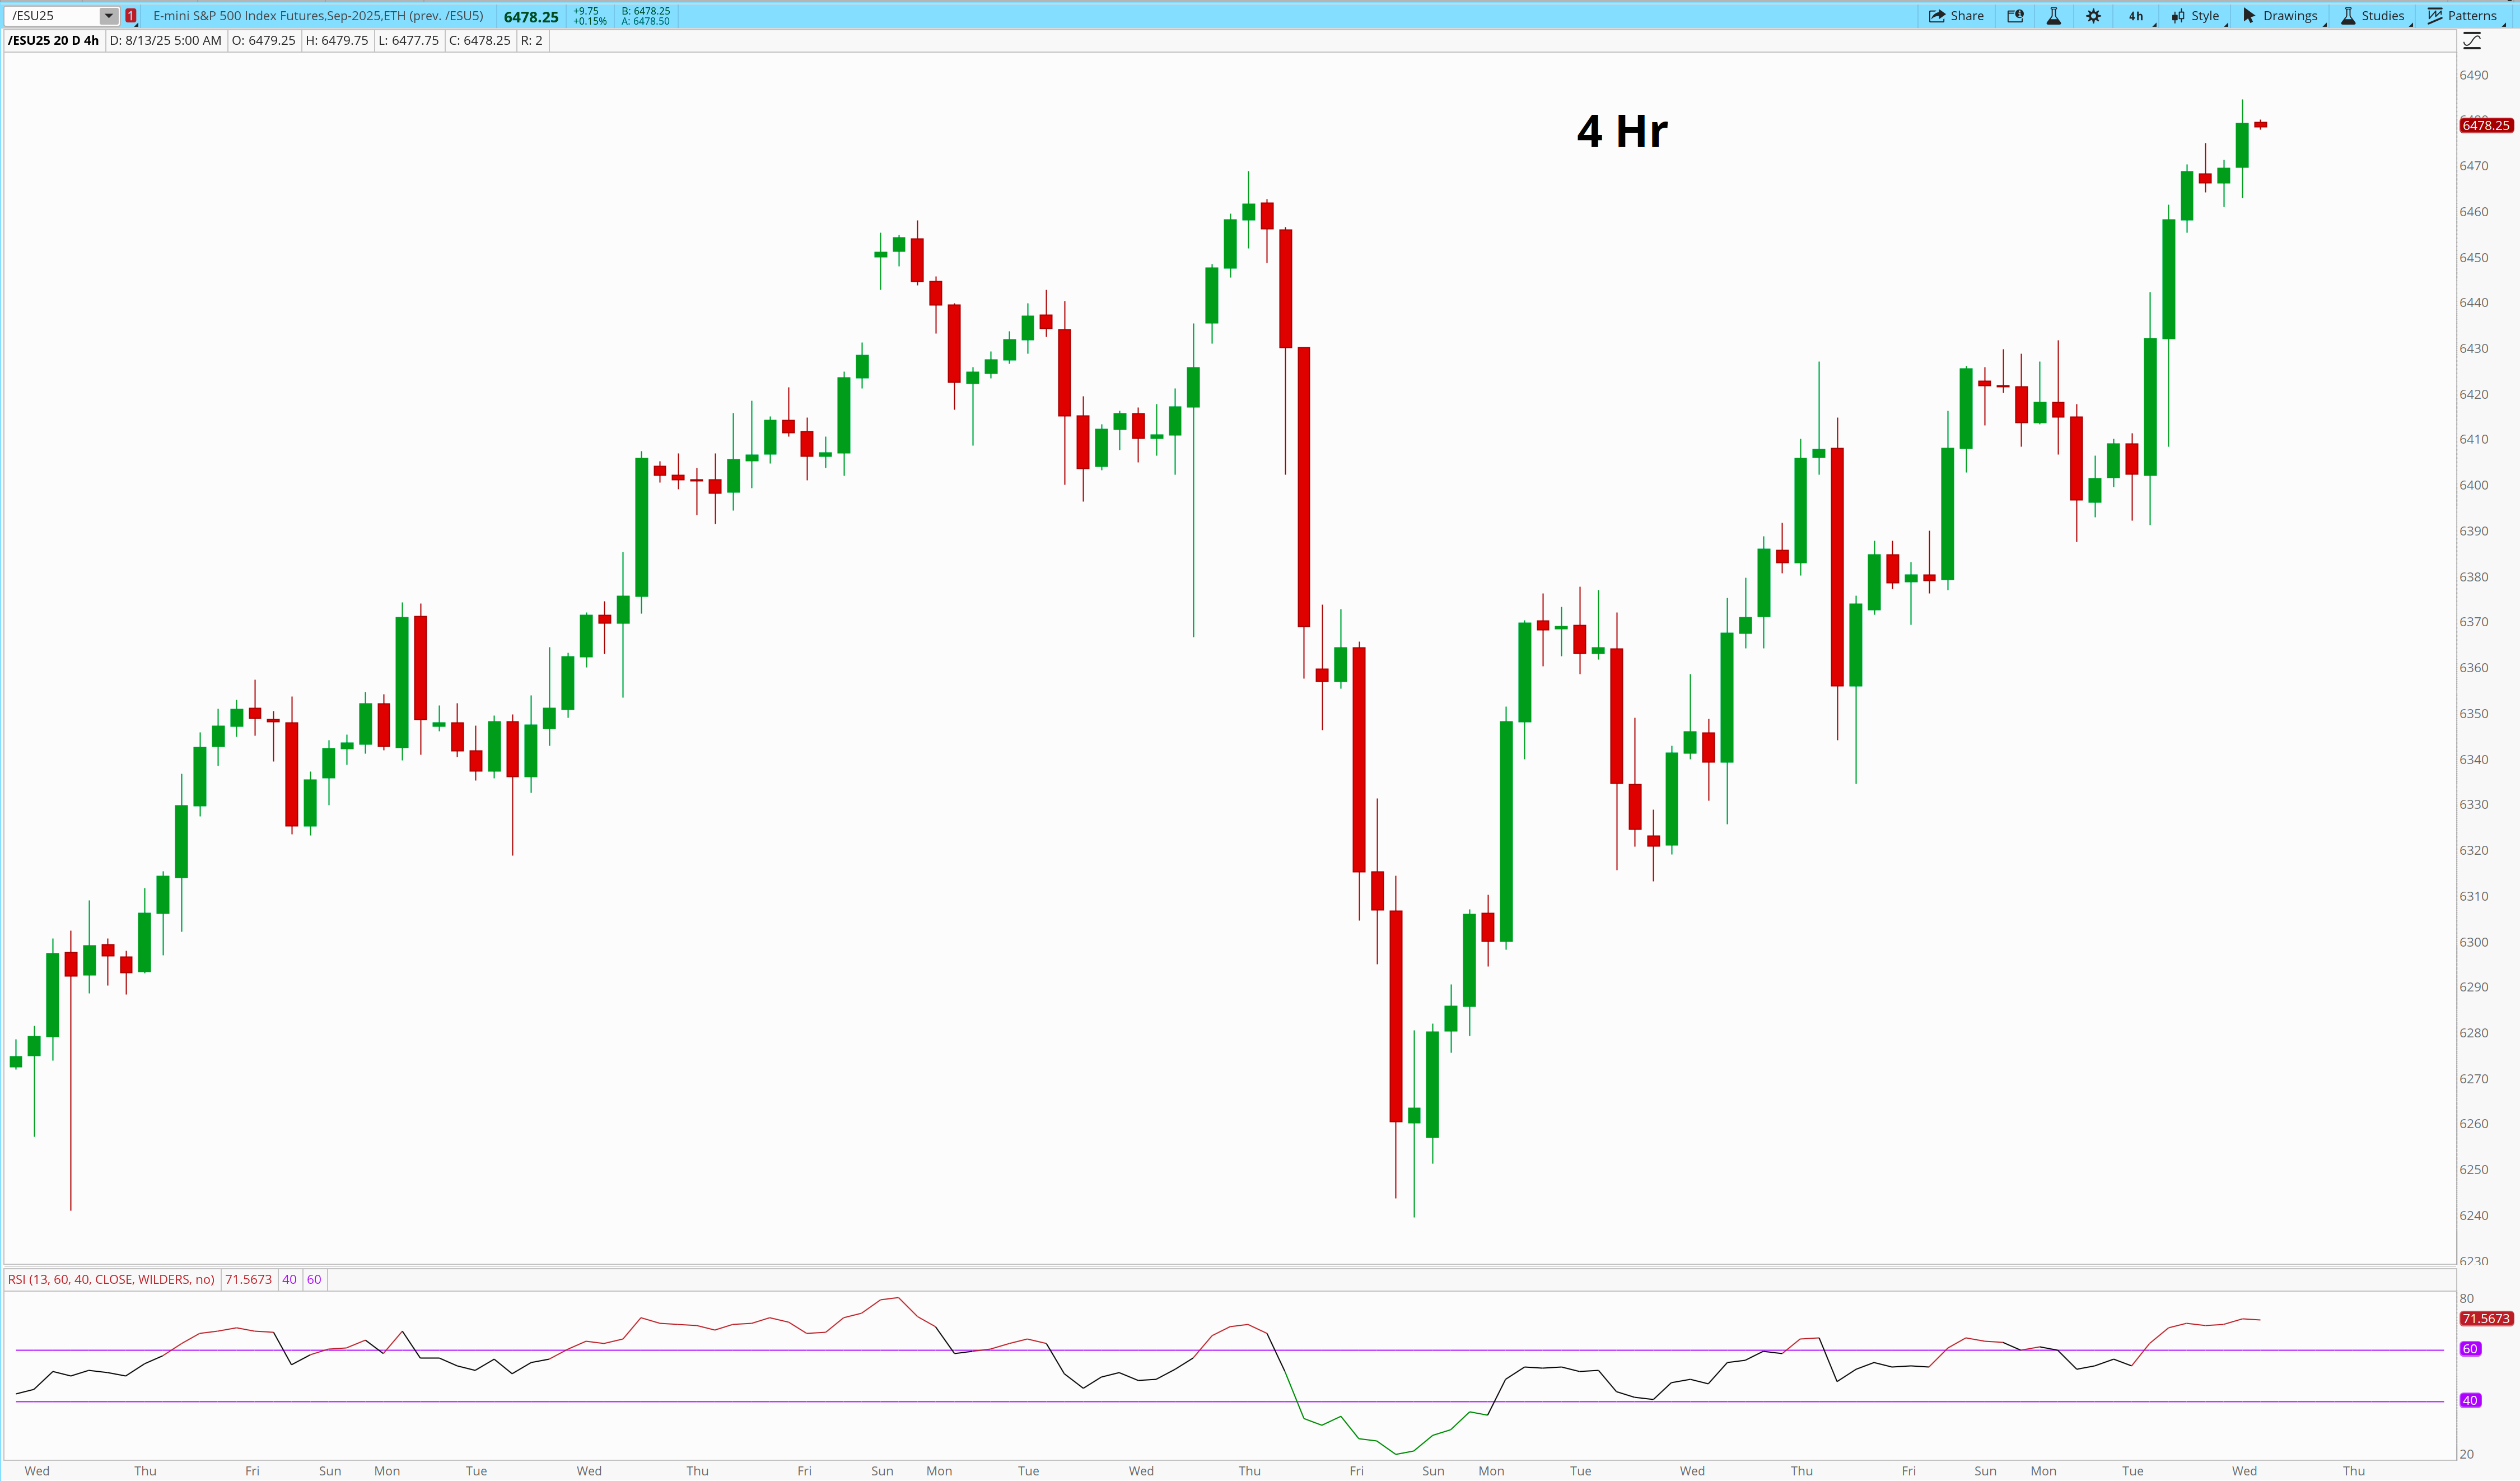
4 Hour
The 4-hour chart gives us the clearest view of the August reversal.
The flush to start the month created a higher-timeframe demand pocket that’s held firm on every revisit. From there, the past week has been an organized climb — pullbacks shallow, candles overlapping, and each micro-base resolving higher.
We’ve printed a clean sequence of higher highs and higher lows and finished the week pressing back into the upper band of the recent range.
Nothing about the rebound broke structure.
RSI sits just above 60 — bullish momentum without being stretched.
That combination—uptrend + RSI > 60—keeps pullbacks into proven zones (preferably at the edge of structure CRA’s) as the higher-probability plays unless we lose acceptance.
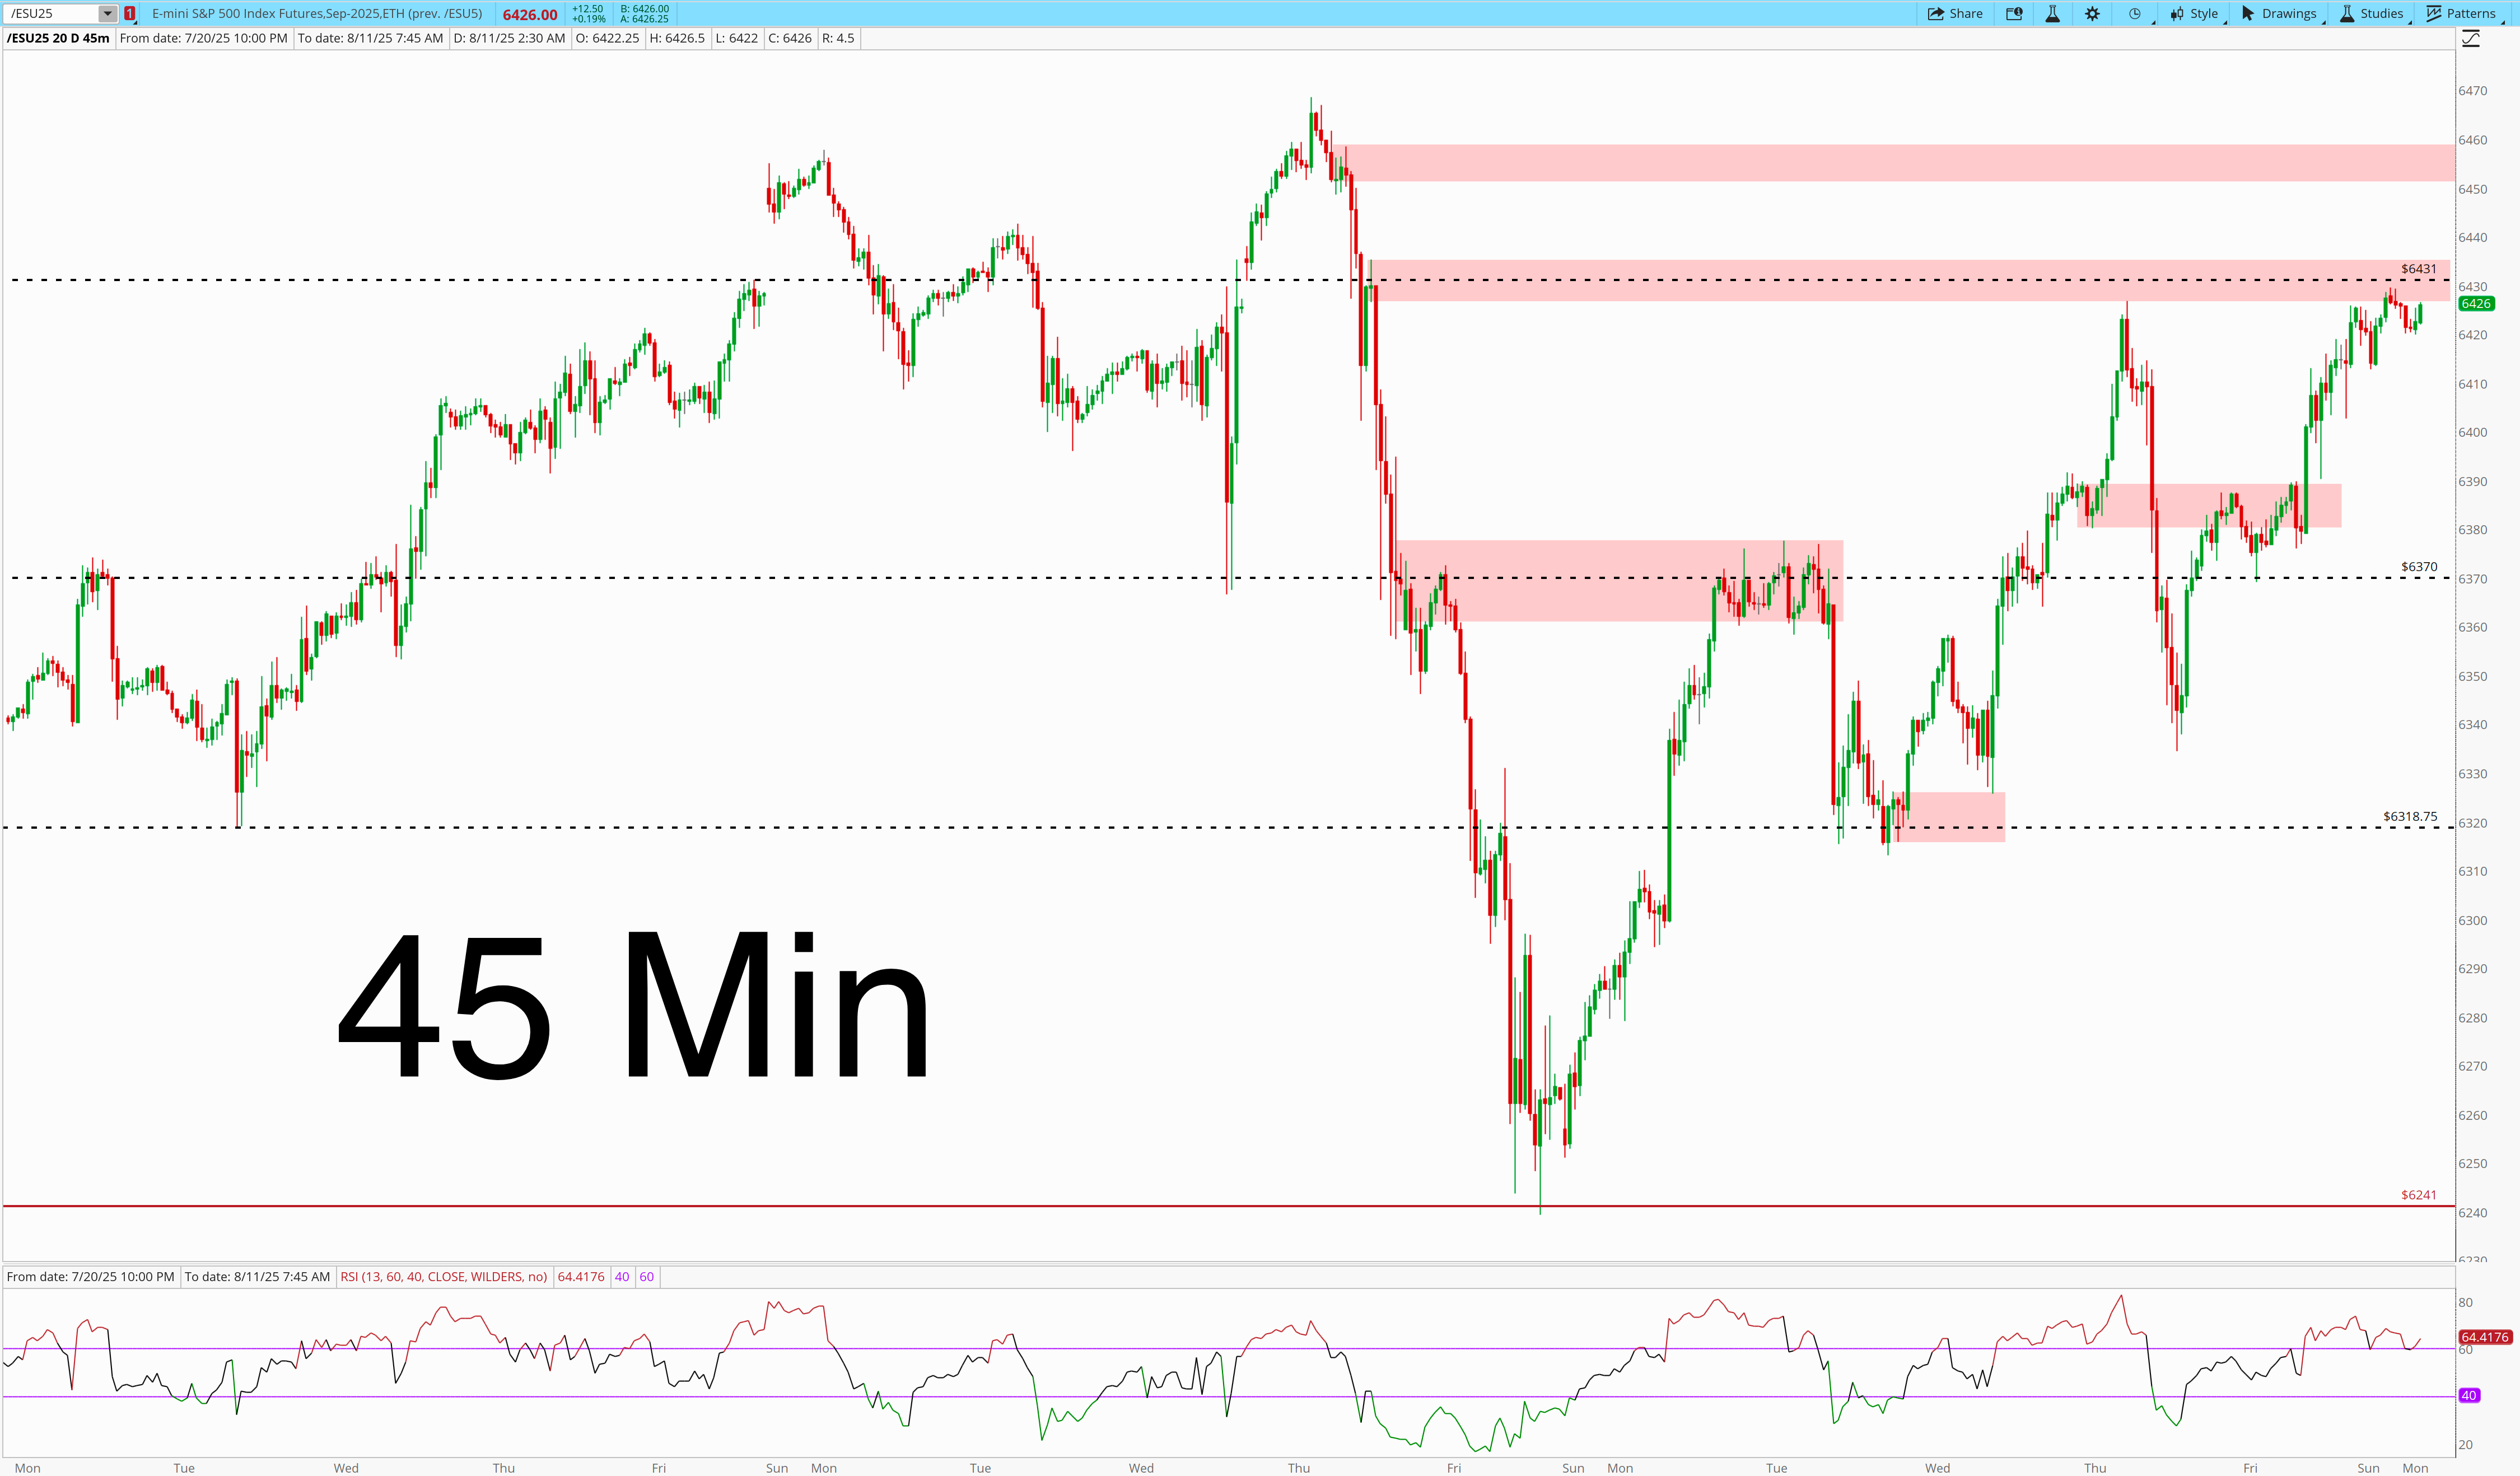
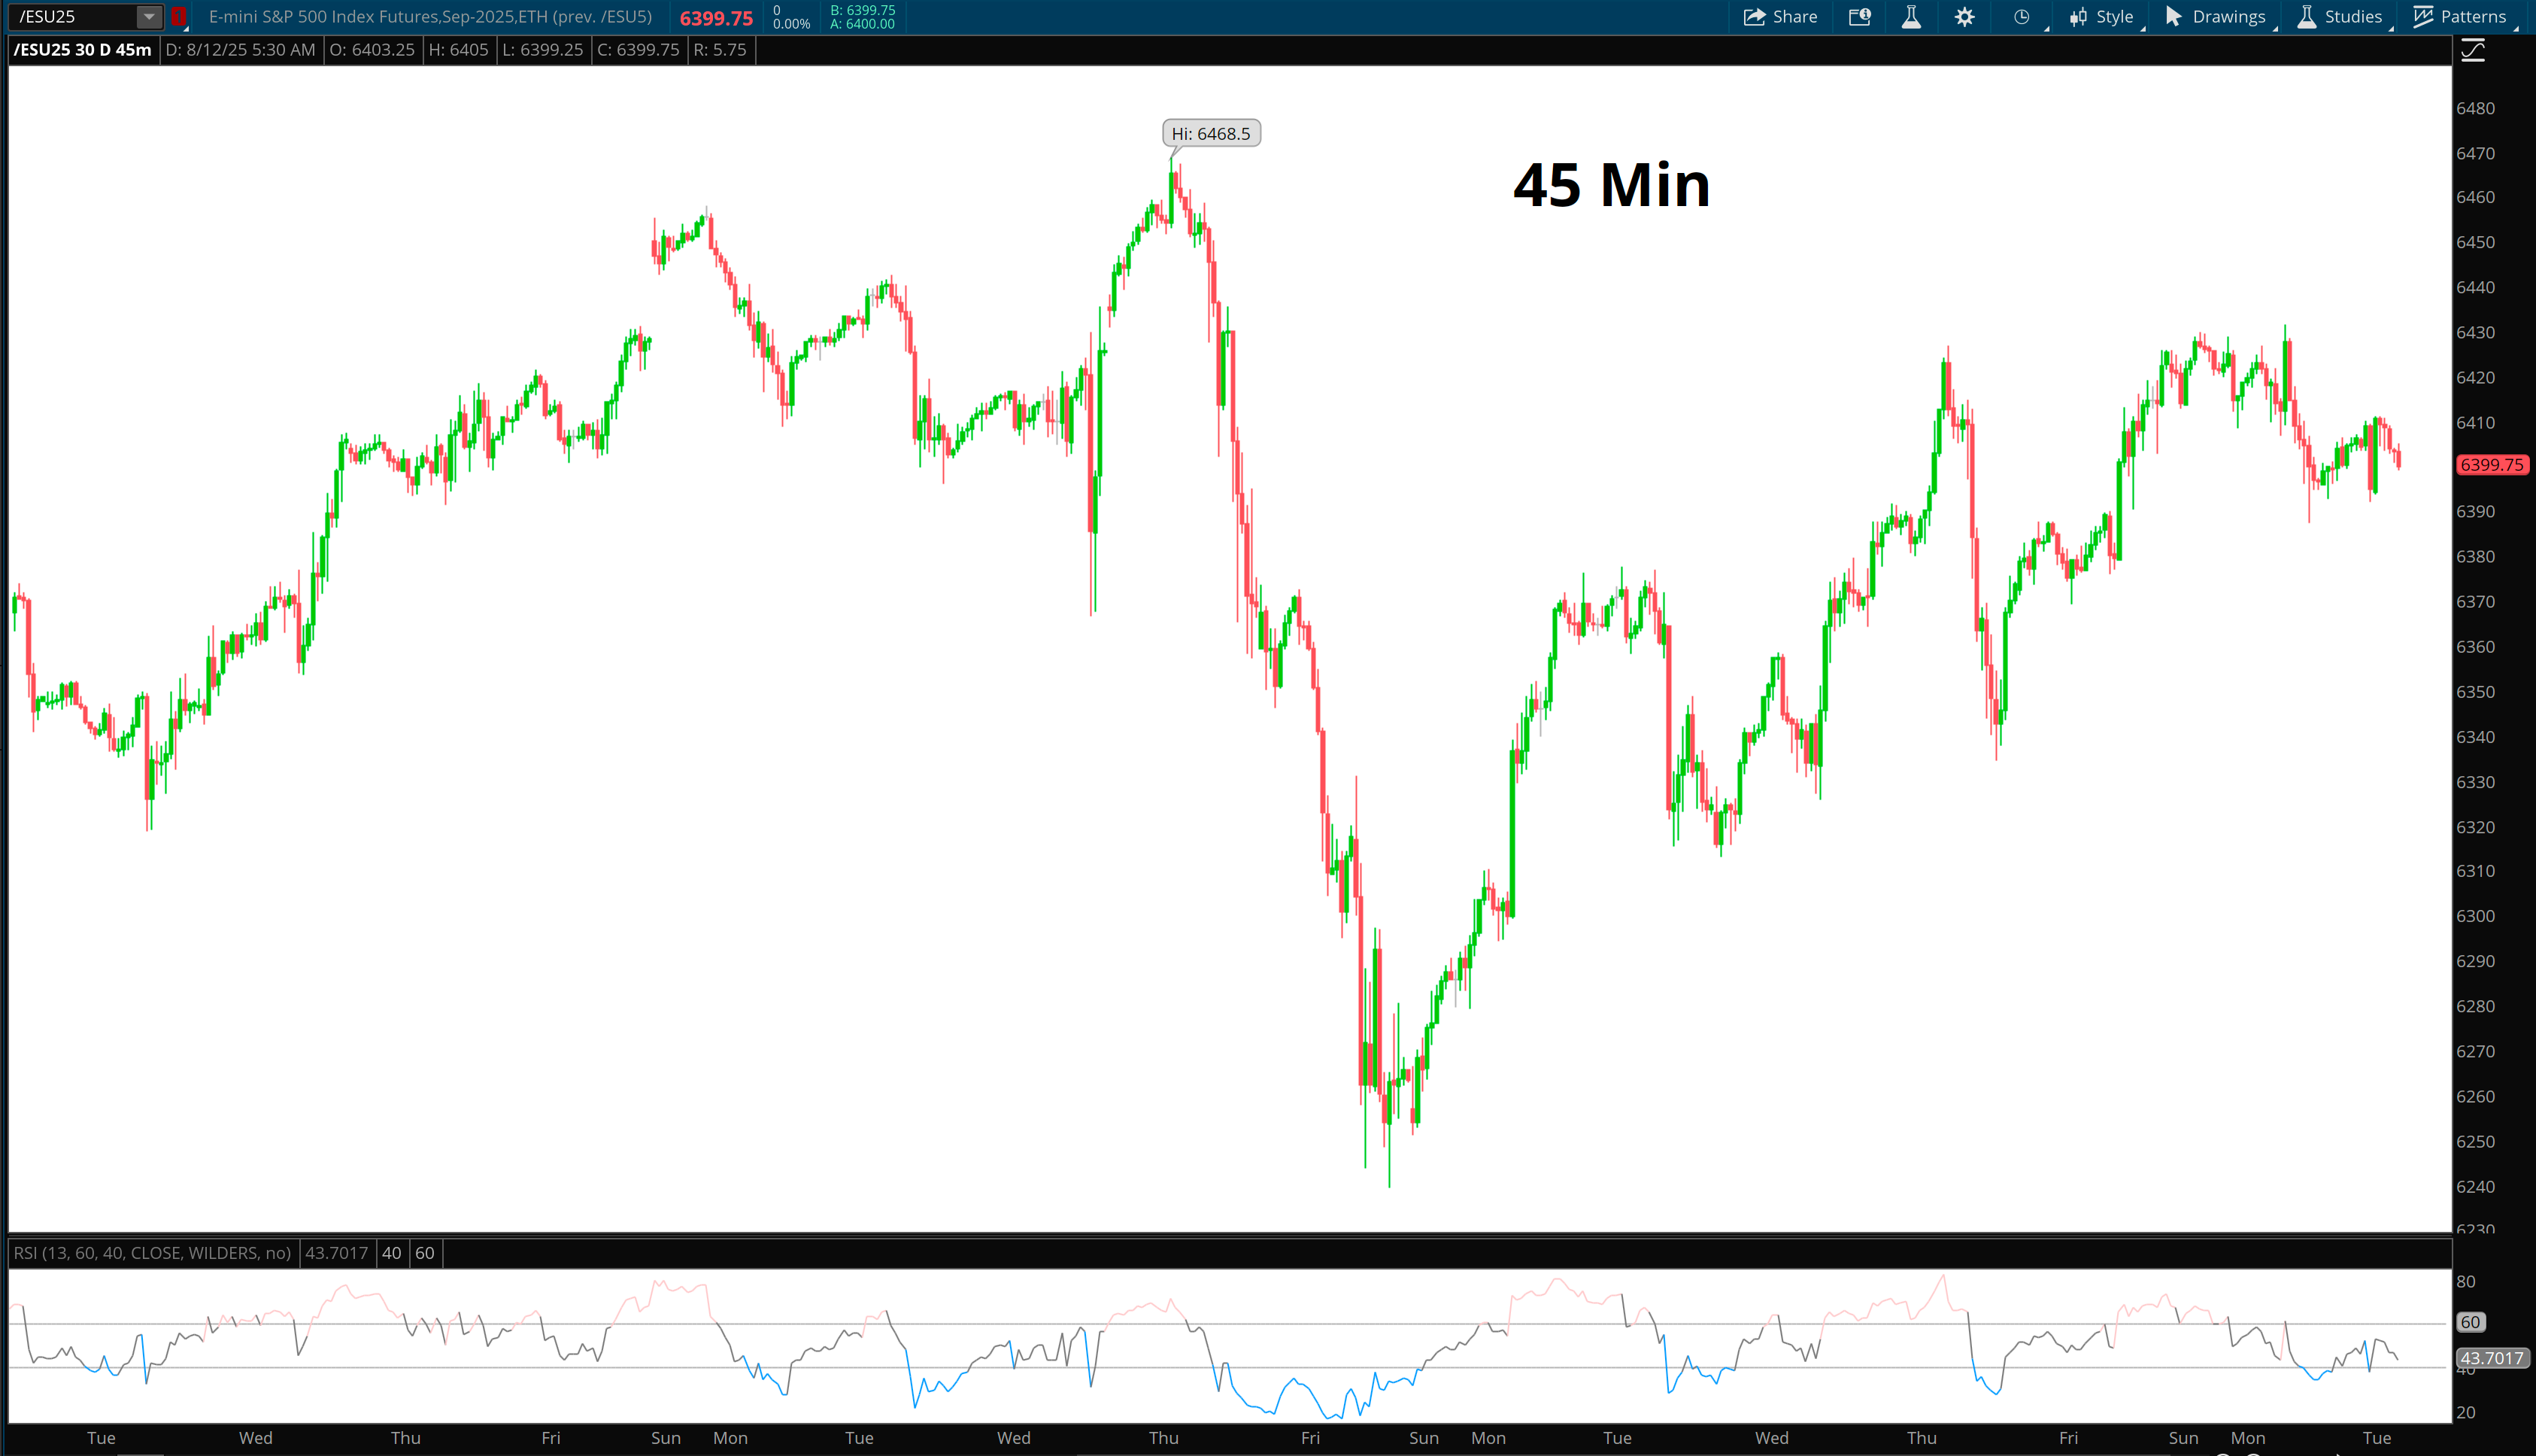
Zooming in, the 45m shows the character of the bounce—
The 45m shows a stair-step reclaim off the 6280–6290 base, through 6365/6388, and into acceptance above 6406
We’re finishing the week pressing directly into 6430–6431, where supply has been sticky since late July.
Trend is still pointed up, but RSI in the 60s is flattening and flashing negative divergence.
That combination (divergence into supply) often precedes a pullback into the nearest support ledge before continuation.
—Check When Do Trends Change Part 1 for reference—
If we pull back, 6406 is the first key test; below that, 6390 would be a structural breach and 6370 would put the thing in jeopardy.
All are buyers defense zones.
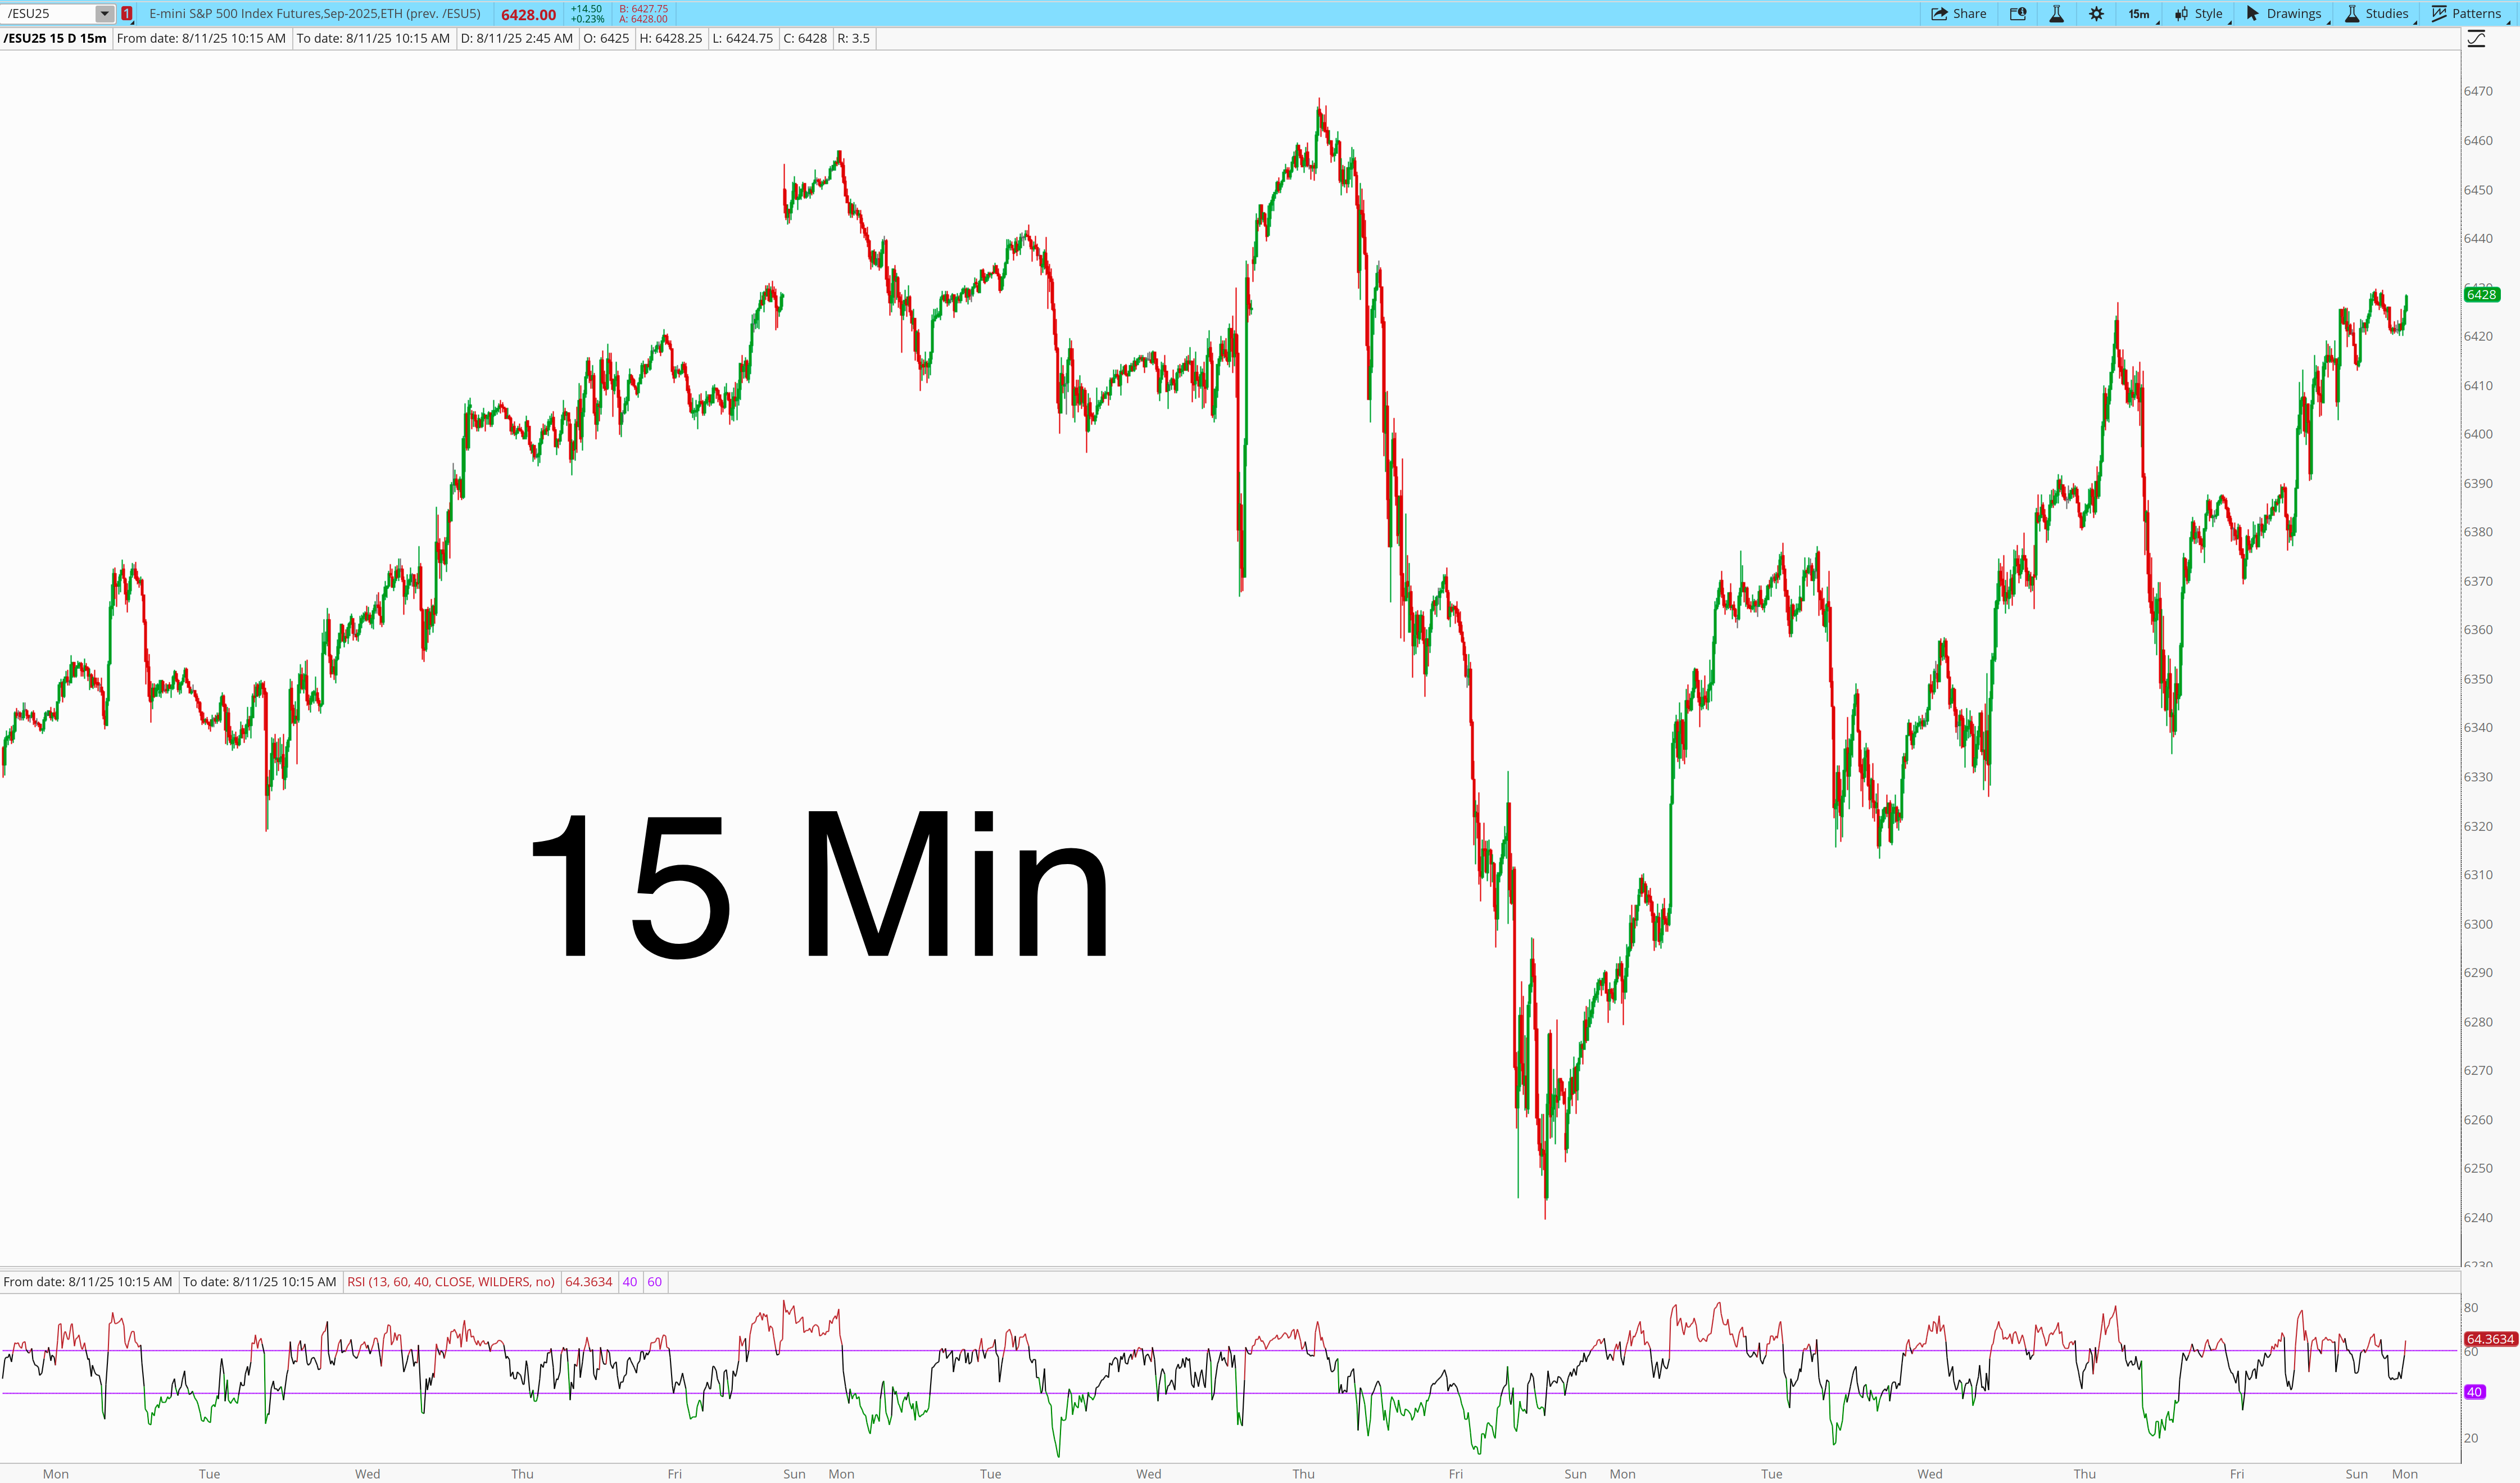
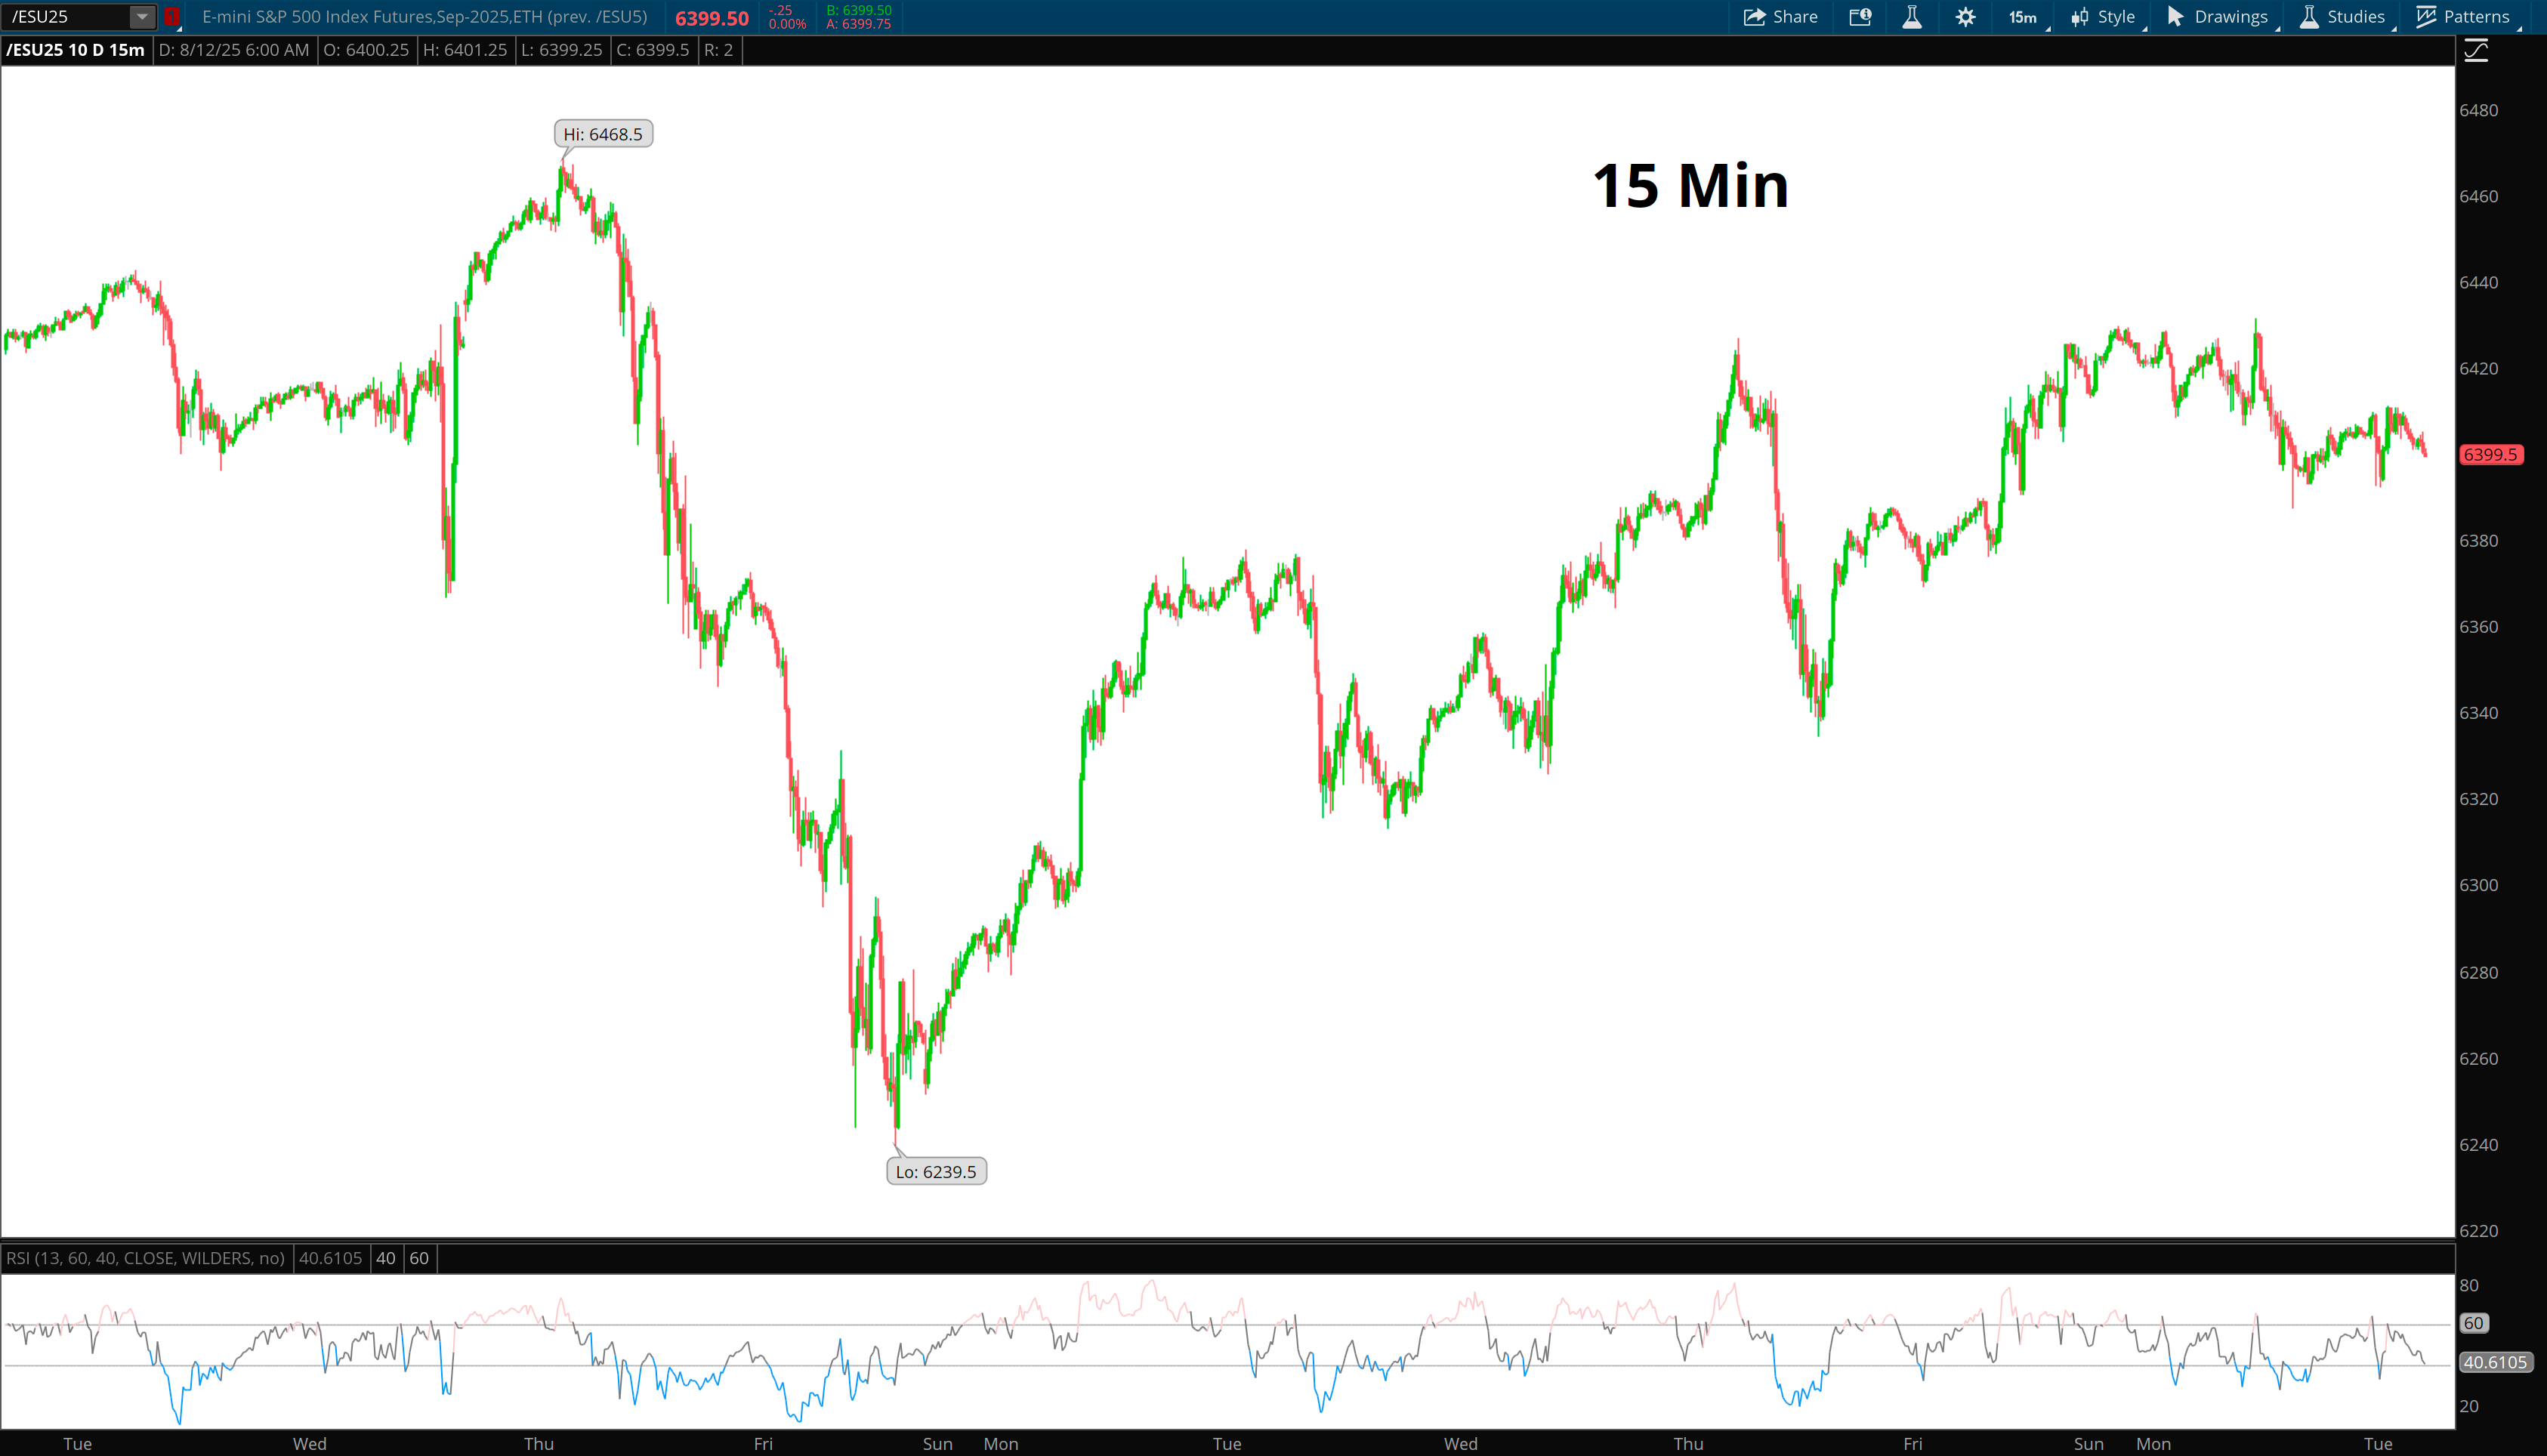
The 15m is a cleaner microscope on Friday’s grind.
The micro tactical map is pretty clear:
Above 6433: breakout territory into layered supply, with room to squeeze late shorts and test the next supply up the ladder, every 7-10 points. Needs clean acceptance — a quick spike-and-reject here favors the short-term pullback scenario.
6406: First line of defense for buyers; watch for responsive bids and rotation higher if tested early.
6390: Structural line in the sand — lose it, and the tone shifts to repair mode.
6370: Last stronghold from the August climb; a failure here reopens the deeper demand pocket.
RSI on this timeframe is hovering near neutral, giving room for either an extension or a quick reset into support before continuation.
Structure remains orderly, but momentum (again) is starting to show its first cracks — RSI has put in lower highs while price has pushed higher, marking clear negative divergence.
That doesn’t kill the uptrend, but it does raise the odds of a short-term fade into one of the nearby demand shelves before another attempt higher.
—Again, Check When Do Trends Change Part 1 for reference—
First intraday support is the 6415–6410 micro-base; below that, 6406 lines up with the 45m CRA and becomes the line in the sand for keeping the immediate sequence intact.
Heading into Monday, we’re sitting at the upper end of that short-term structure.
The edges are clear and same as always:
Fresh opportunities only come from decisive flushes into proven zones or sharp rejections from overhead pivots. Anything in between is just noise.
I don’t chase midrange.
The edge is at the extremes—flushes into proven levels and clean reclaims that trap the wrong side.
Flush beats grind.
Acceptance beats a wick and knife.
If we test a level the wrong way (slow, choppy approach) or can’t confirm with a reclaim/hold, I pass.
The plan is simple: let price come to the edges that matter and make us take it.
Here’s what I’m looking at with ES printing 6425 Monday morning
Likely Supports for 8/11 are:
High priority: 6410–6406(CA), 6390 (CRA), 6370 (CRA), 6348-6343 (D), 6290–6280 (D)
Medium priority: 6415(D), 6403-6401, 6398, 6392, 6376, 6362, 6356–6353 (D), 6334(CA), 6327, 6321, 6315, 6298, 6265 (CA), 6248, 6240 (CA)
Likely Resistances for 8/11 are:
High priority: 6431 (S & CRA), 6439–6443 (S), 6450-6452 (CRA), 6459(CRA)
Medium priority: 6435, 6450, 6460 (S), 6455, 6468–6470 (S CRA), 6486, 6502, 6505, 6511, 6514, 6518, 6532, 6540 (CA)
With price at 6425 I see 6407-6402 CRA. Former breakout pivot from late July, defended as both resistance and support. Friday afternoon multi tested support. I want a flush of this area as low as 6397. Above here, I want to see acceptance take place where price finds a low, retests the flush point, forms reversal, ideally offer positive divergence, and then put in a full reclaim. This is a first level zone after Friday’s price action. Therefore, longtime ESDaily readers already know what I’m about to say: It carry’s more risk. The combo of the divergence at supply on the smaller timeframes would mean a structural support test is required before the continuation can occur. But if bulls are hungry, we won’t get further liquidation.
For me my first opportunity I’m seriously interested in lays a bit further down.
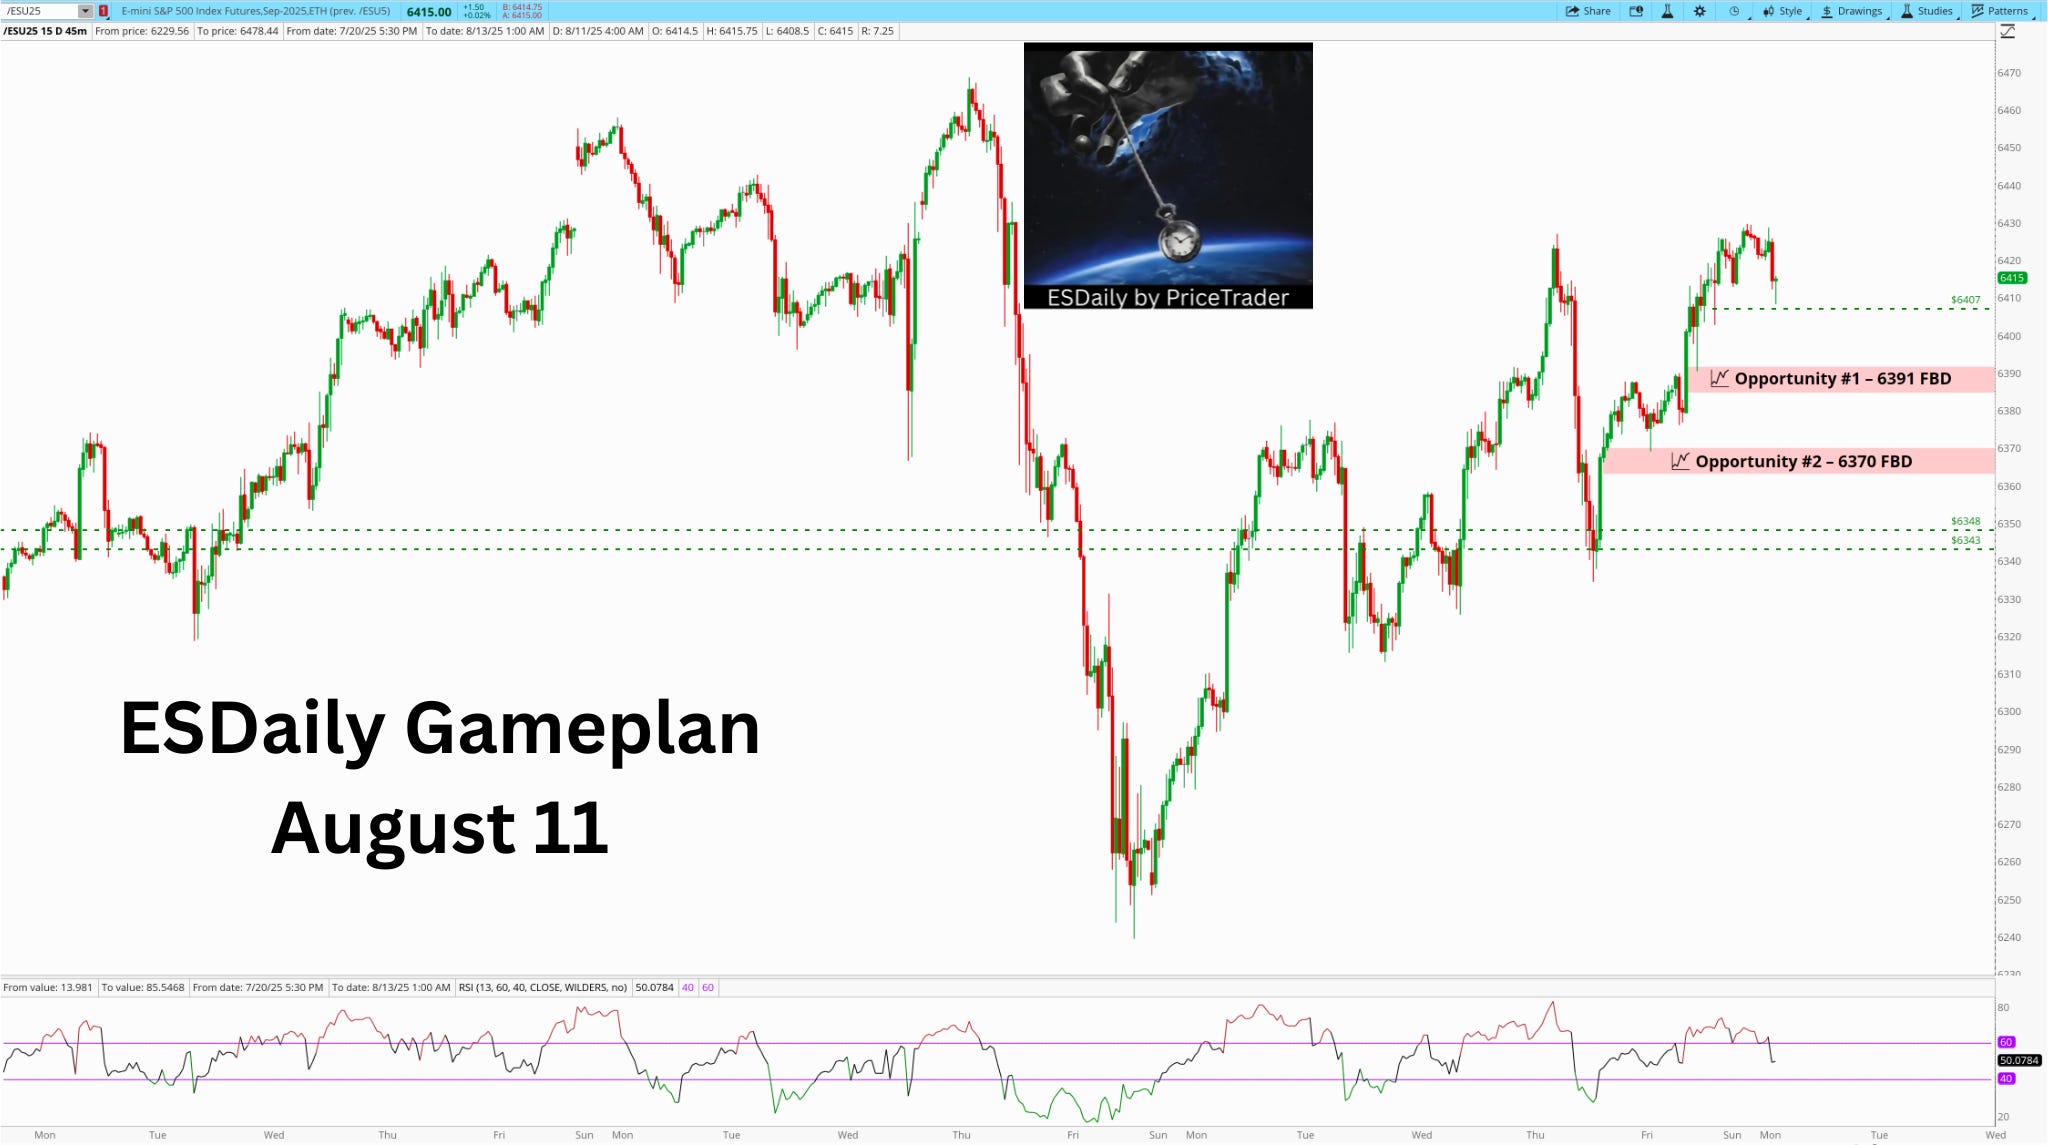
📈 Opportunity #1 – 6391 FBD
6391 FBD
The first real test I’m interested in if we can’t find an entry above. A failure of Friday’s low after we launched from 6380 to 6410. This pivot would be a level bulls want to defend. The level is one of beauty, structurally. The high of 8/7-8/8AM resistance turned into Friday’s 11:40AM low. It started forming as a critical area being built during recovery from the early-August drop, reinforced by multiple bounces. Needs a sharp hit into 6379, not lower. This flush followed by immediate acceptance reversal and reclaim of flush point on the 15-min/45-min. Approach matters. I do not want a grind into the area. Steady selling and a flush is what I want, not a knife.
Beneath here we have an LTB DBR at 6382-6377. It’s not fresh as Thursday 6PM - Friday 8AM we hovered in this same area. The demand came at 9AM Thursday morning. If price flushes 6391 and doesn’t form acceptance above the LTB, I’m looking at either:
Confirmation entry away from the 6382-6377 demand
A higher risk (in the form of stop required) of the 6391
The approach and price behavior will be my guide. Typically in LTB’s I’m ok with direct bids as long as the RSI rules apply. But here we have a zone that’s not fresh, and a flush of the 6391 is very unlikely to provide me with the RSI rules required — even if it was fresh. Therefore my rules are as stated.
Either way, neither of these levels are direct bids. I must have price confirm a low for me.
Less this, I’m looking at:
📈 Opportunity #2 – 6370 FBD
Thursday August 7th resistance turning into support for the Friday 1:30AM launch pad. 6370 is a magnet for the past 2 weeks since the July 30th FOMC low was put in place. We’ve touched and respected this area nearly 10 times since then and it’s a clear structural line in the sand. I’d look for price to sell off hard from 6425 and ideally find a low at 6362 before offering a reversal in price behavior. However, if a true liquidation occurs 6357 would be the lowest price I’d be willing to accept before taking the reclaim.
If 6370 is flushed and price does not reclaim it with conviction there’s a lot of room for bears to thrive. The listed high priority support of 6348-6343 (D) would be the next area of interest.
Let’s focus on what matters - Sticking to the Gameplan and understanding that market will always offer opportunities.
My job is to remain patient, eliminate noise, and execute only at areas of high reward:risk.
If executed, follow the profit taking system that reduces risk:
Locks in gains
Captures pieces of the move
Don’t swing for the fences
See you in the chat to execute live if/when levels are hit
-PriceTrader
Tuesday August 12, 2025
Flush or Follow Through
Yesterday couldn’t have been a better reminder of why we wait.
And wait we did.
Nothing done until 3:51PM as ES spent most of the day in a choppy grind down.
Along the way I updated in the chat - nothing doing.
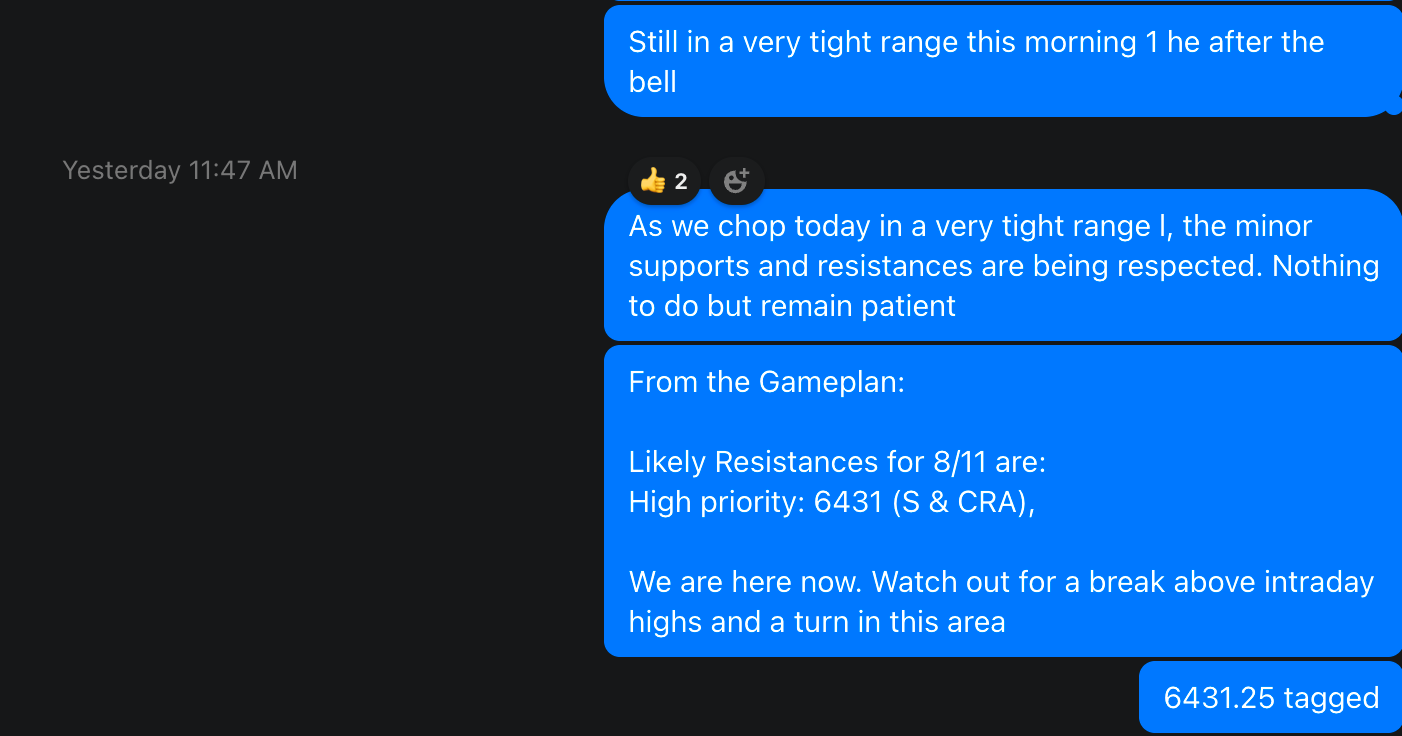
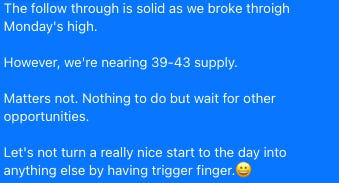
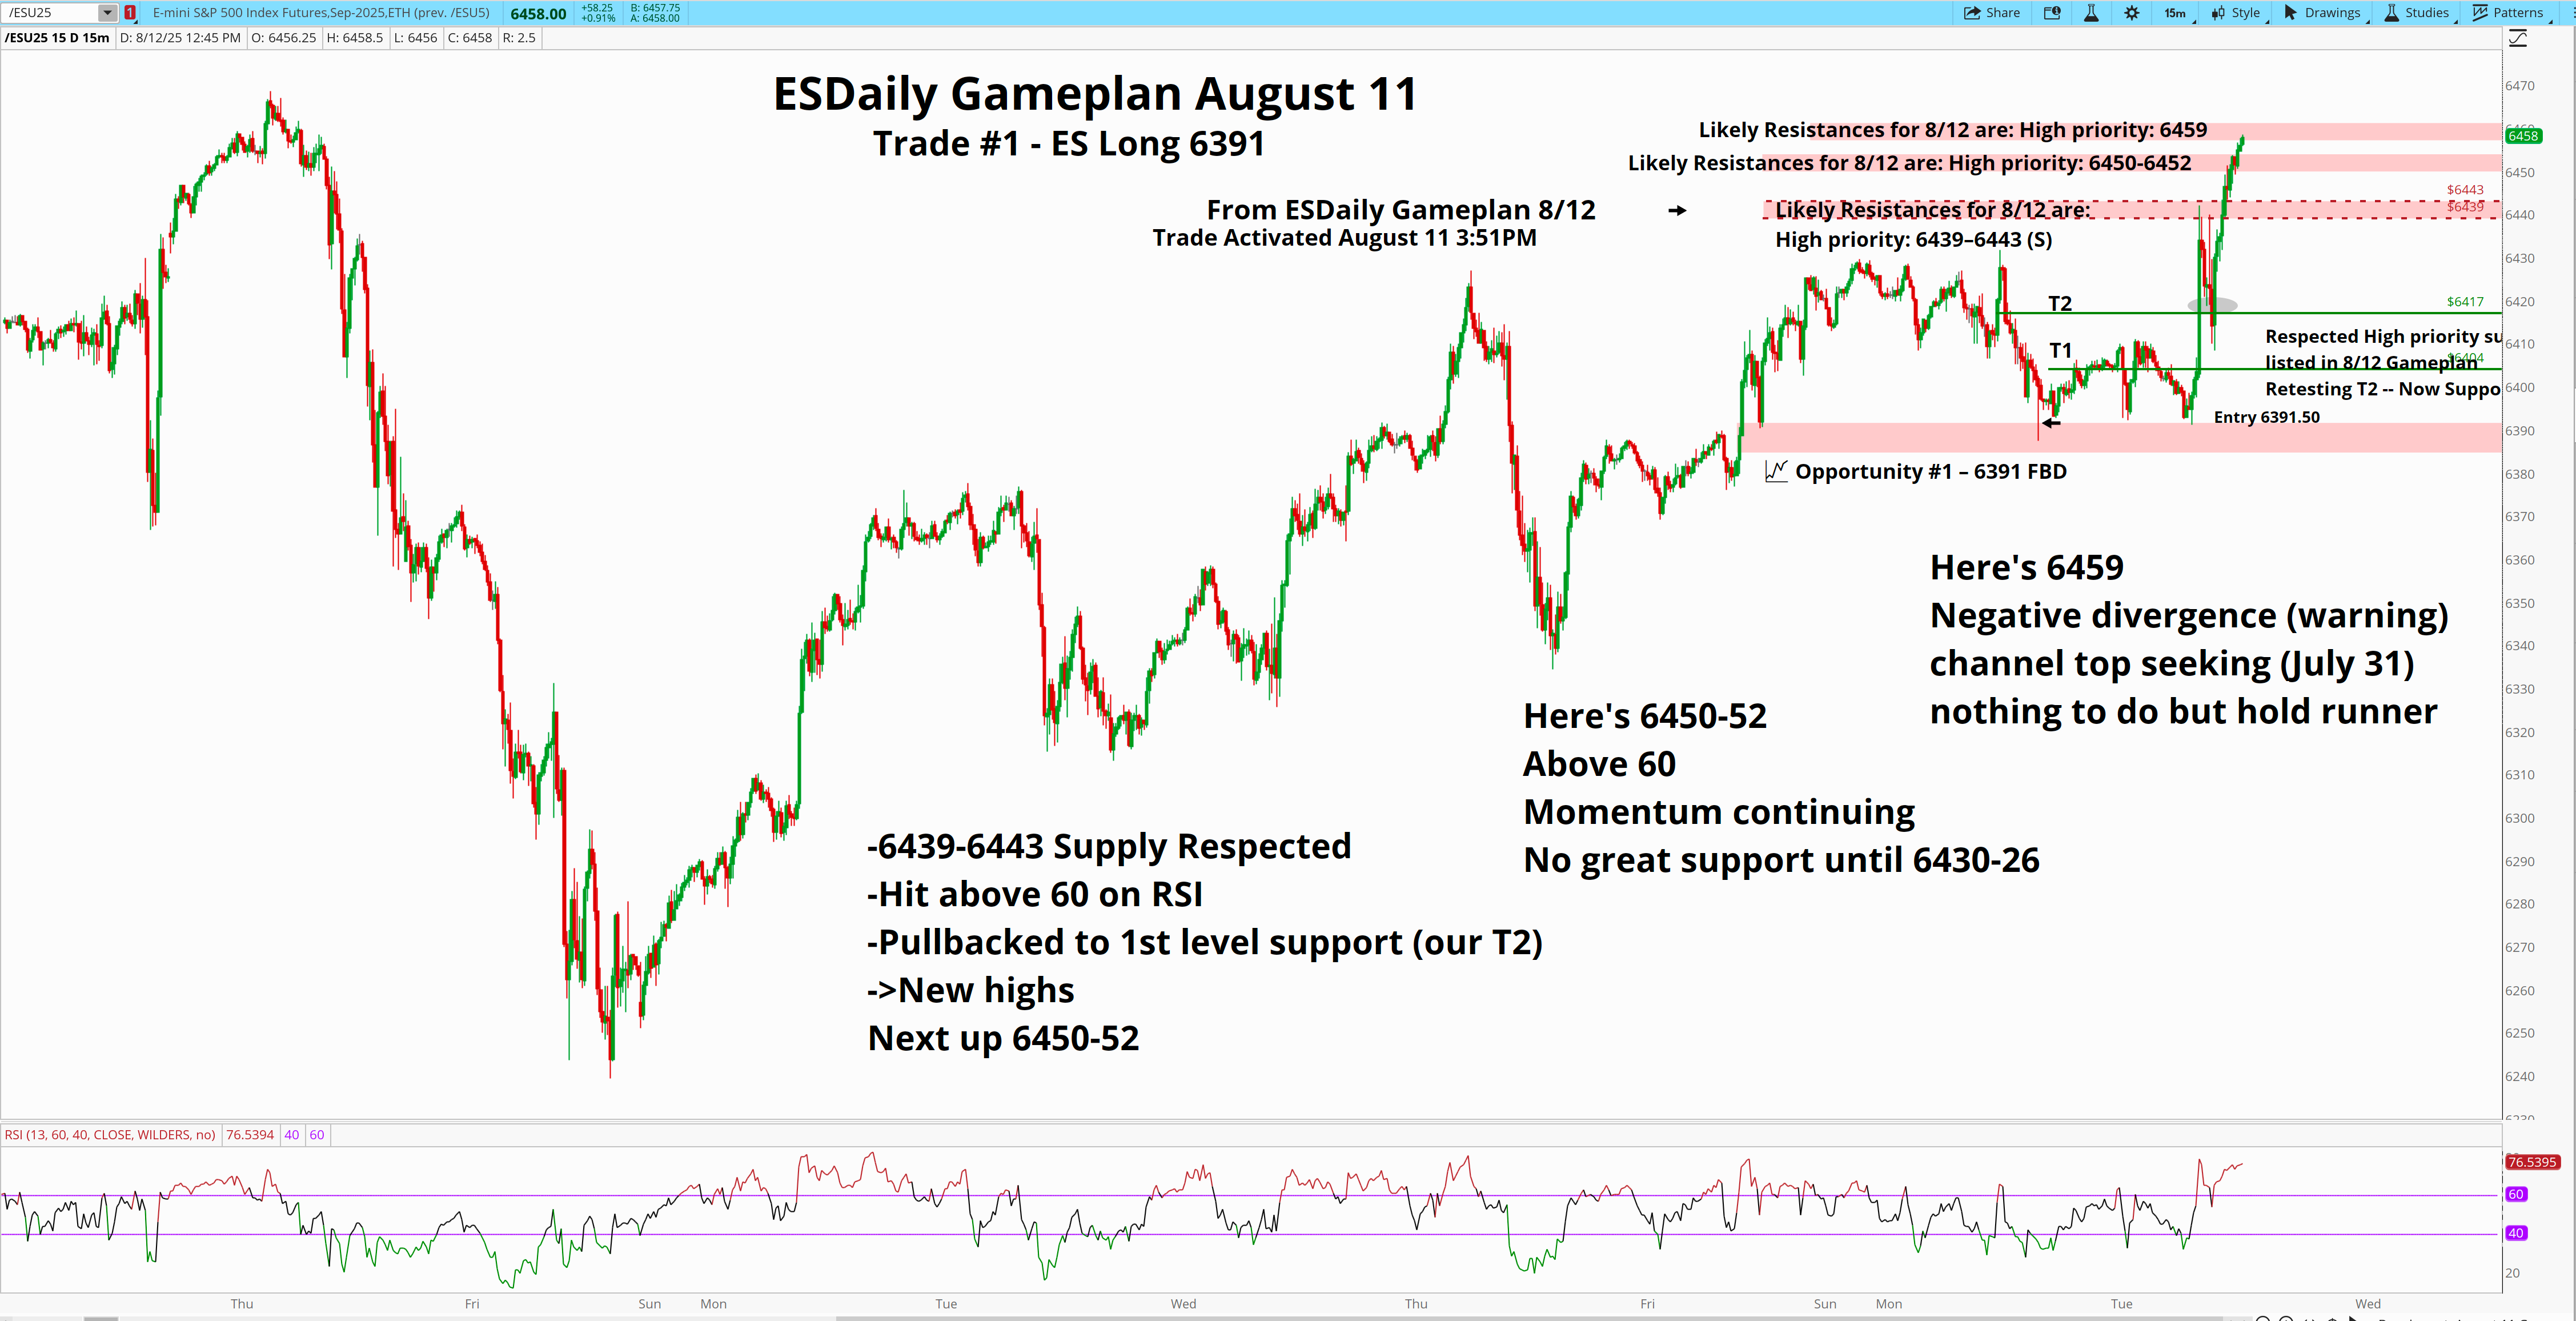
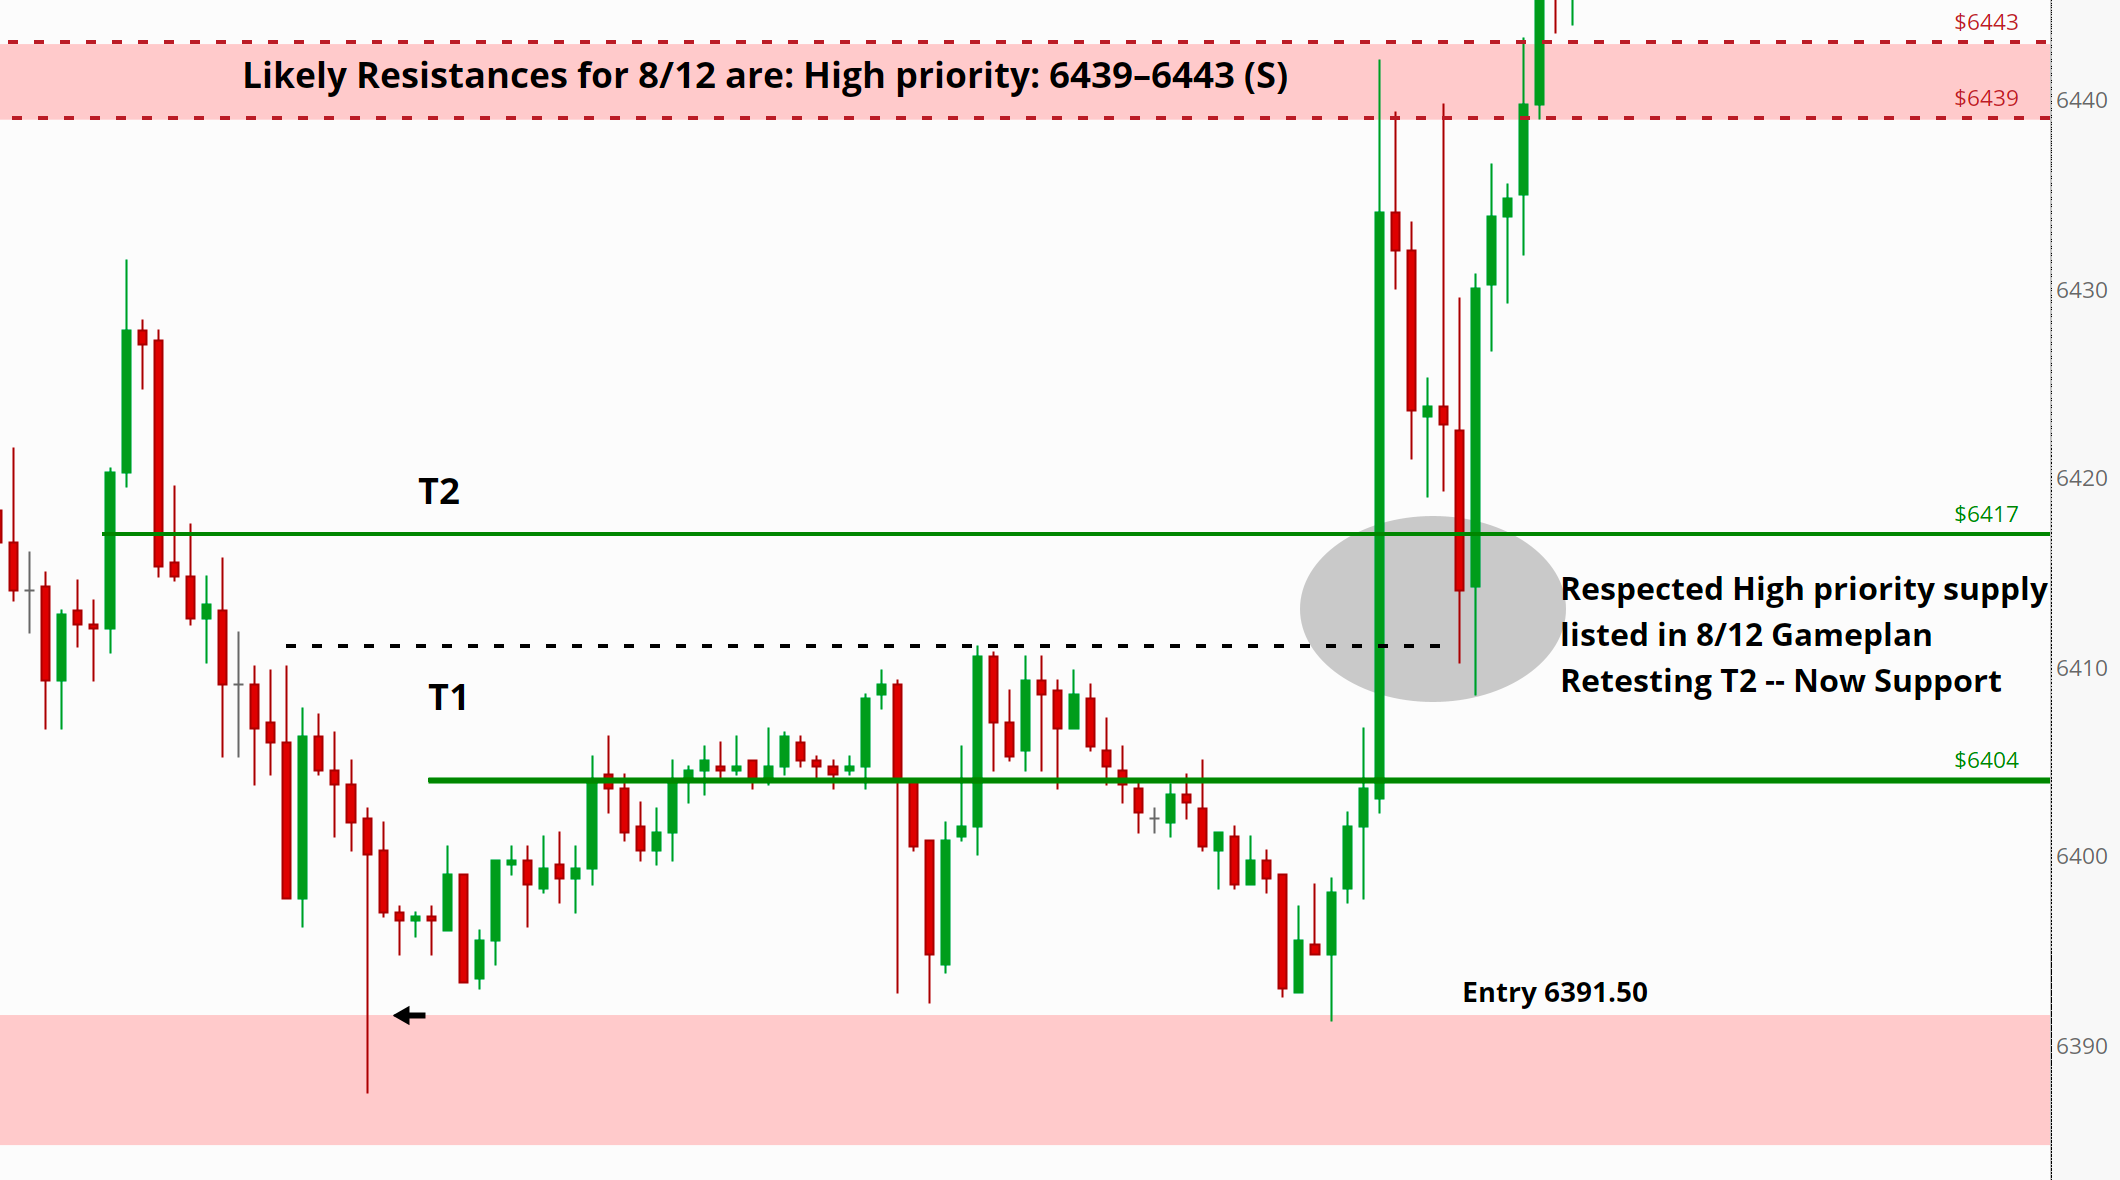
Then the supply level posted in the August 11 ESDaily Gameplan was hit - The high of the day. 6431.25
Called it in the chat and we sold off off from there in a methodical step-by-step walk down. Finally 15 min before the bell. We got an opportunity.
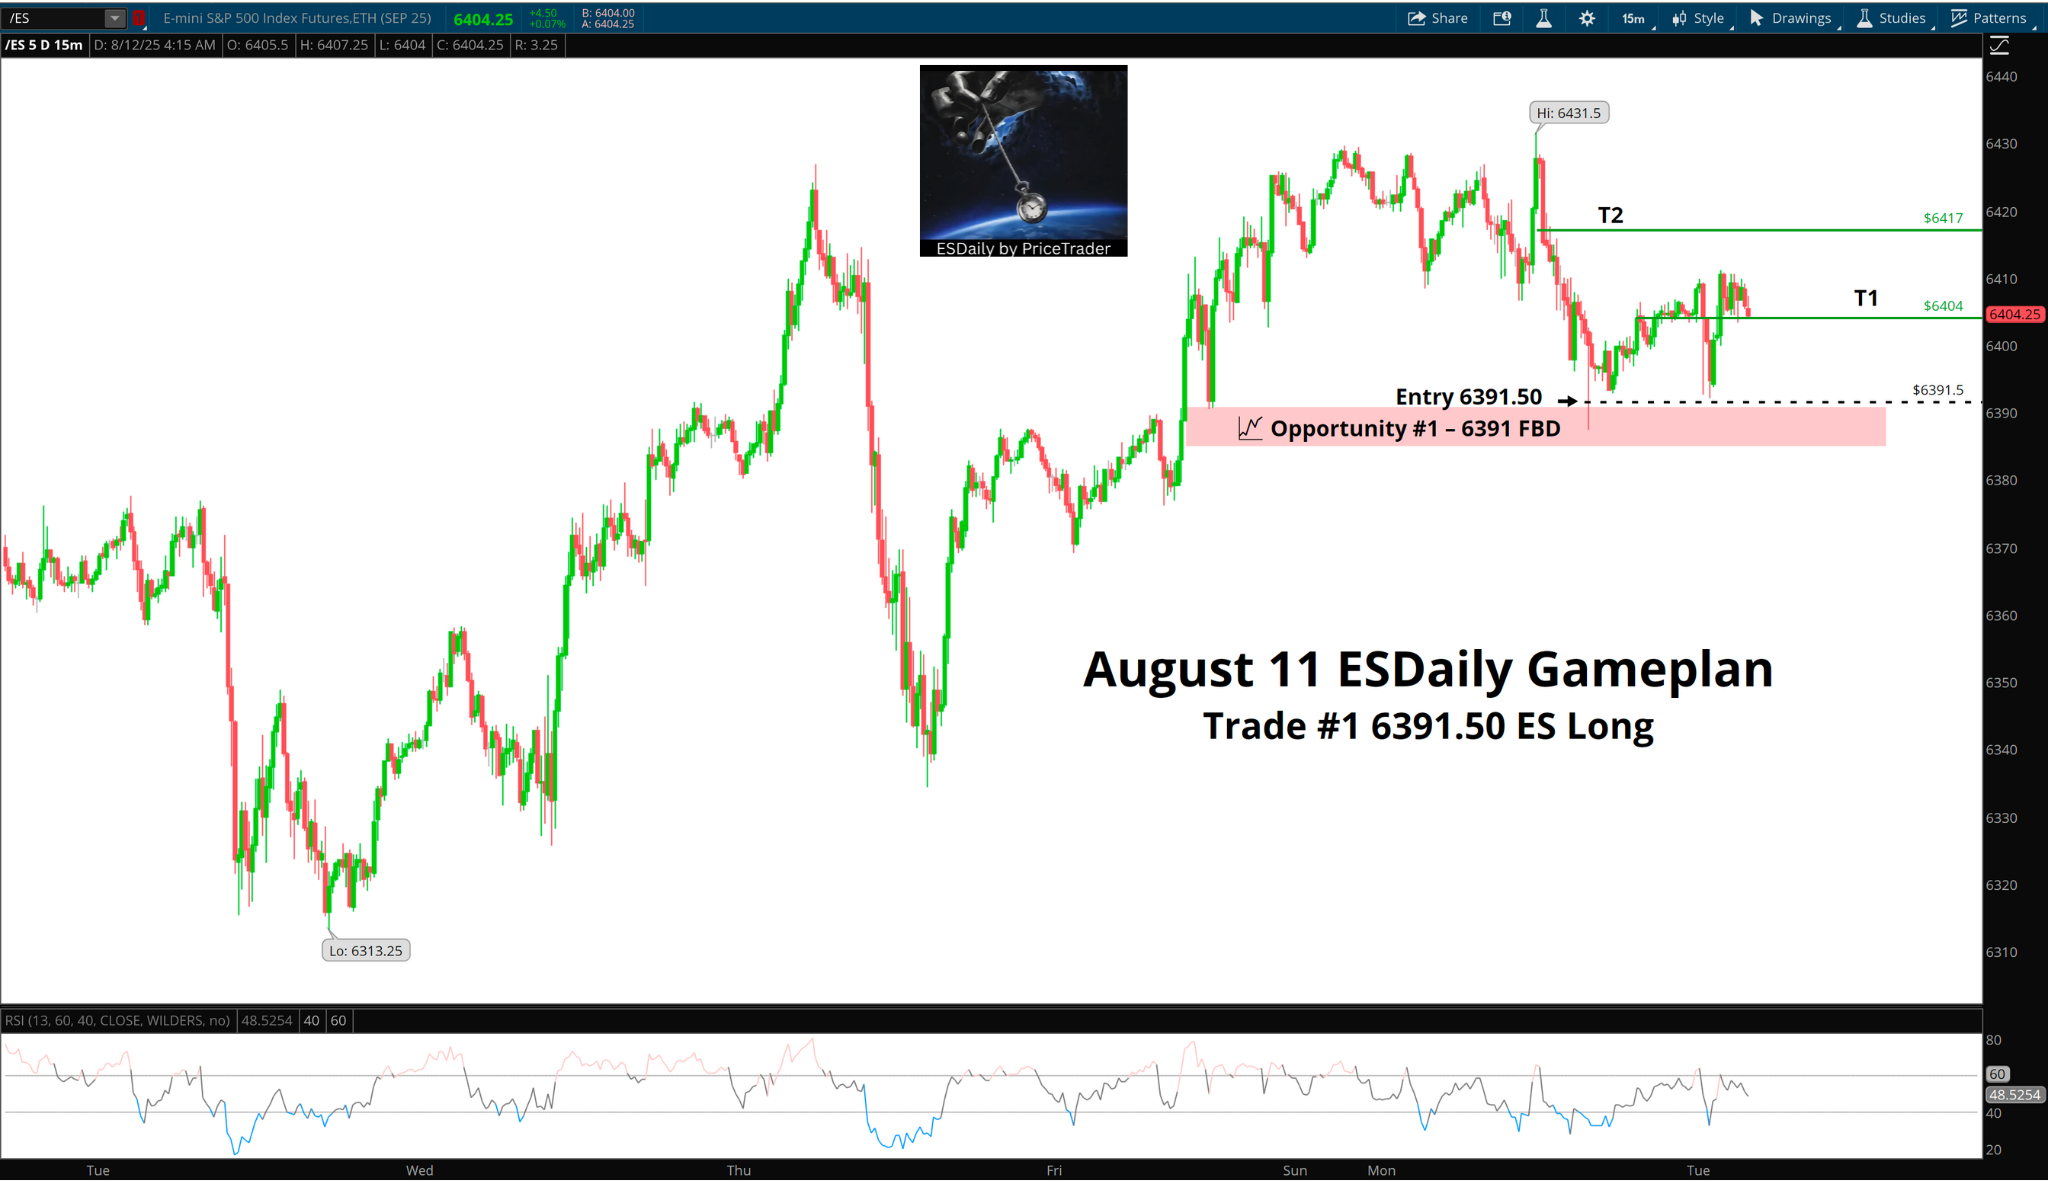
The 6391 level we marked in the plan?
It did exactly what we wanted — flushed clean, trapped the sellers, reclaimed the pivot, and handed us a long that’s still paying.
Entry was 6391.50.
T1 at 6404 is locked in, and price is holding above it as we head into Tuesday.
T2 at 6418 is still on the table.
That trade came straight out of the playbook — really a textbook trade as far as waiting for entry and acceptance and execution.
No midrange chasing, no forcing it.
Yesterday was an amazing day to get chopped up if you are impatient.
So we let the level get hit
Let the reclaim confirm,
Only then step in.
That’s the edge. And now, the only question is whether we build from here or drop down to reload at the next shelf.
Let’s zoom out before we set the day’s edges.
The 4h trend is textbook from the August low — clean stair-step higher. Friday’s 6468 high brought sellers out, Monday pulled back right into 6391, and that’s where buyers drew the line.
Lose 6370 and it stops being a pullback and starts being a structure break.
Until then, the benefit of the doubt stays with the long side.
This is where the key shelves line up:
6406 — CRA from last week’s breakout. Buyers will want this defended early.
6391 — Friday’s low into launch, now proven live yesterday.
6370 — the magnet. Since July 30 FOMC low, this level has been tested about ten times without breaking.
On the other side, 6418 and the 6428–6433 band are the nearest trouble spots above. The latter is the same supply zone that capped last week’s breakout attempt.
Yesterday’s reclaim at 6391 was exactly how you draw it up.
Flush, snap back, reclaim the flush point, push to first target.
Today the same rules apply — the best trades will come from the edges.
Flush into proven levels or fail from overhead pivots. If we’re hanging around in the middle, I’m not interested.
Keeping it simple today:
Here’s what I’m looking at with ES printing 6404 Tuesday morning
Likely Supports for 8/13 are:
High priority: 6468 (CRA), 6448–6446 (D), 6429 (CA
Medium priority: 6480, 6474, 6460, 6424, 6419, 6412, 6404, 6391 (CRA)
Likely Resistances for 8/12 are:
High priority: 6419, 6431 (CRA), 6439–6443 (S), 6450-6452 (CRA), 6459(CRA)
Medium priority: 6410, 6435, 6450, 6460 (S), 6455, 6468–6470 (S CRA), 6486, 6502, 6505, 6511, 6514, 6518, 6532, 6540 (CA)
📈 Opportunity #1 – 6370 FBD
If 6391 gives way, this is the next line in the sand. Ten touches since July 30 and still standing. Thursday’s 1:30 AM launch pad started here.
If we get a hard sell from above into 6362–6370, I’m watching for reversal behavior and reclaim. If it fails, there’s air down to 6348–6343 demand.
📈 Opportunity #2 – 6348–6343 Demand Test
If 6370 breaks with momentum, this is where I’ll look next. It’s the deep demand that kicked off the August recovery. Needs flush-and-reclaim before I’ll touch it.
I’m going to manage the open 6391.50 long with the same discipline as yesterday — no adding unless the a level is retested properly. If we’re bid into overhead supply, I’ll watch the key supply levels closely and monitor trend before I see a potential trend shift. I want clean flush/reclaim behavior before stepping in, trade management and porfolio exposure here is key.
Anything in between is just noise.
Stay patient. Let price do the work. Find me in the chat.
—PriceTrader
Wednesday August 13, 2025

Yesterday’s session didn’t just confirm strength — it reminded us why patience pays.
Monday’s 6391.50 FBD long continues to do its job, and Tuesday gave us the kind of follow-through that validates the setup and the hold.
No grind. No messy chop.
Once 8:30AM news hit — just a clean bid off structure that we already knew mattered, driving straight into fresh highs.
Yesterday inside the ESDaily chat room - I commented on the price moves as price tagged structure.
It was an excellent lesson in intraday trends and precisely why I do not counter trend trade.
I’m going to offer a sequence of events that outline how the price was built, where it was respected, and what ultimately played out….
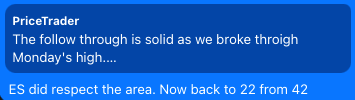
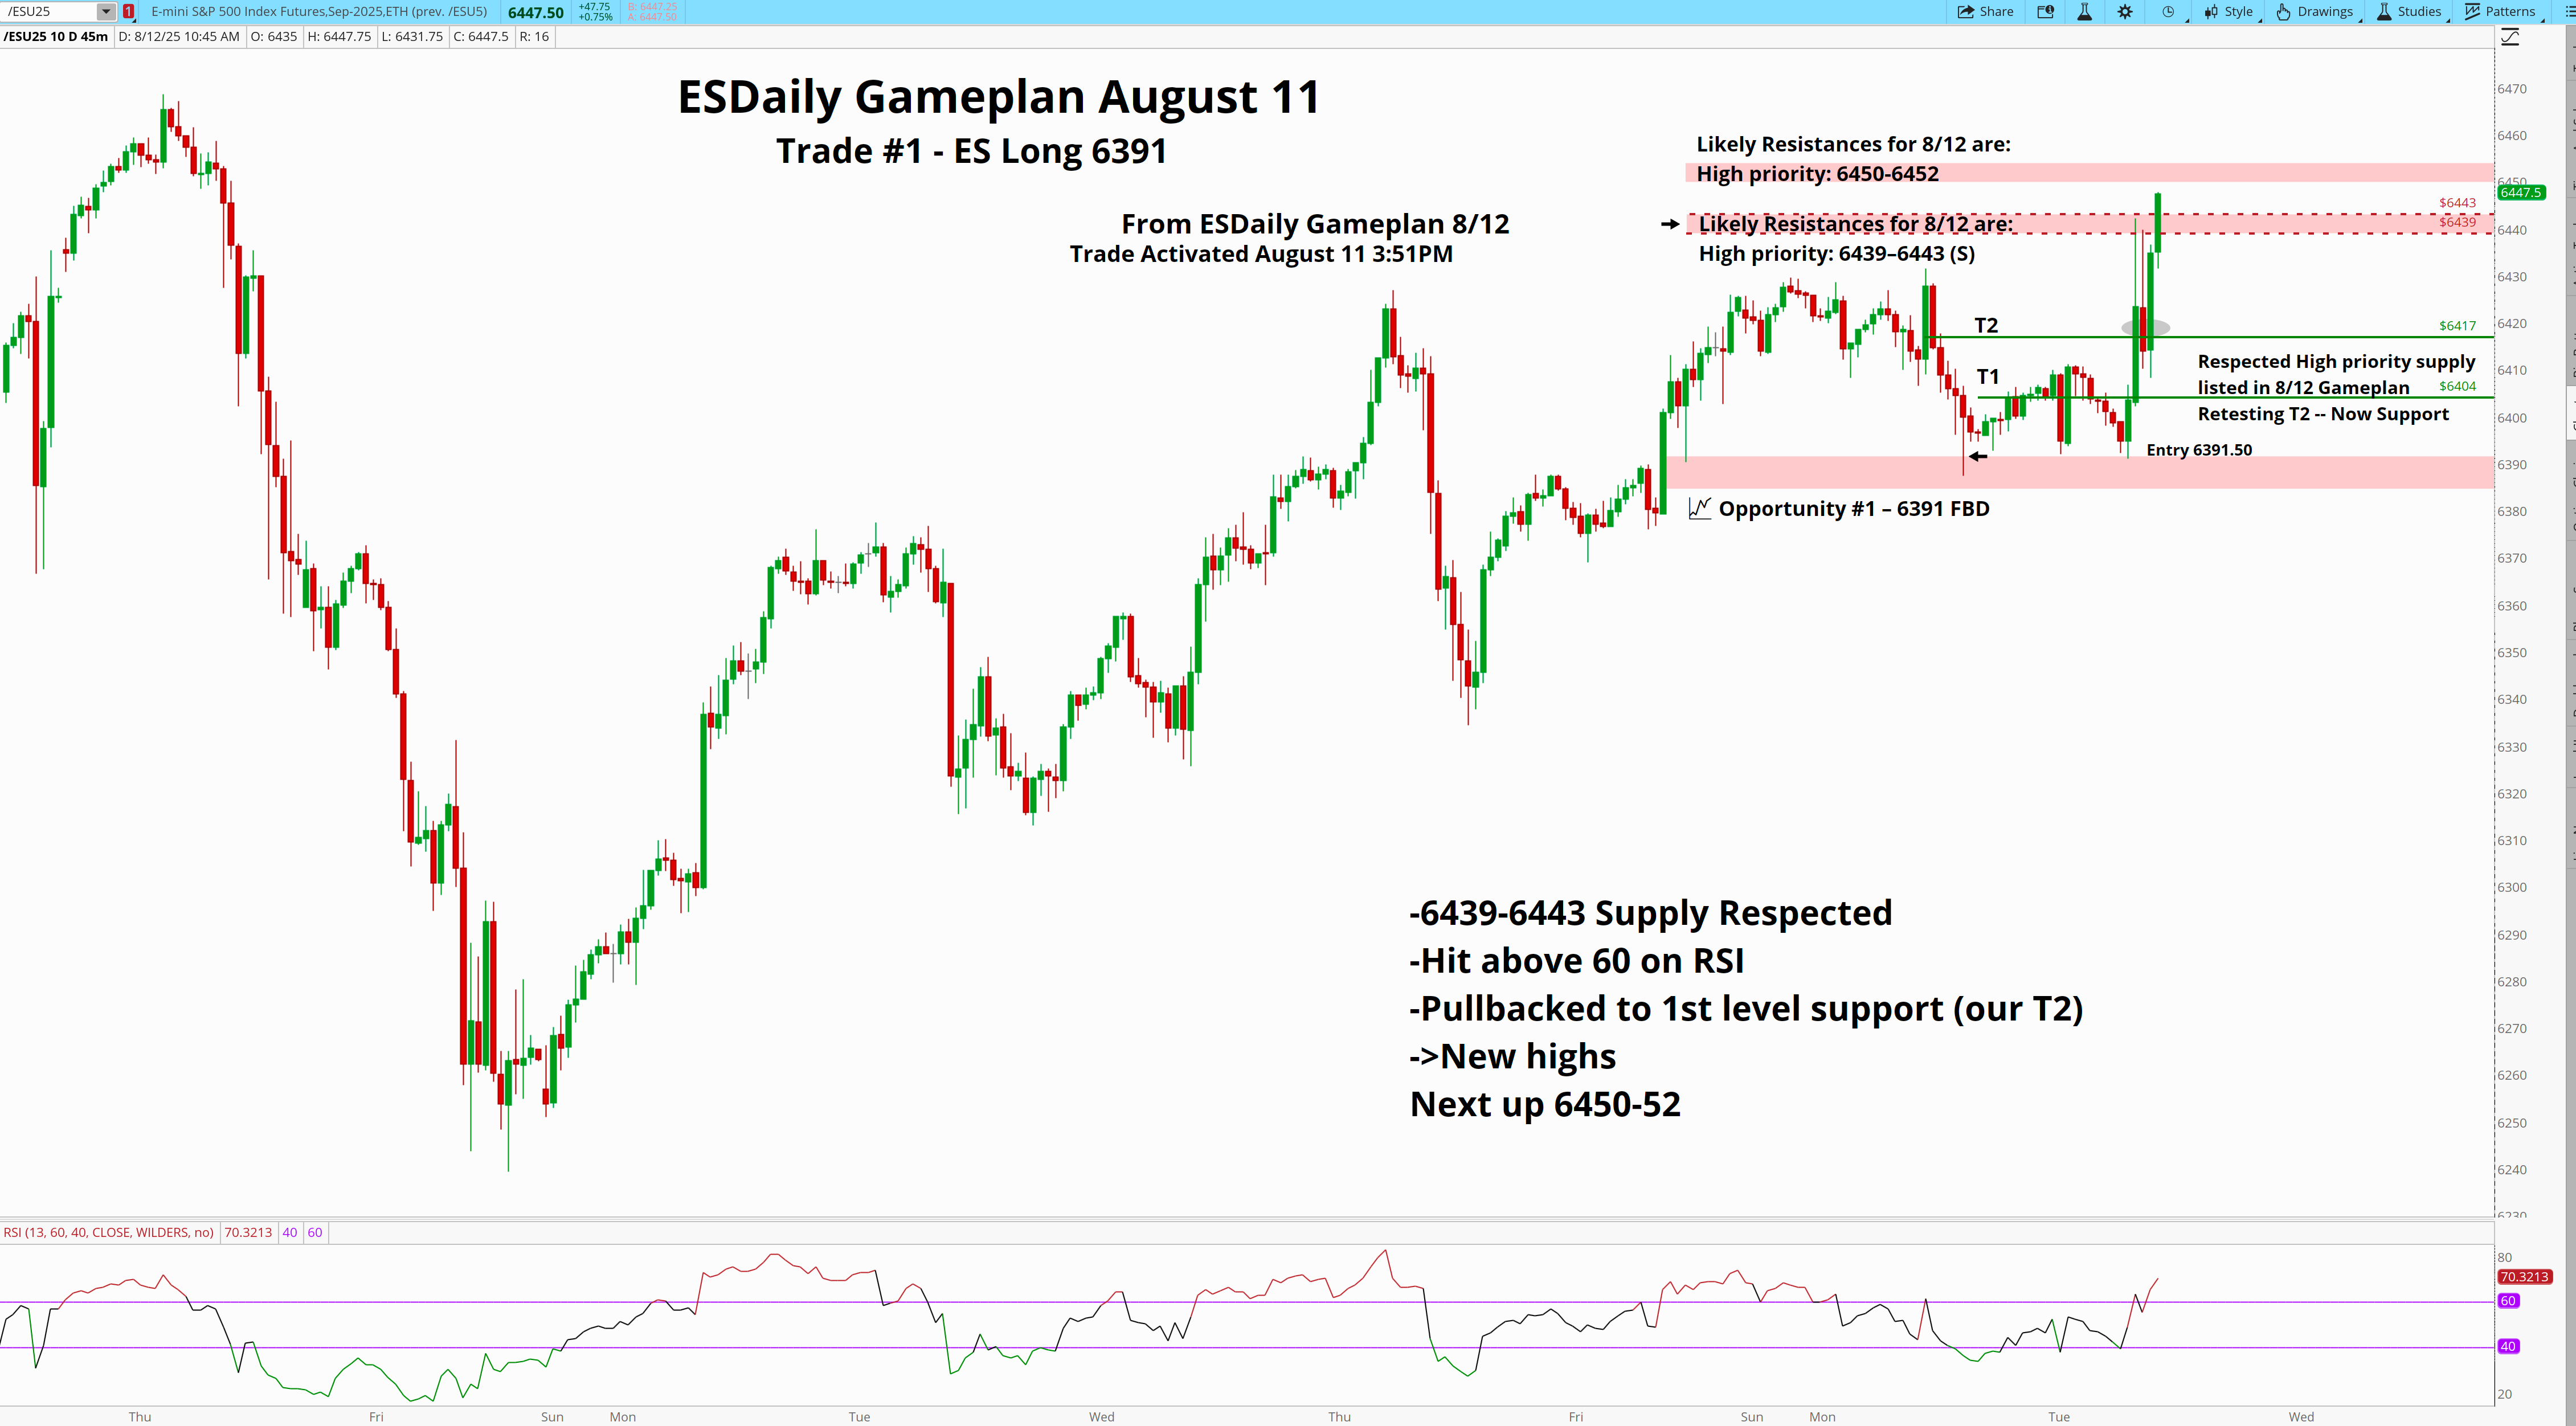
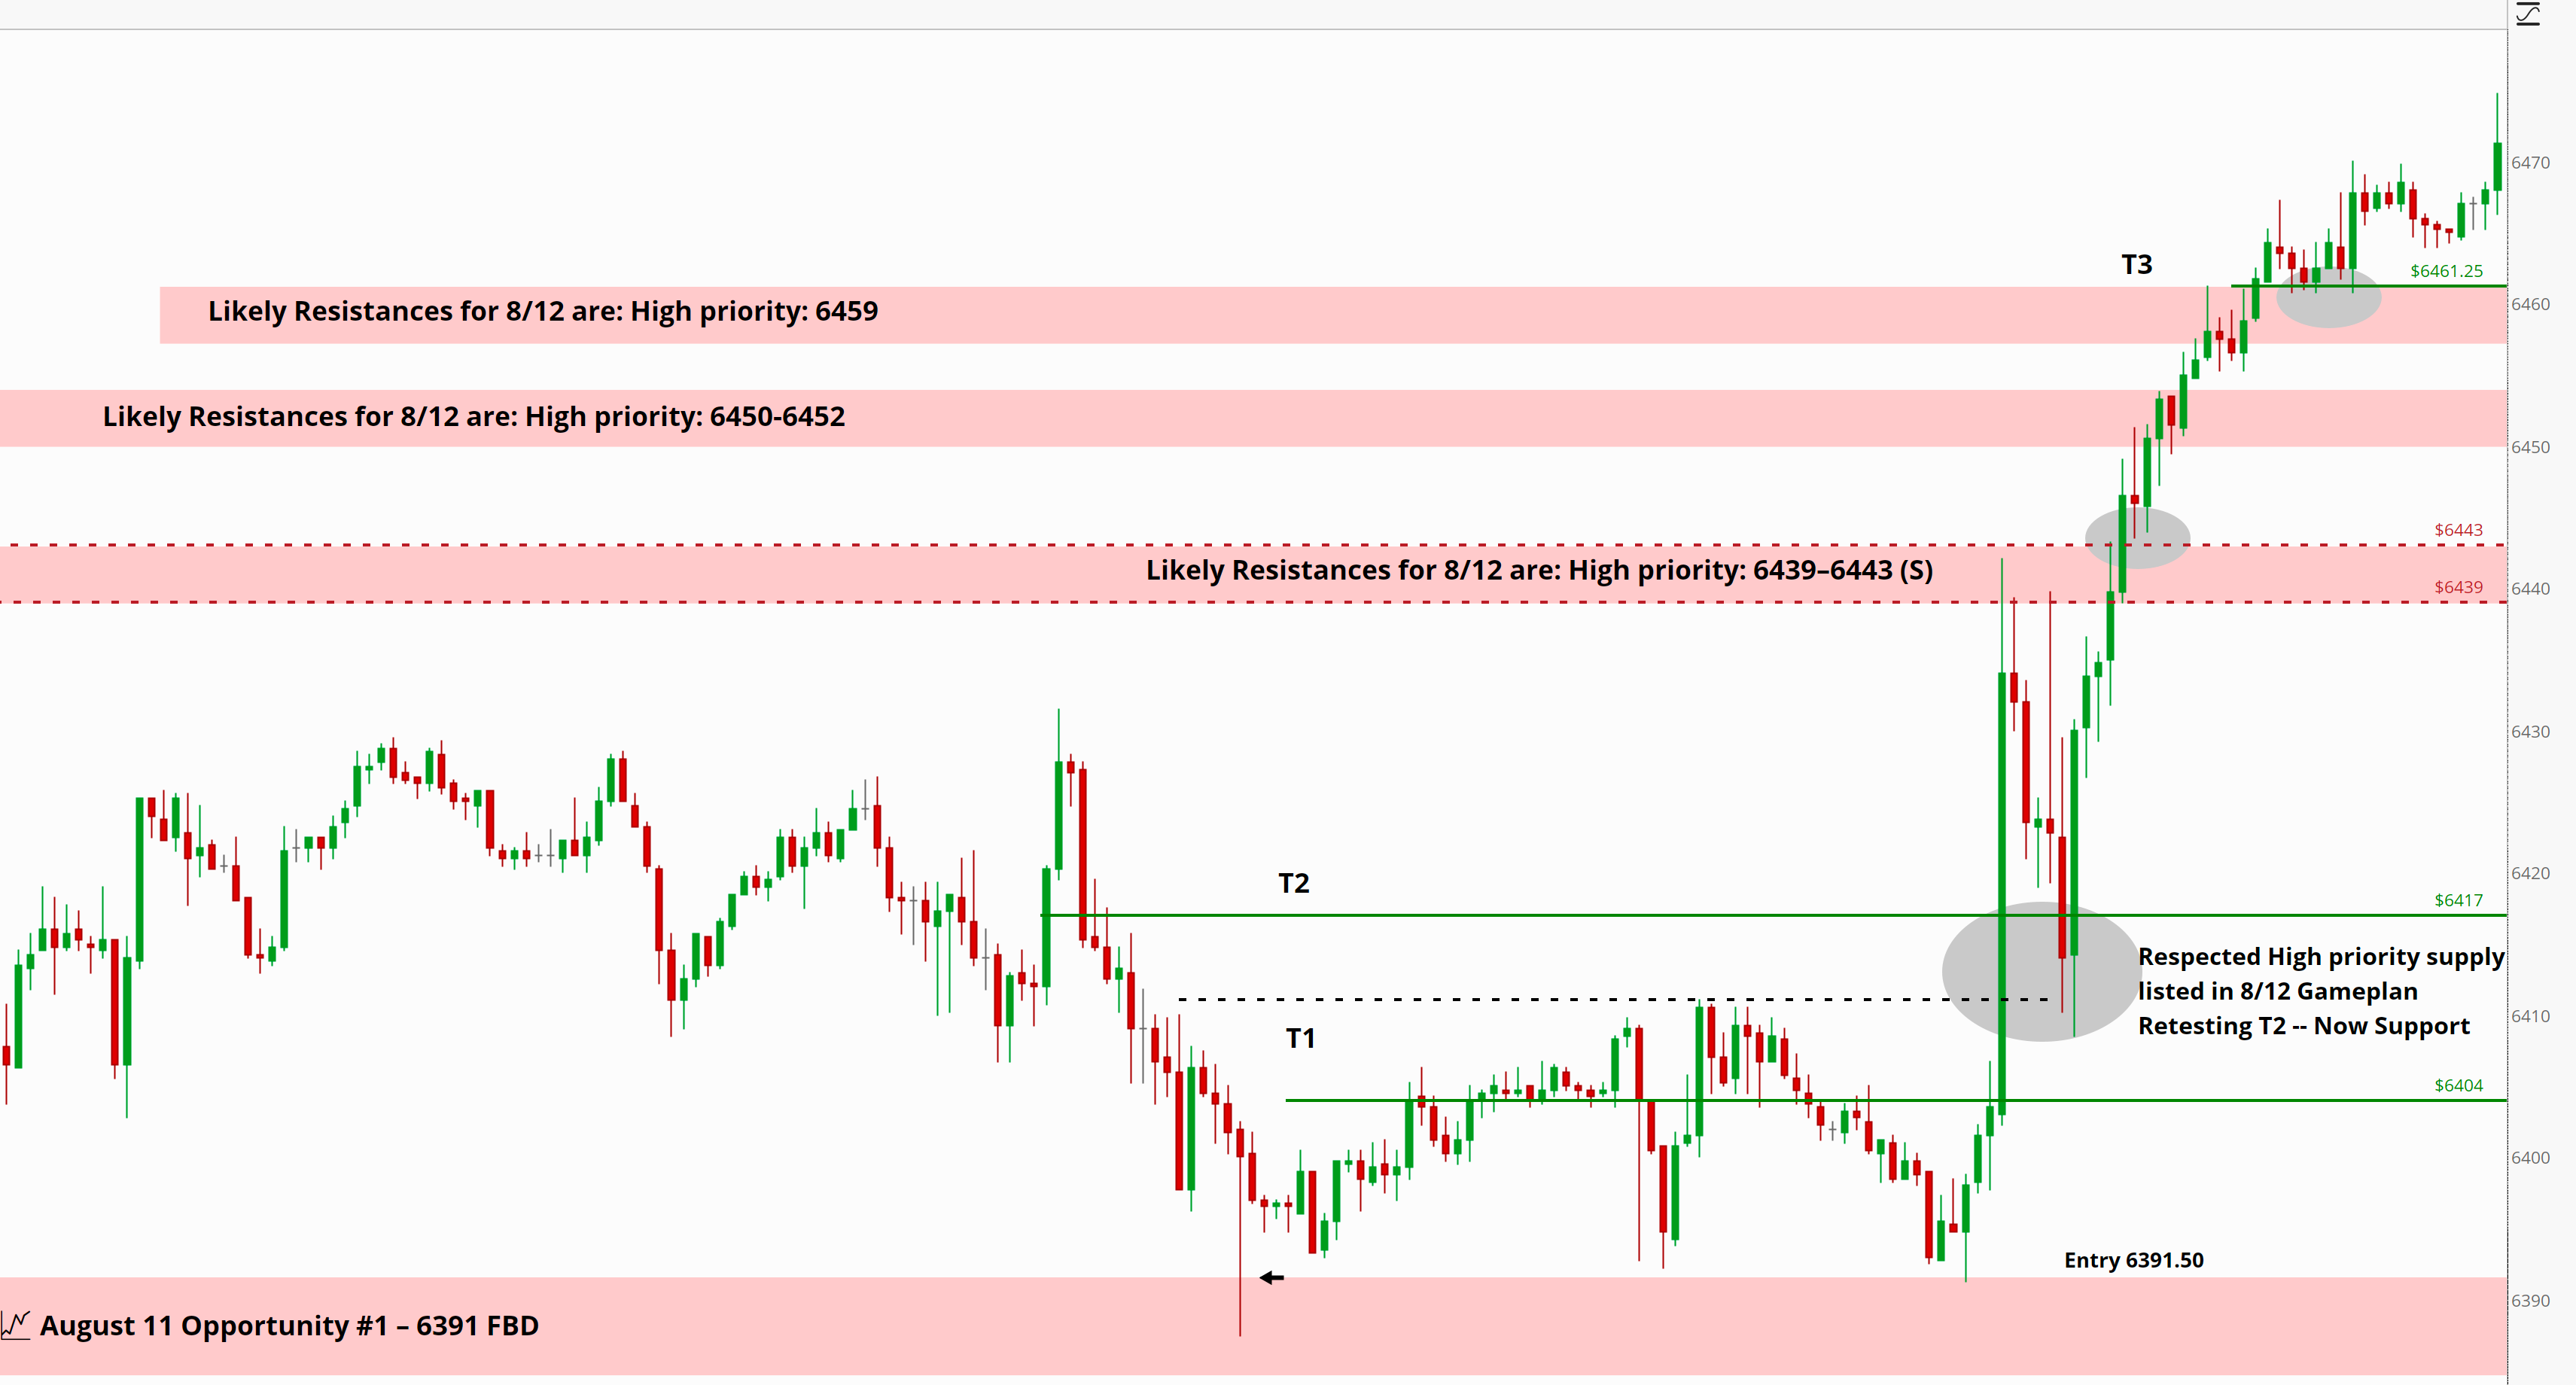
In bullish moves the High Priority resistance levels were noted in the August 12 ESDaily Gameplan.
Once CPI hit and we were off to the races - each of the following I documented as price hit.
Likely Resistances for 8/12 are:
High priority: 6439–6443 (S), 6450-6452 (CRA), 6459(CRA)
Take a moment, follow along, and reference the charts with annotations.
Again, it’s a lesson I wish I understood a long time ago.
Here’s the ongoing notes on a 15 min chart.
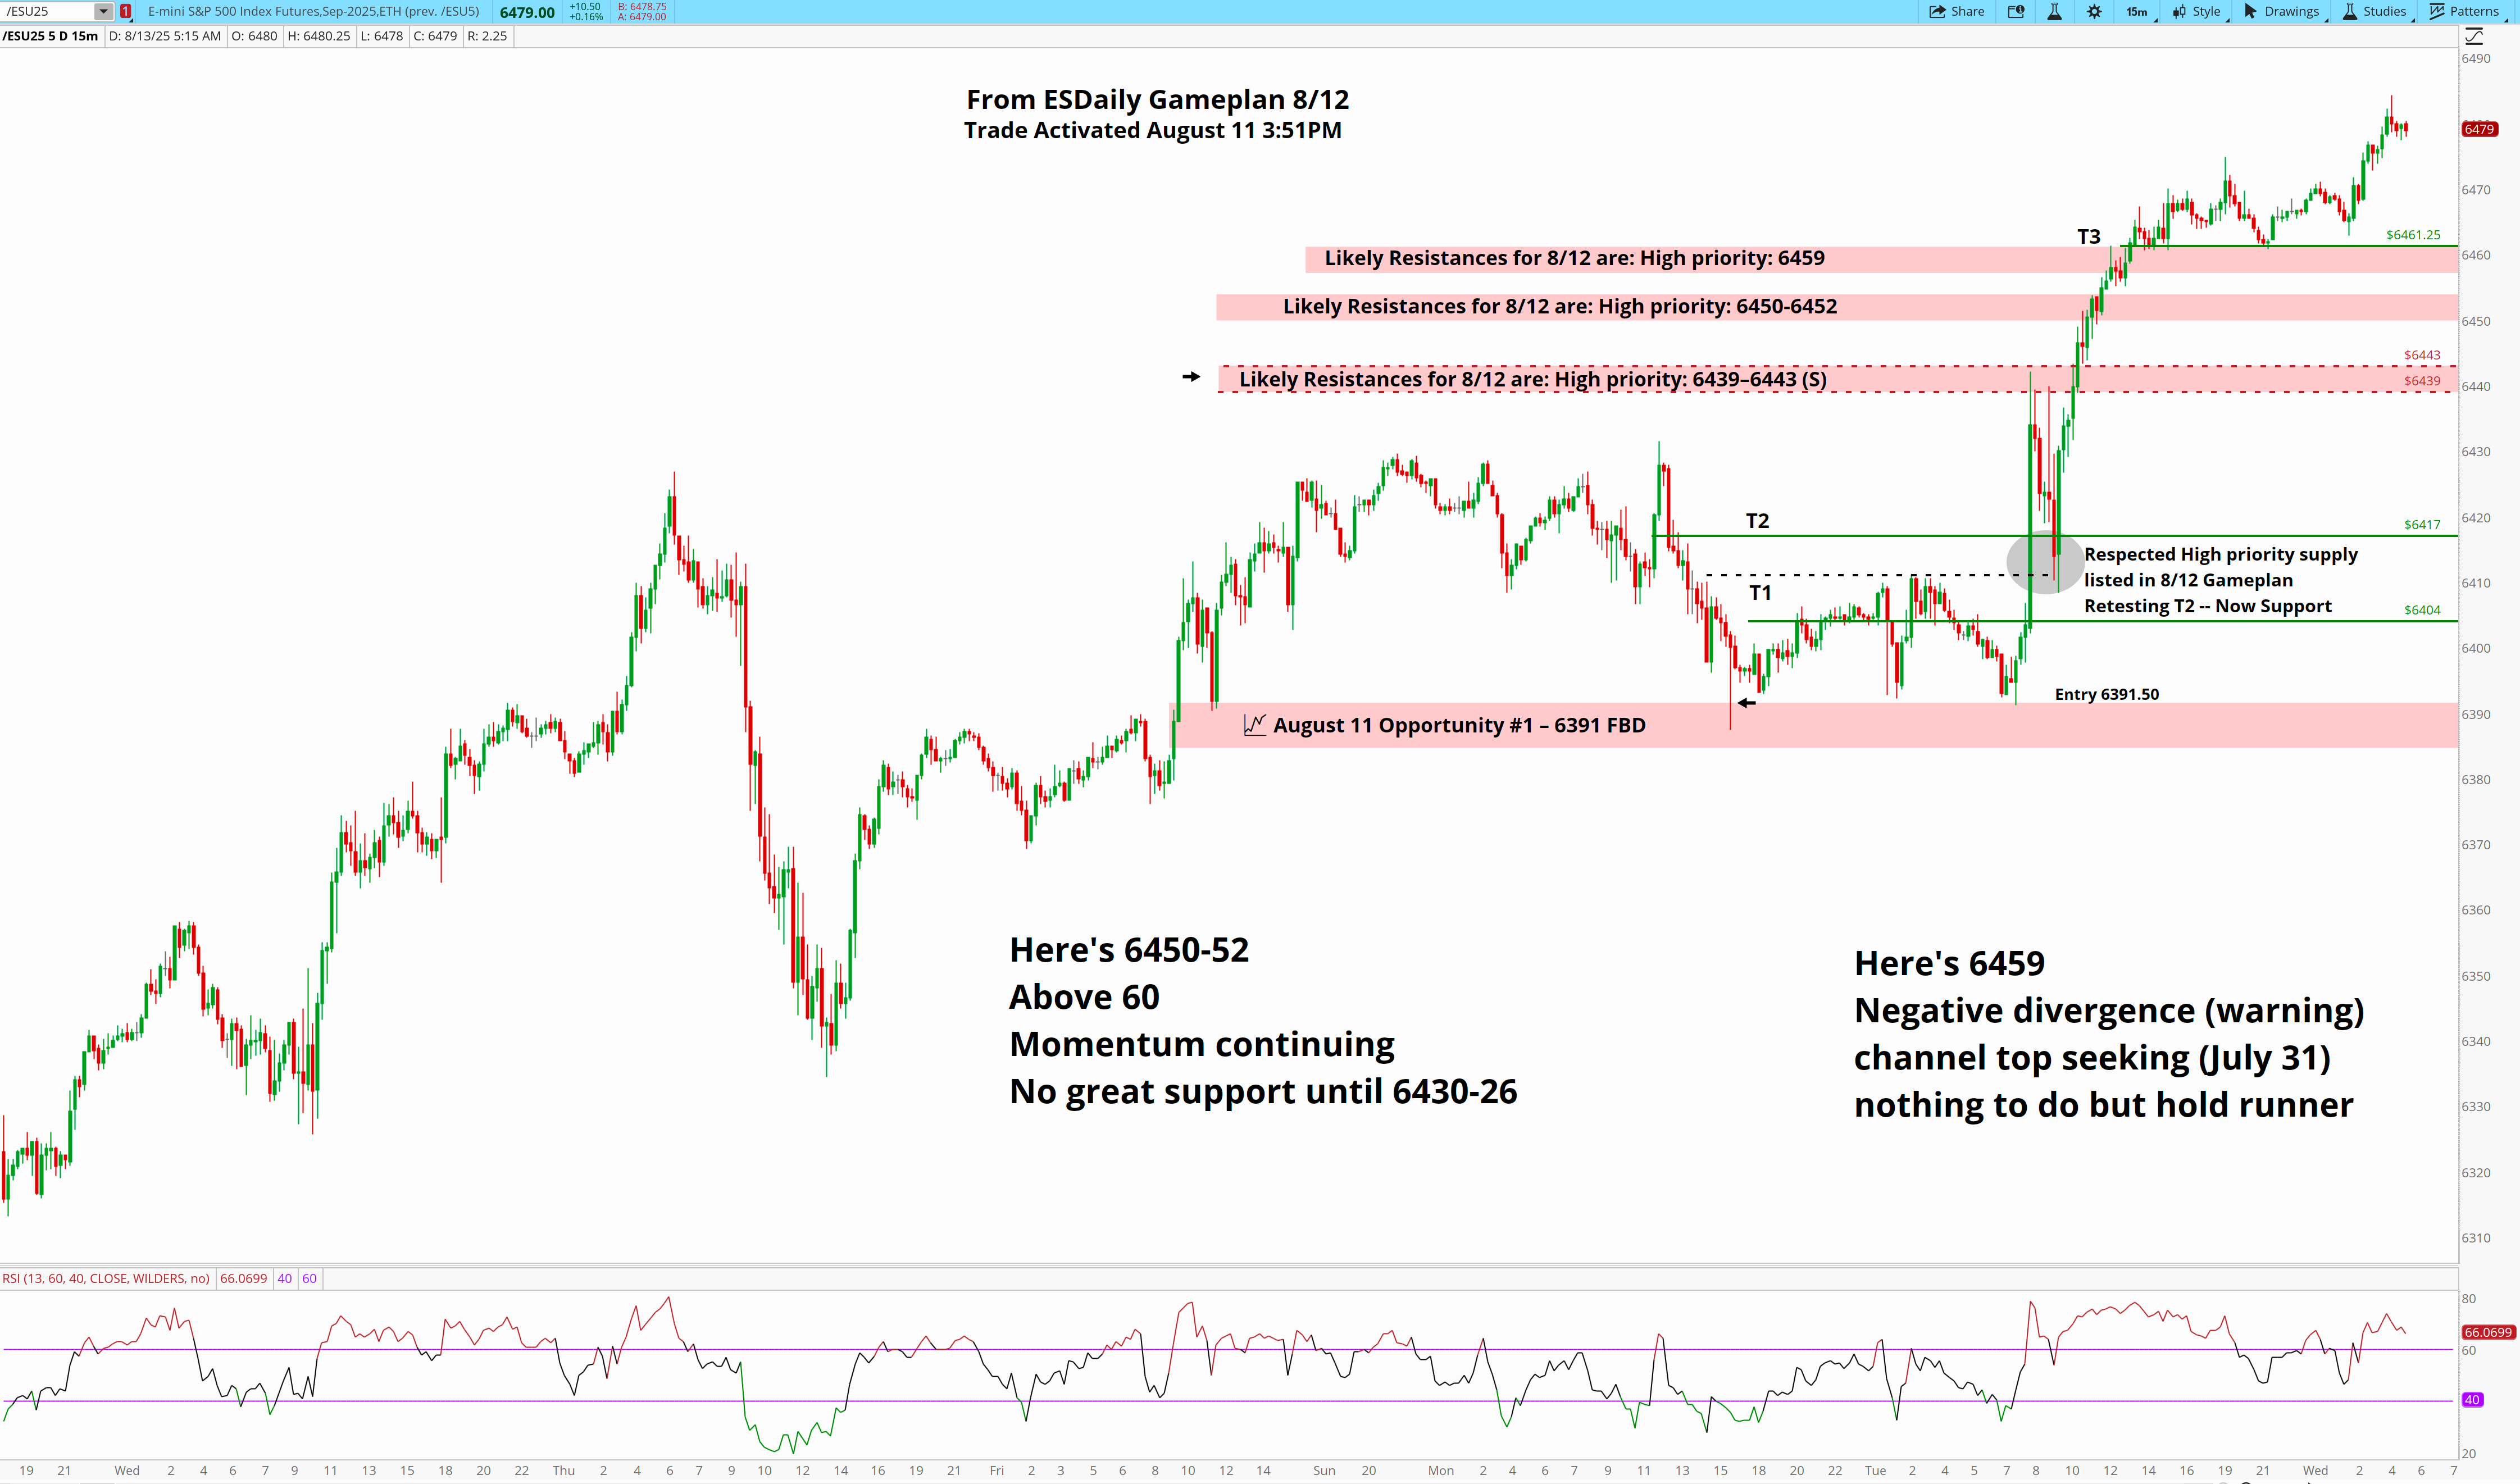
Step-by-step from the chat:
8:40 AM
9:10AM
9:52AM
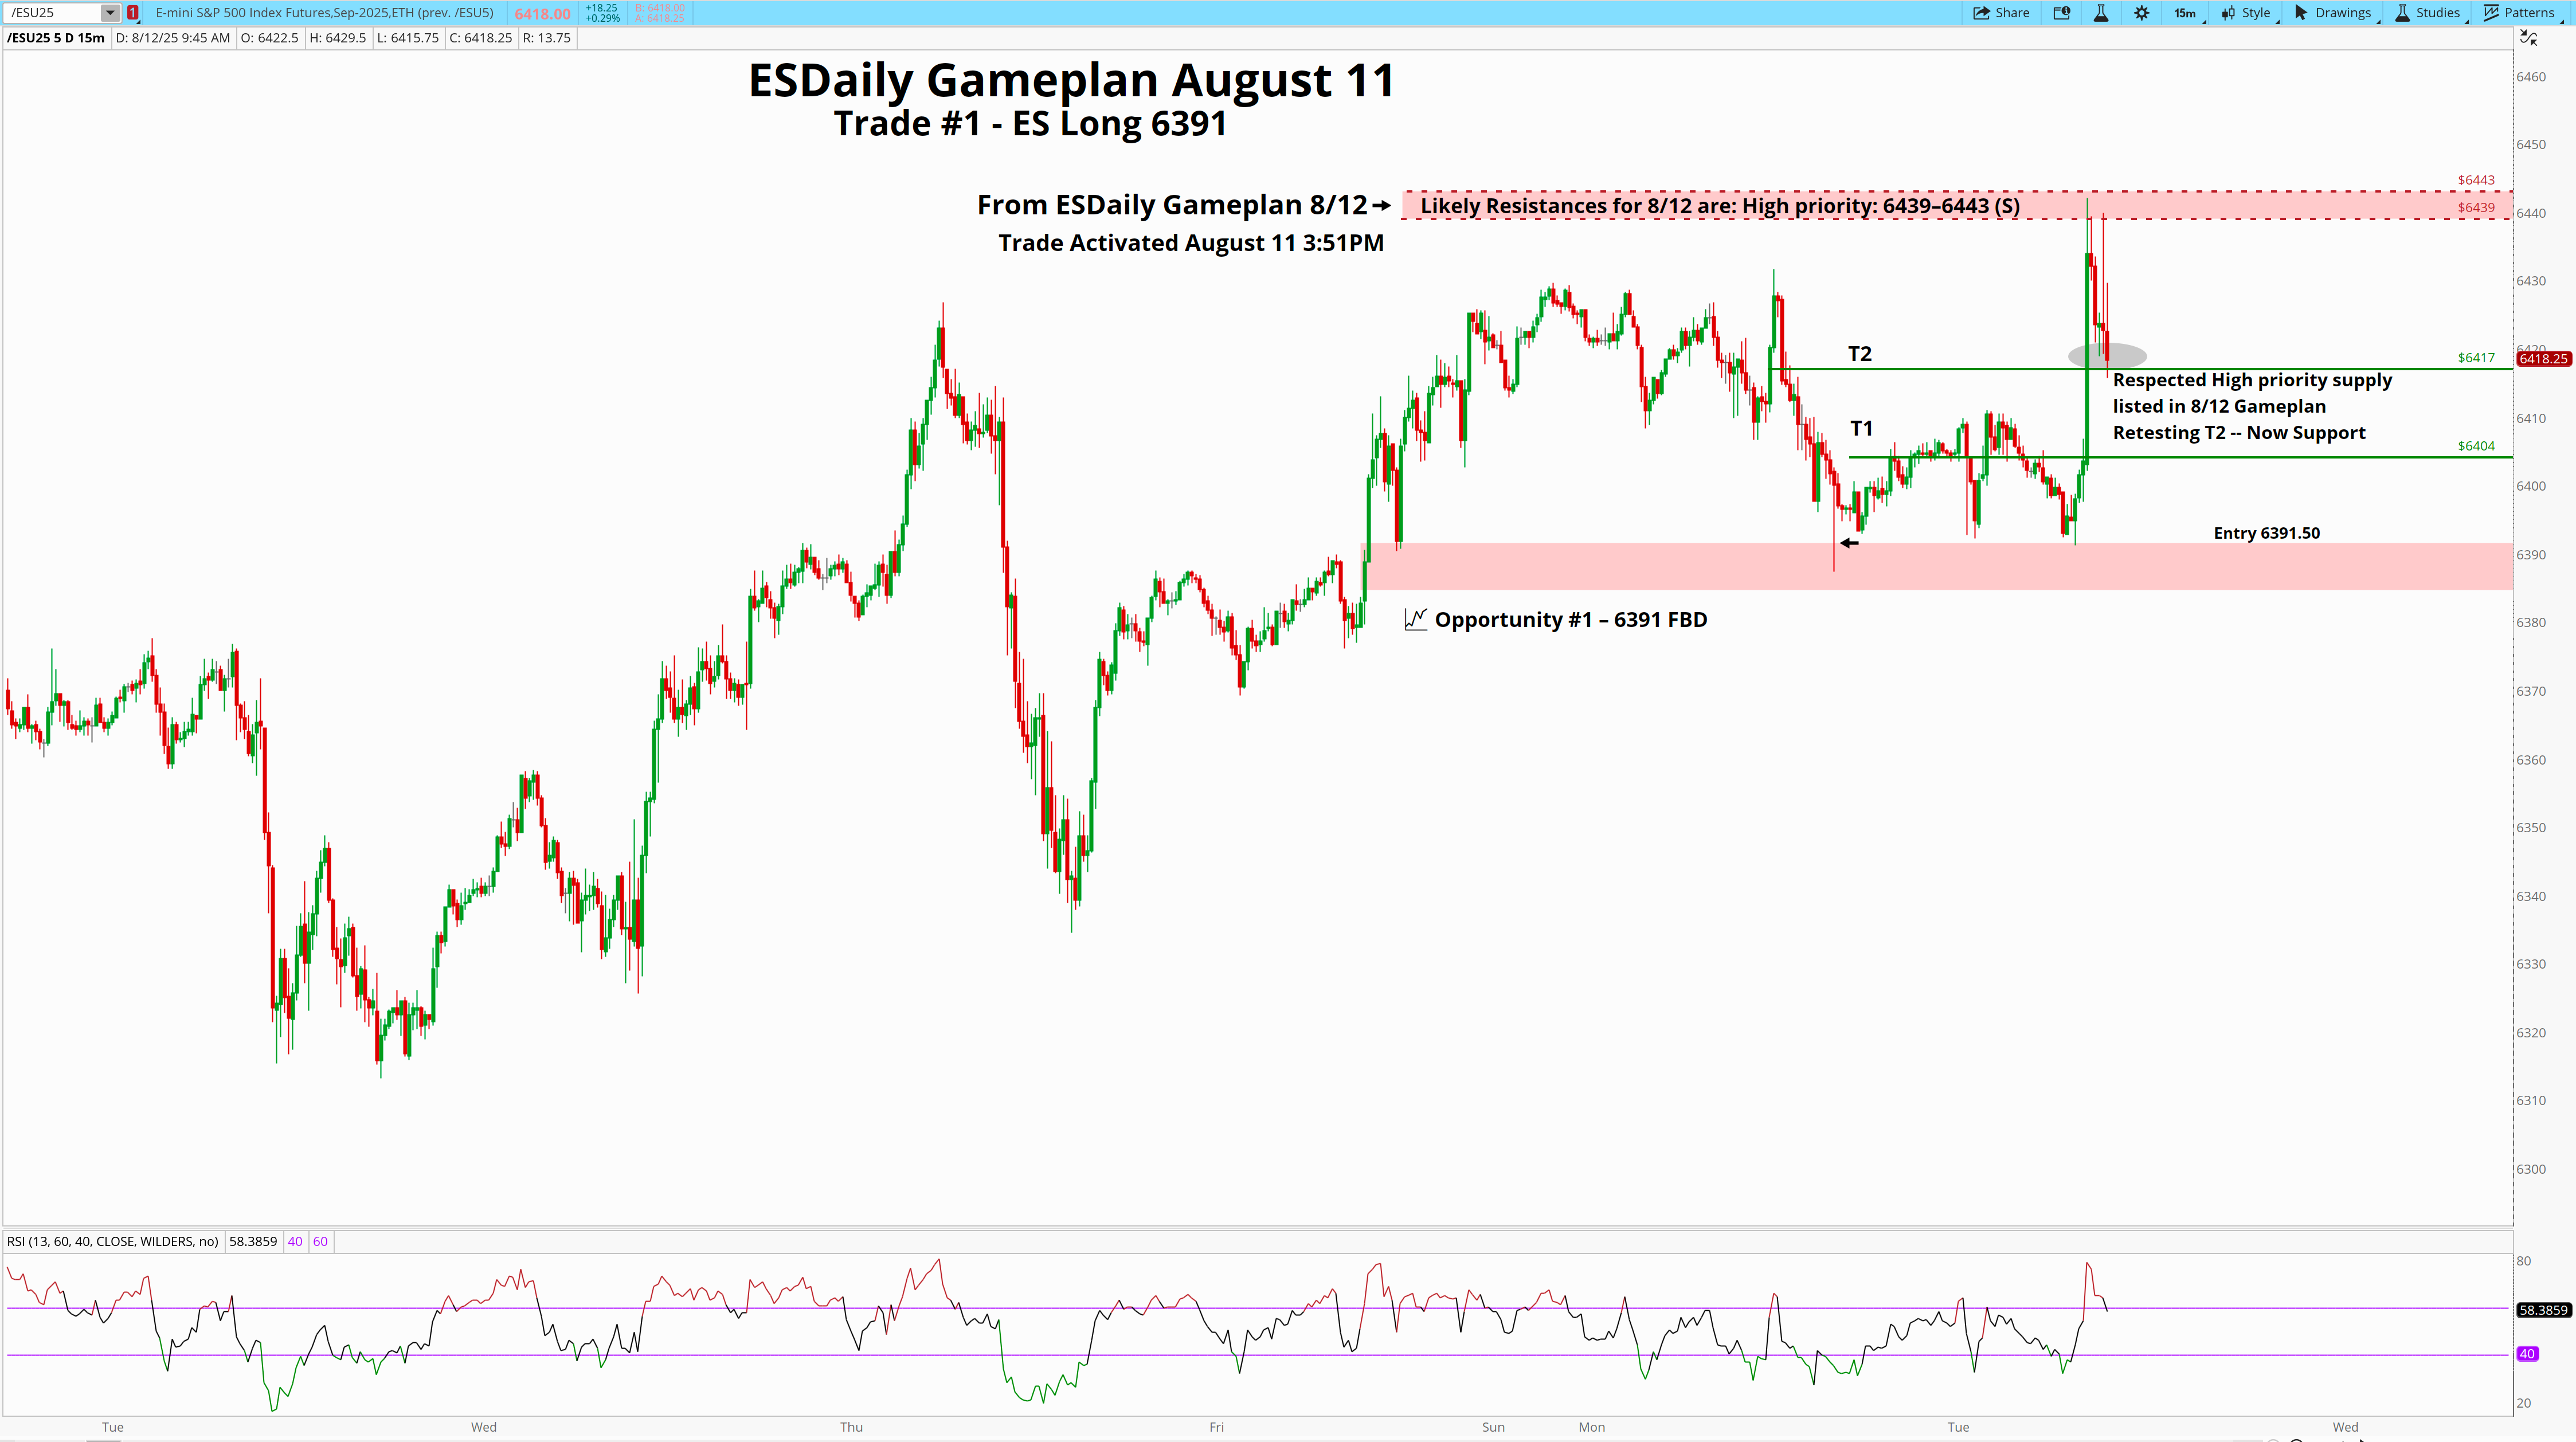
“Respected High priority supply listed in 8/12 Gameplan
Retesting T2 6417- Now Support”
11:11AM

11:59AM

12:47PM
1:56PM
As 3 High Priority Resistance levels were hit (and ultimately breached) within one trading session I decided to take a T3 at 6461.25. It’s an atypical move and my job as a trader is to profit and take it when it’s due.
Here' — 3 breached high priorities is a perfect reason to do so.
This is the lesson:
I said this in response to whether or not to short when 6439 was tested a third time
This is what typically happens:
“When we are in a trend like we are (45 min up since 8/1), supply areas are *expected* to work
BUT….
These are the pullbacks that precede the continuation in very strong bull markets…. these pullbacks from supply respect 1st or 2nd level support.
Yesterday 6391 was a 2nd level support (our trade)
Today 6391 was a 1st level support (after our T1 was hit last night)
Now?
The respect at supply respected 6417 (our T2)
You can see the grey circles where this occurs
Hopefully this helps explain again, why I don’t mess with counter trend activity.
ES give the ultimate squeezes.
My entire job throughout this process was simple. Do nothing.
That worked well.
Coming into today, the story hasn’t changed — it’s evolved.
Price action over the past two sessions has built a higher block above 6418–6421, with Globex extending the move overnight into the mid-6470s.
That puts us in rarefied air.
1 of 3 things is going to happen:
A breakout leg
Short-term exhaustion and some liquidation
Choppy messy price action
I’ll discuss what I’m looking for in these scenarios:
4 Hour
Structure is now stair-stepping higher from our entry. The FBD base at 6380–6391.
The last two sessions have built a clean mid-range shelf at 6432–6422, which now serves as our first meaningful downside reference.
RSI is pressing higher but not yet in exhaustion territory, leaving room for a continuation if 6421 continues to hold. We are showing no signs of slowing, and there’s no meaningful supply overhead.
45 Min
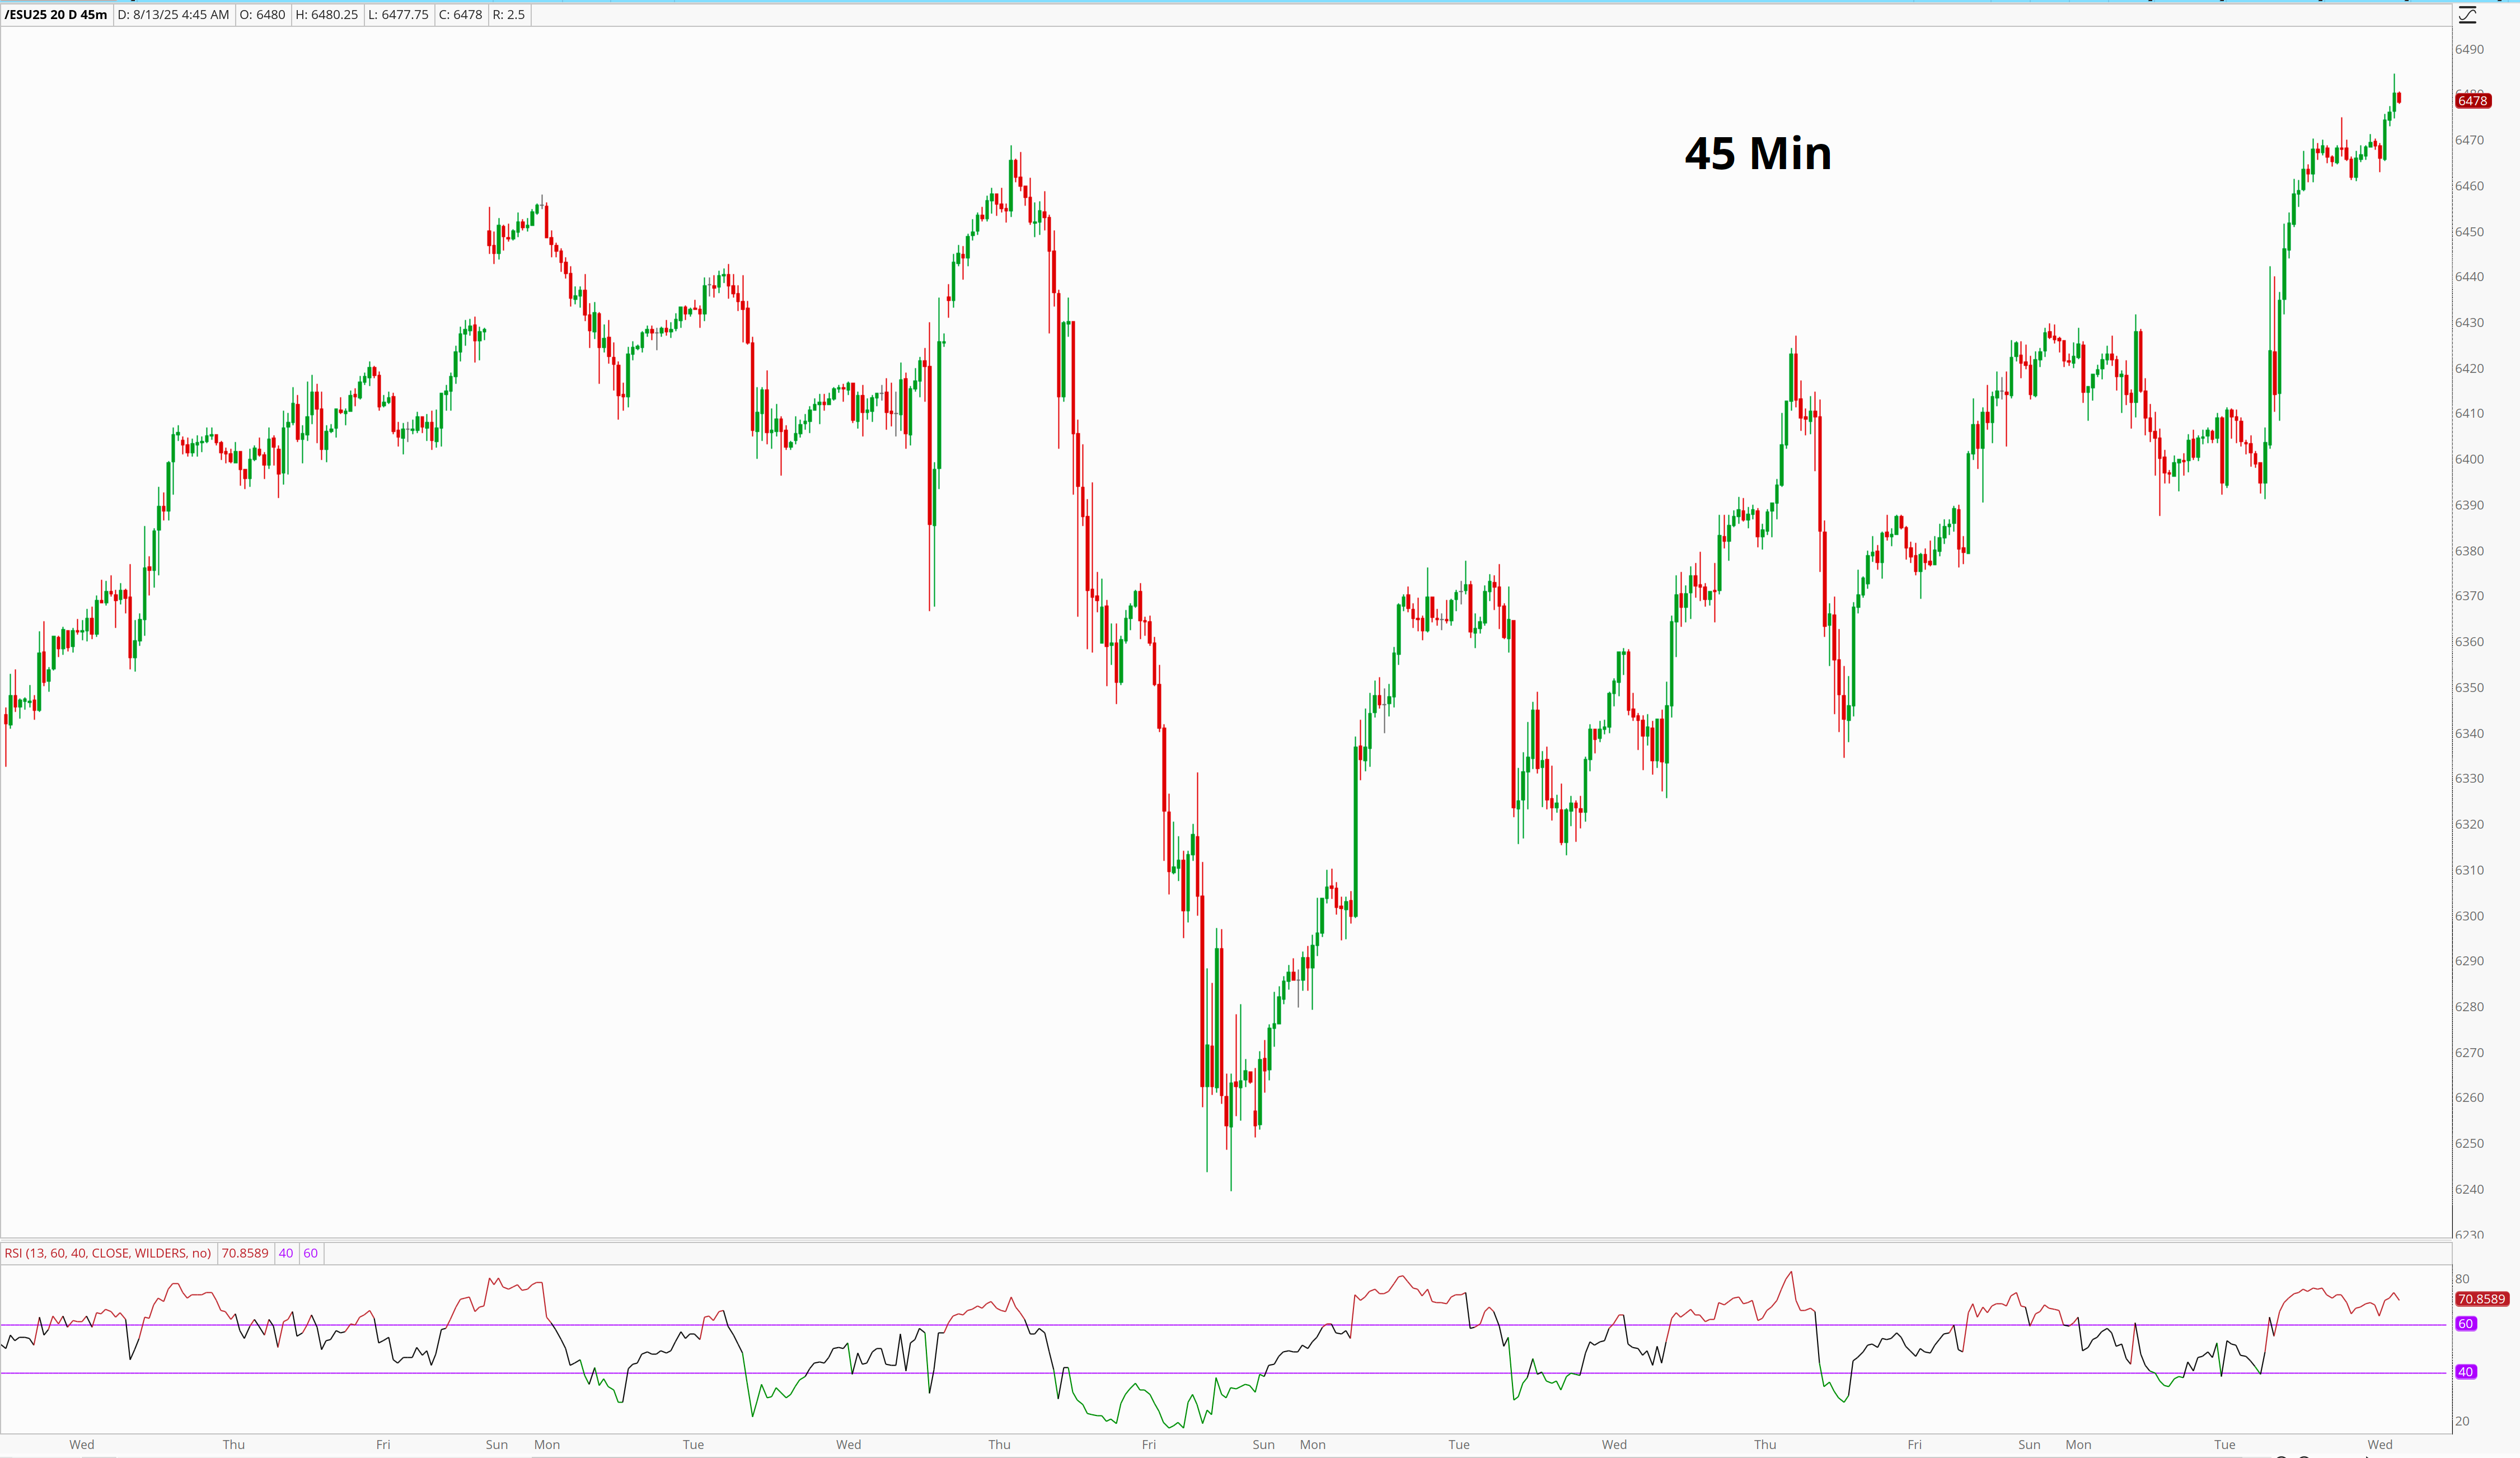
Yesterday’s vertical move out of the 6417 base leaves limited fresh structure. It makes it difficult to locate high reward:risk opportunity areas.
It’s often the most difficult time to be a trader — after a vertical move.
This is important:
If the bid remains aggressive, thin pockets can be traversed quickly.
Failure to hold above 6421 would expose a quick give-back into 6409, then back to 6391.
15 Min
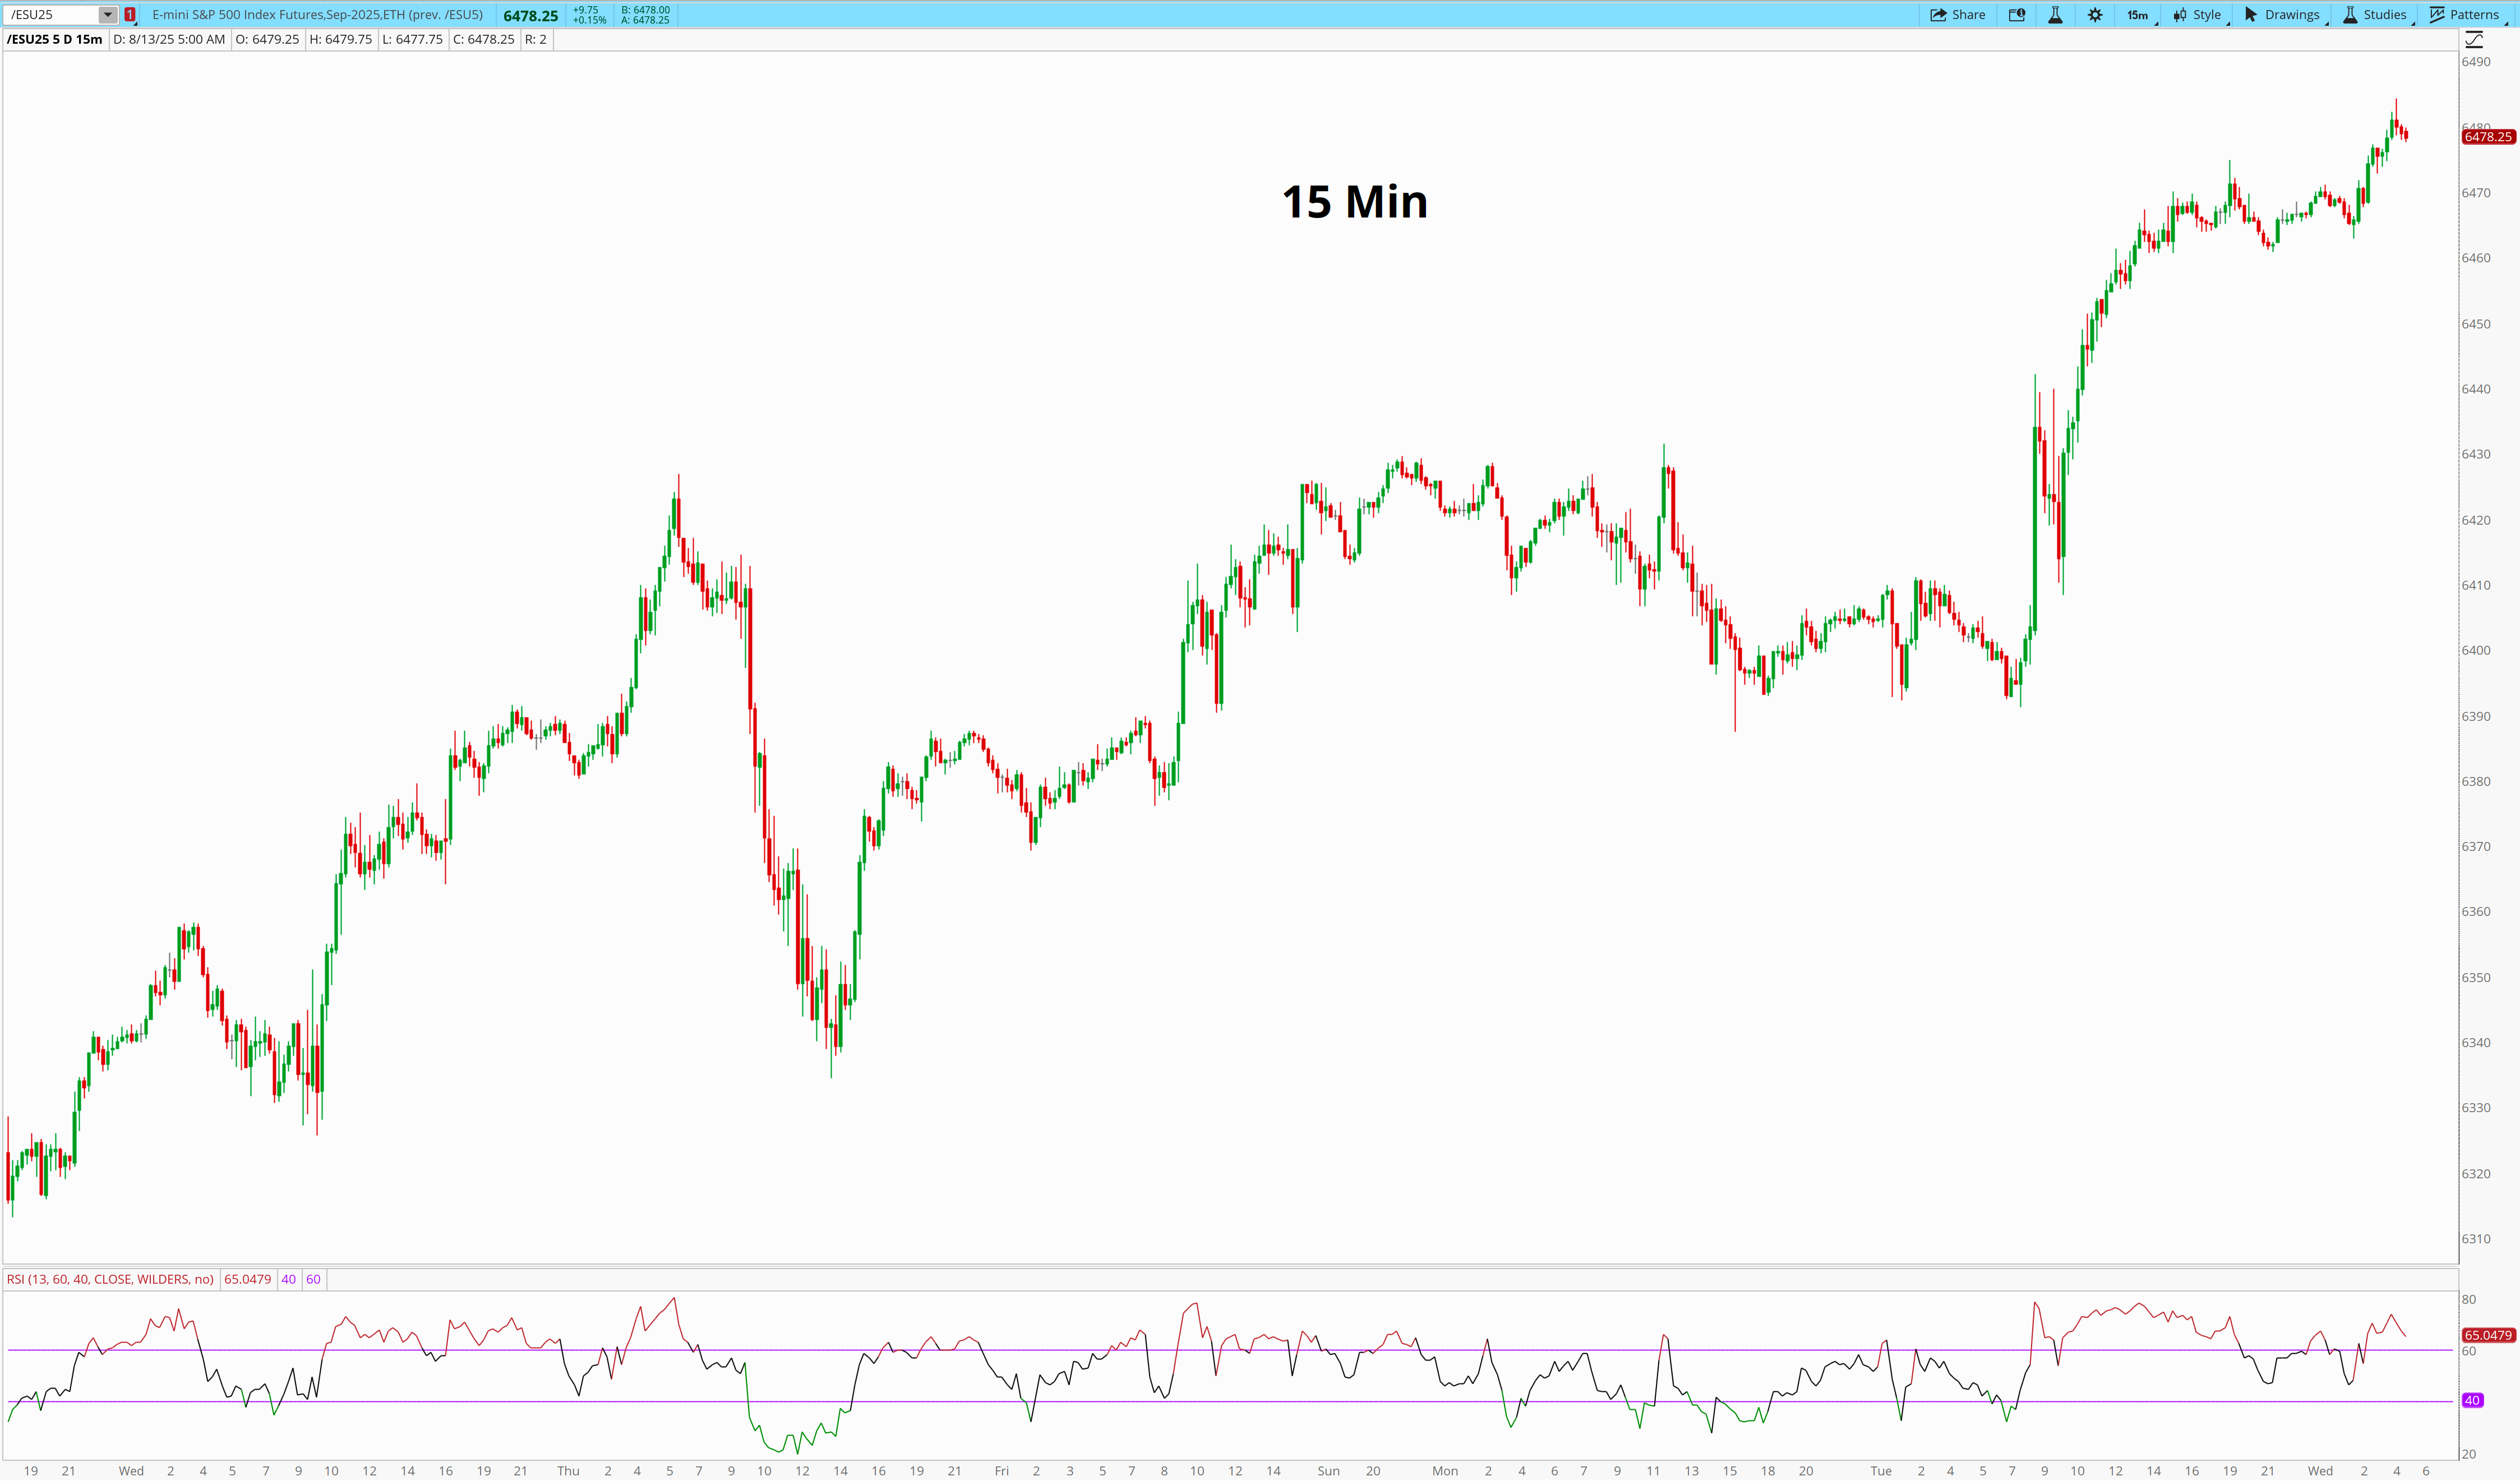
Overnight built acceptance above my T3 of 6461.25 probing slightly higher. Price is currently 6479.
For intraday, that range acts as the early balance area. Buyers will want to defend above 6461 on any morning pullback to keep momentum intact.
Due to the nature of structure outlined above I have limited opportunities that I’m interested in.
Anything other than these is chase and desire for action, not precision.
It’s at times like these we need to adhere to our rules and not get caught up chasing.
Here’s what I’m looking at with ES printing 6481 Wednesday morning
Likely Supports for 8/13 are:
High priority: 6390 (CRA), 6370 (CRA), 6348-6343 (D), 6290–6280 (D)
Medium priority: 6398, 6392, 6376, 6362, 6356–6353 (D), 6334(CA), 6327, 6321, 6315, 6298, 6265 (CA), 6248, 6240 (CA)
Likely Resistances for 8/13 are:
High priority: 6502 (CRA), 6517, 6534
Medium priority: 6488, 6508, 6522–6525 (S), 6539 (CA), 6544, 6549–6552 (S CRA)
Opportunities for August 13
📈 Opportunity #1 – 6435-6428 LTB CRA Re-test Long
The area I’m interested in today if we see selling pressure is 6435–6428. This band includes the Tuesday RTH breakout level at 6421, which has now been tested multiple times as both resistance and support, and lines up with a CRA pivot from August 8–12. A pullback into this range, with price finding a low in the range would put me back in line with the prevailing trend. A failure of this that isn’t supported by 6421 would put the structure at risk. Approach matters — I don’t want a slow bleed into the zone. I want to see a quick hit, responsive buyers, and a clear reversal sequence. RSI on 45 min less than 40 would be problematic
Notable Areas:
6461-6454 - First Level support - Tested multiple times - High on curve - First area bulls need to defend before structure rebuild occurs. Interest level here is low for me.
6443 -6439 - 2nd Level support - The high post 8:30AM - worked as resistance multiple times, broke through and worked as a backtest before 50 point surge
6407 - The last line of defense for this structure. If we lose that with acceptance, the tone changes fast and we open the door for a deeper rotation. This may be an opportunity but it’s ~75 points away from current price. The approach, volatility, and price behavior at time will be noted in the chat if hit. Regardless, I won’t catch a knife.
6391 - Origin of move - Our entry point - Structure unravels on a failure here
The plan today is simple.
The same as it was Monday and Tuesday.
Let the runner run, manage it at the shelves, and don’t take trades where they don’t exist.
The market is rewarding patience right now.
Stay at the edges, keep the middle off-limits, and let price make the first move.
See you in the chat when the levels hit.
Thursday August 14, 2025
Some days are all about action.
Others are about doing nothing at all.
Yesterday was the second kind. I didn’t take a trade. Not because there was no movement — ES lifted to 6502.50 in the first 15 minutes and then spent the rest of the morning bleeding lower — but because none of it set up in a way that aligned with my process.
I’ve said this before in the onboarding series, and it bears repeating:
I don’t comment on every move in price. The objective is to eliminate noise, not create more. Most traders fail because they trade too much, and they trade too much because they try to dissect every 10-point jiggle. My job here isn’t to make you stare at the screen harder — it’s to help you focus on the moments that actually matter.
Most traders fail because they trade too much.
They think every 10-point flicker needs a label, an entry, an exit.
That’s not how you survive here.
My job is to strip out the noise — if there’s nothing clean, I’m not going to manufacture something just to be “active.” The right trade is no trade when the structure doesn’t earn your risk.
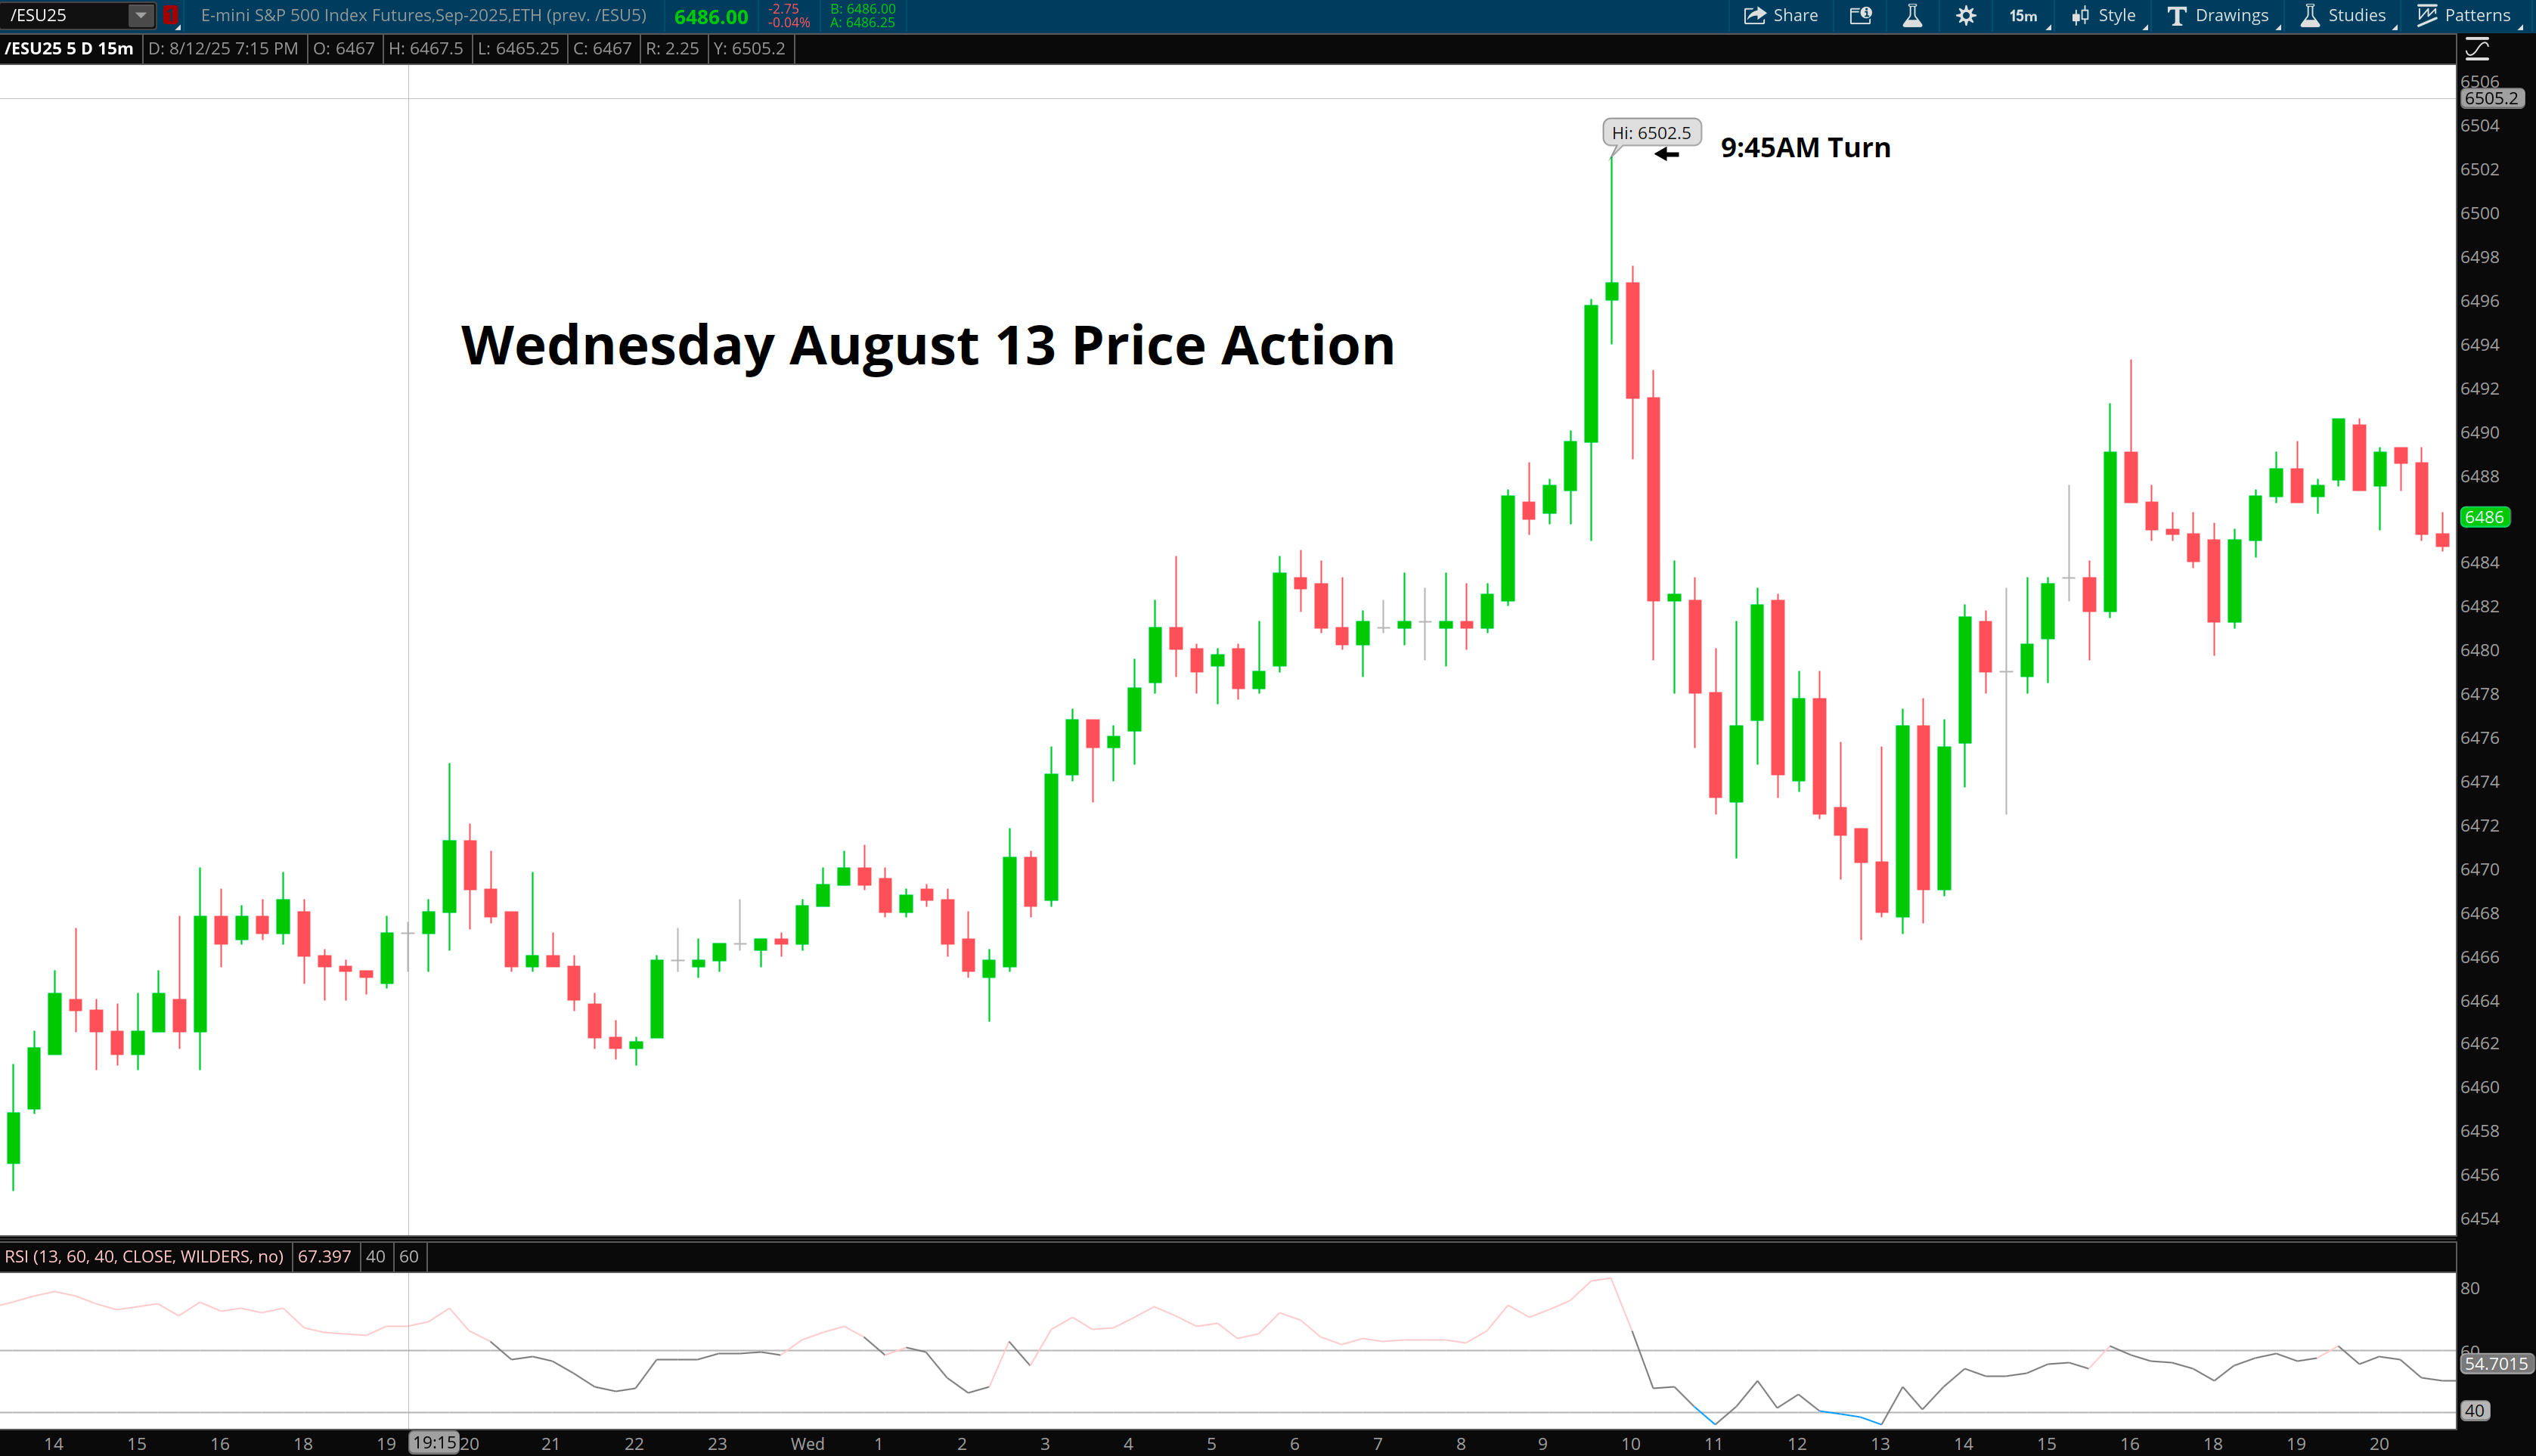
One of the easiest traps in trading is mistaking the first move for the real move. Yesterday was a clean reminder that early strength can be nothing more than a set-up for the day’s actual auction.
RTH opened with a quick push into 6502.50 by 9:45 AM — the high of the day was printed in the first 15 minutes.
From there, sellers went to work.
The morning was a steady slide, breaking through each minor shelf until the low of the day printed at 6466.75 just after 1:00 PM. The rebound that followed was corrective — no urgency, little volatility — and 6502.50 was never threatened again.
We closed still boxed inside the broader range.
There was no shift in control, no high-probability trigger — so we stayed flat.
When you skip a low-quality day, you don’t lose ground. You’re stacking the odds for when structure, context, and execution align. That’s when you press. Until then, we sit on our hands and let the market do the heavy lifting.
The bigger picture hasn’t moved much.
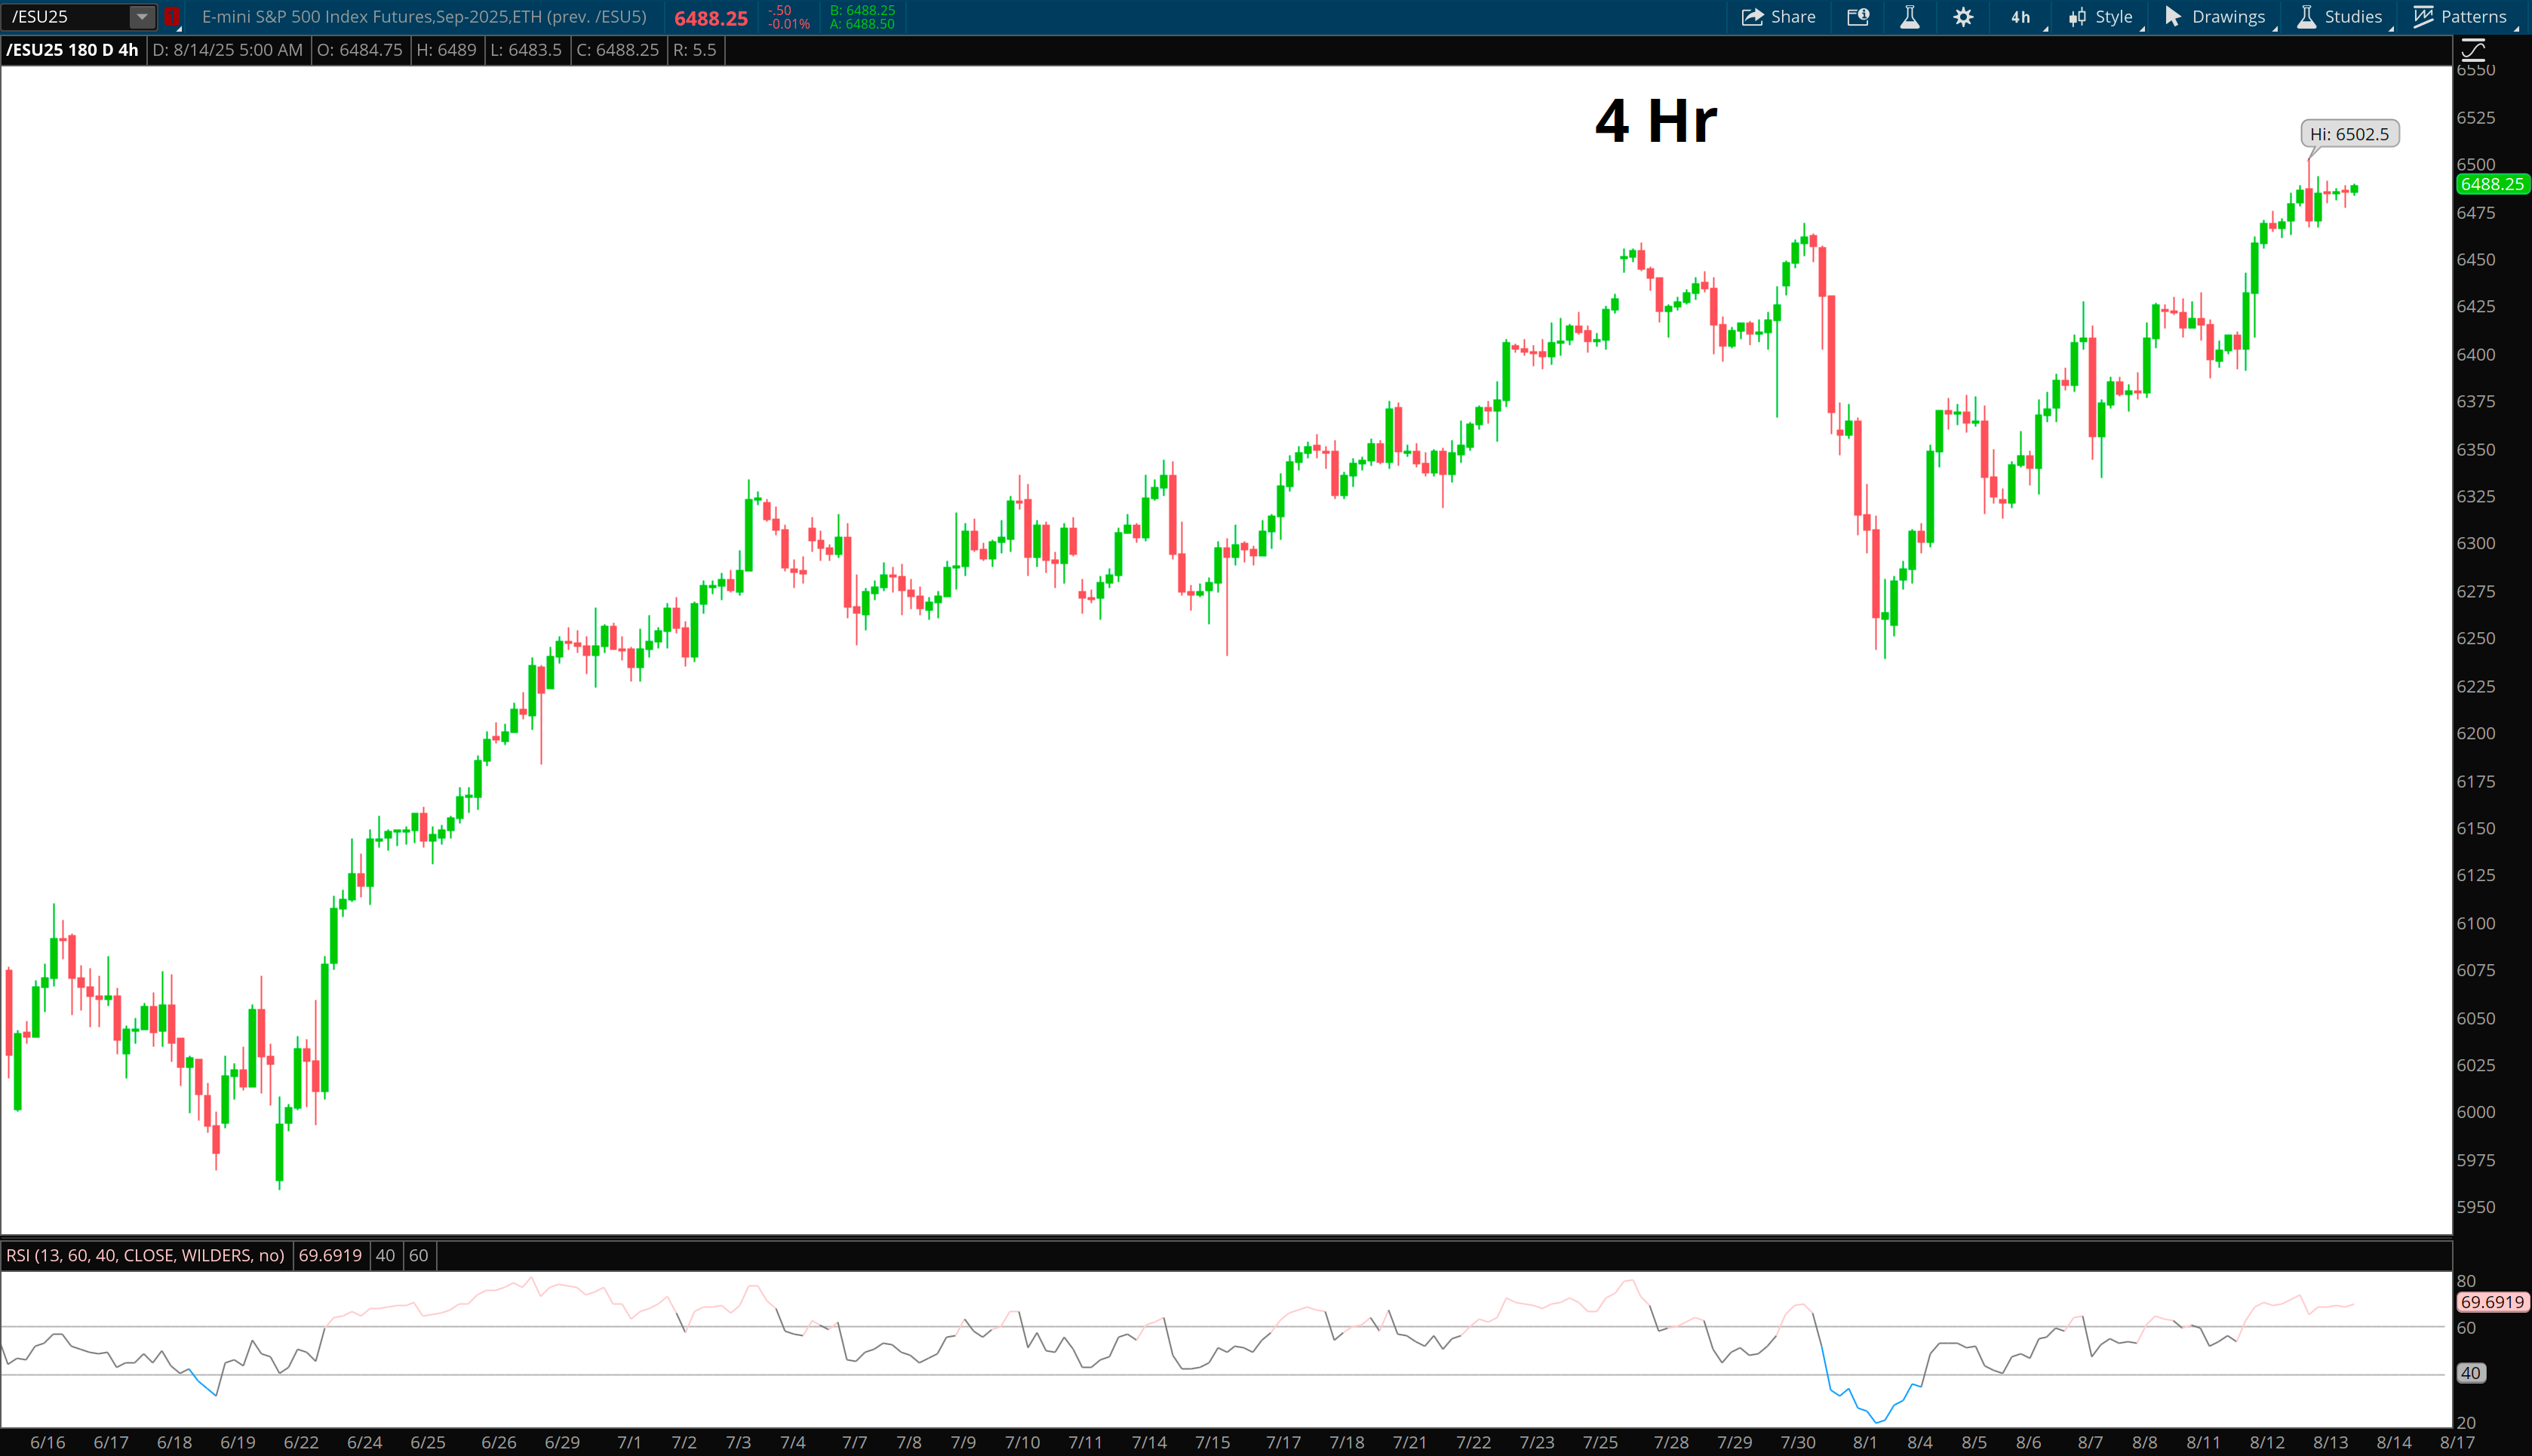
On the 4H, the August uptrend is still intact — every higher low from early August is holding — but the character has shifted.
The last three sessions have been inside bars, tightening inside a 35-point box.
The big picture says trend is still up, but momentum has stalled; the market is pausing to decide if this is a staging area for the next leg higher, or distribution before a deeper pullback.
The 6391 CRA from August 11 remains a key anchor below, and the longer we hold above it, the more it reinforces that buyers still own the higher-timeframe trend.
Momentum is steady but no longer accelerating, which often signals we’re either building pressure for another expansion leg or setting up a deeper pullback to reload.
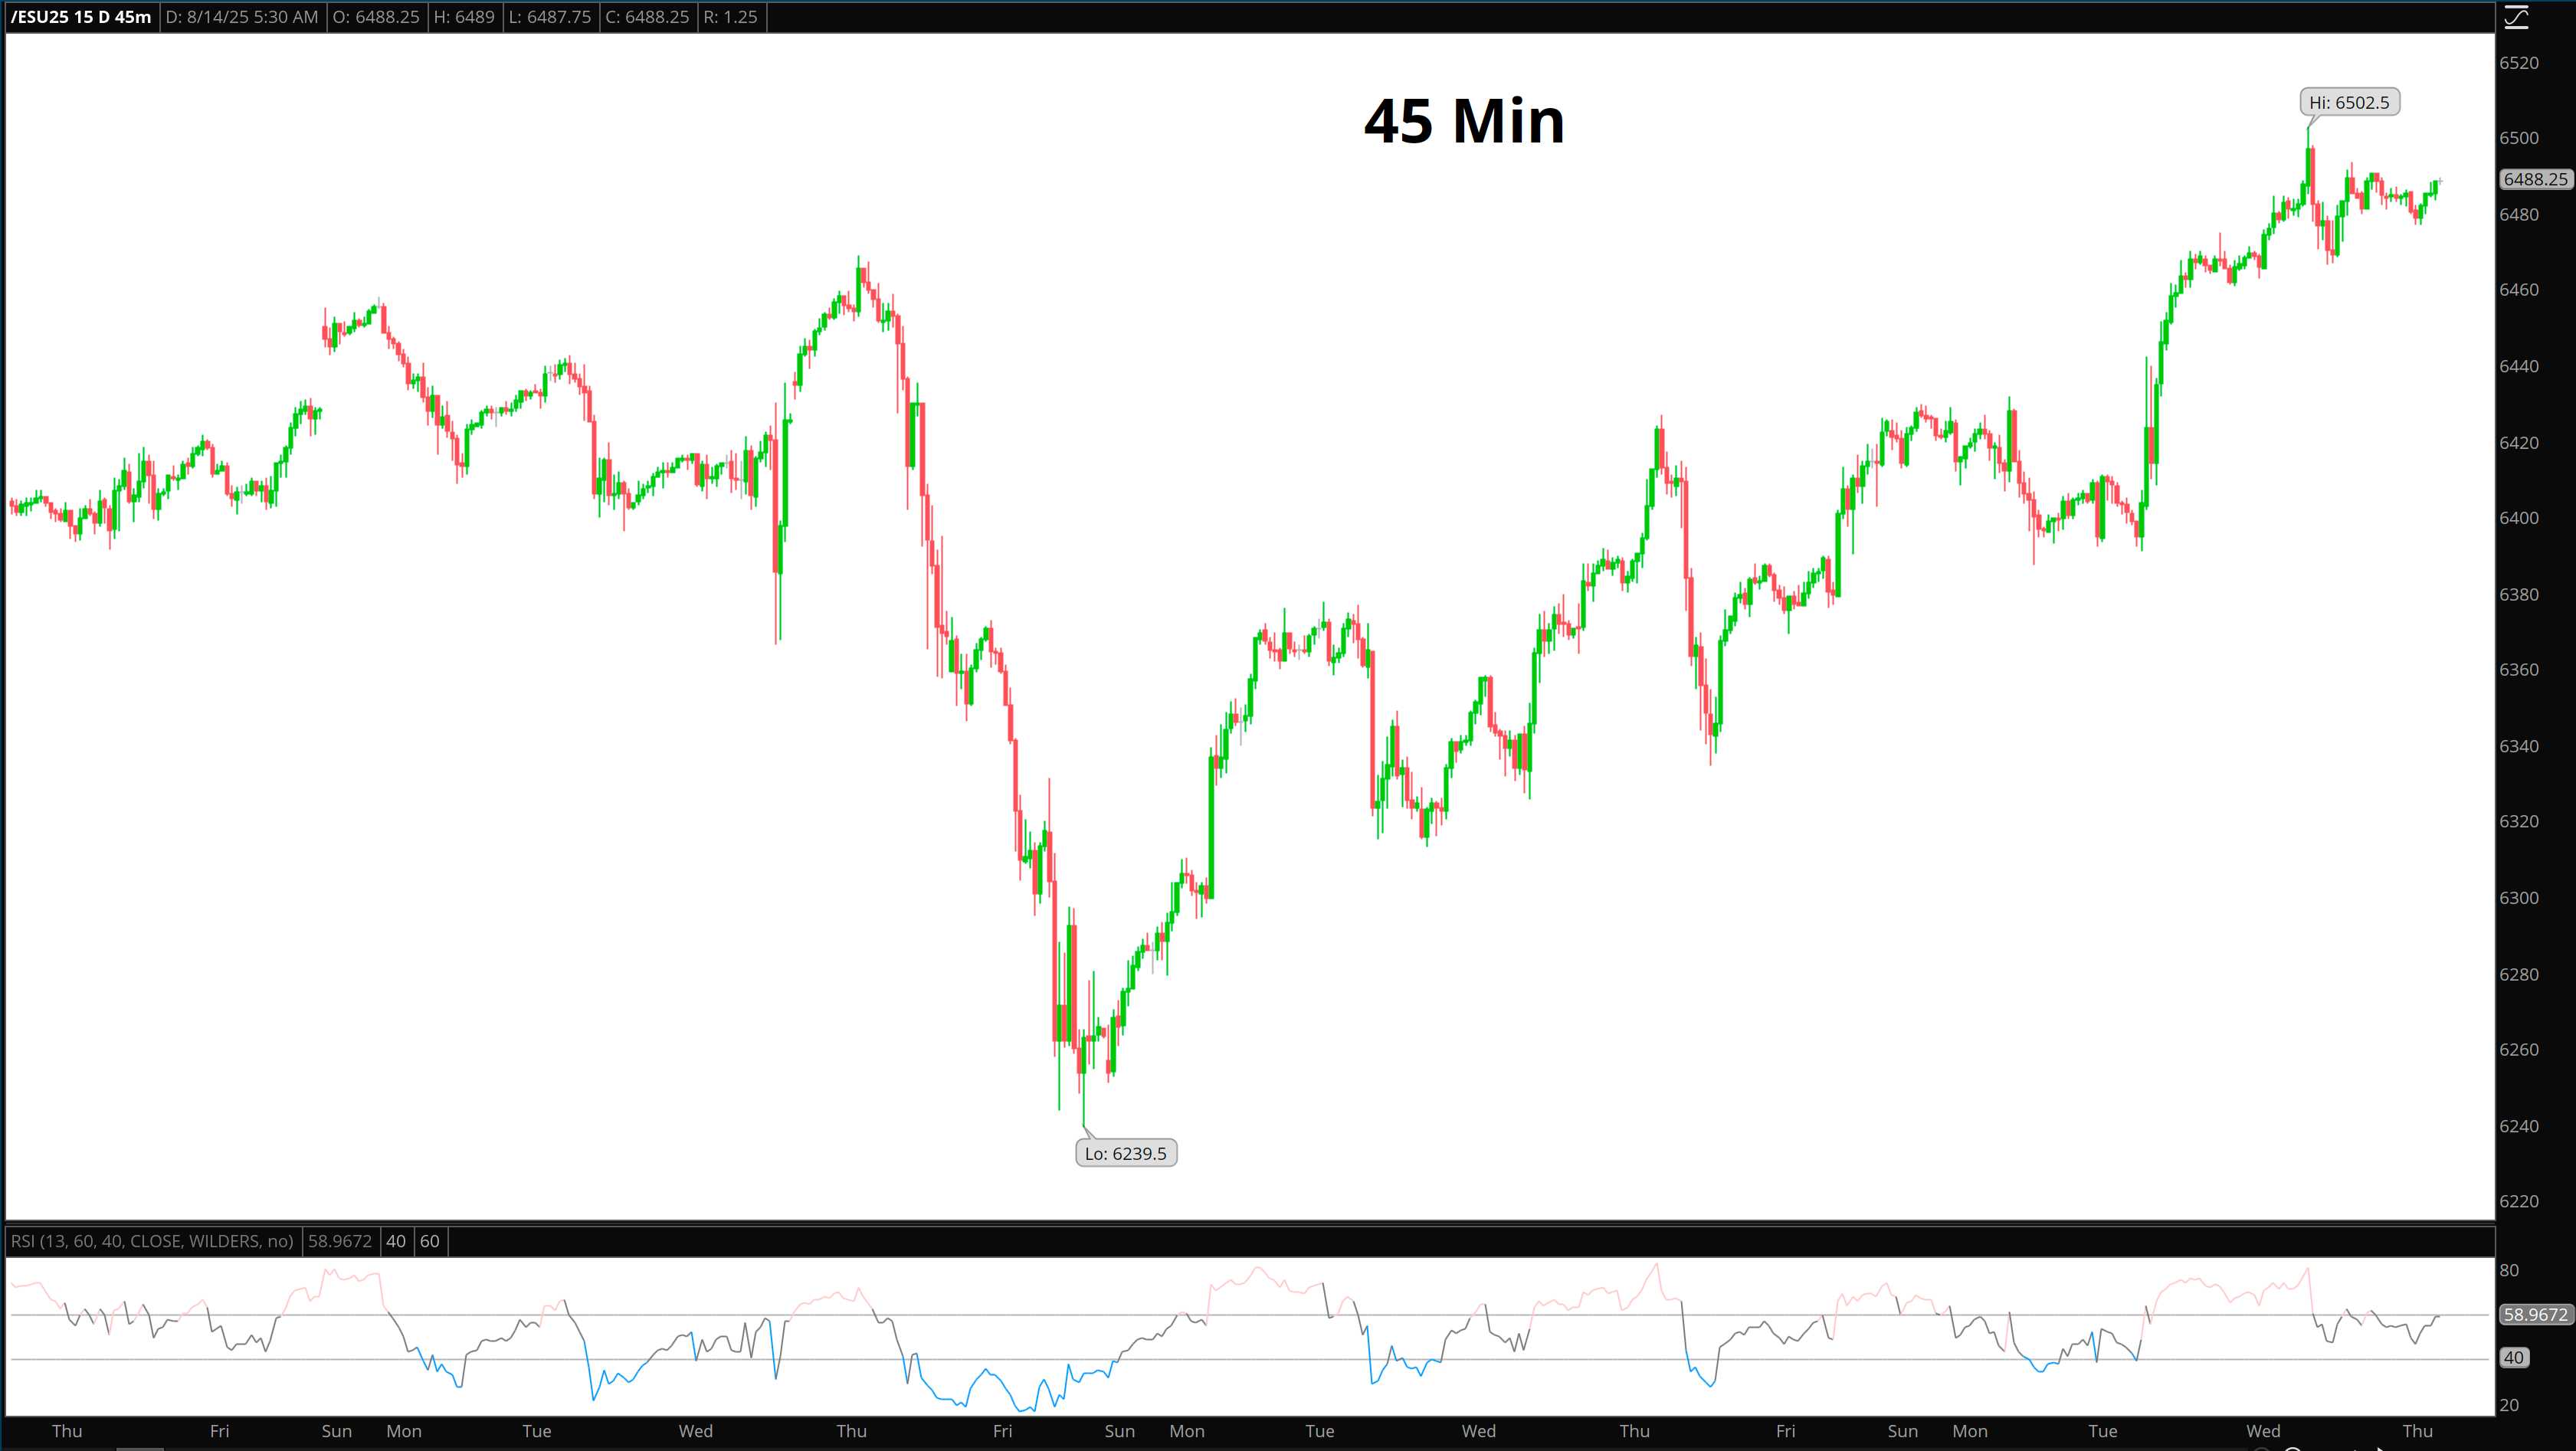
On the 45m, the August rally still has the same stair-step structure we’ve seen since the Aug 1 low at 6239.50 — each leg pushing to fresh highs, then consolidating before the next advance.
Wednesday carried that trend early, printing 6502.50 at 9:45 AM to edge past Tuesday’s high. But the breakout failed quickly — sellers leaned hard into that high, driving a steady morning selloff into 6466.75 by 1 PM.
That low sits directly on a shelf that’s been forming since last week matching July 31 highs, and the reaction off it was controlled. The inability to push back to the morning high tells us buyers aren’t gassed, but they’re also not chasing — a change from earlier in the rally where momentum follow-through came easily.
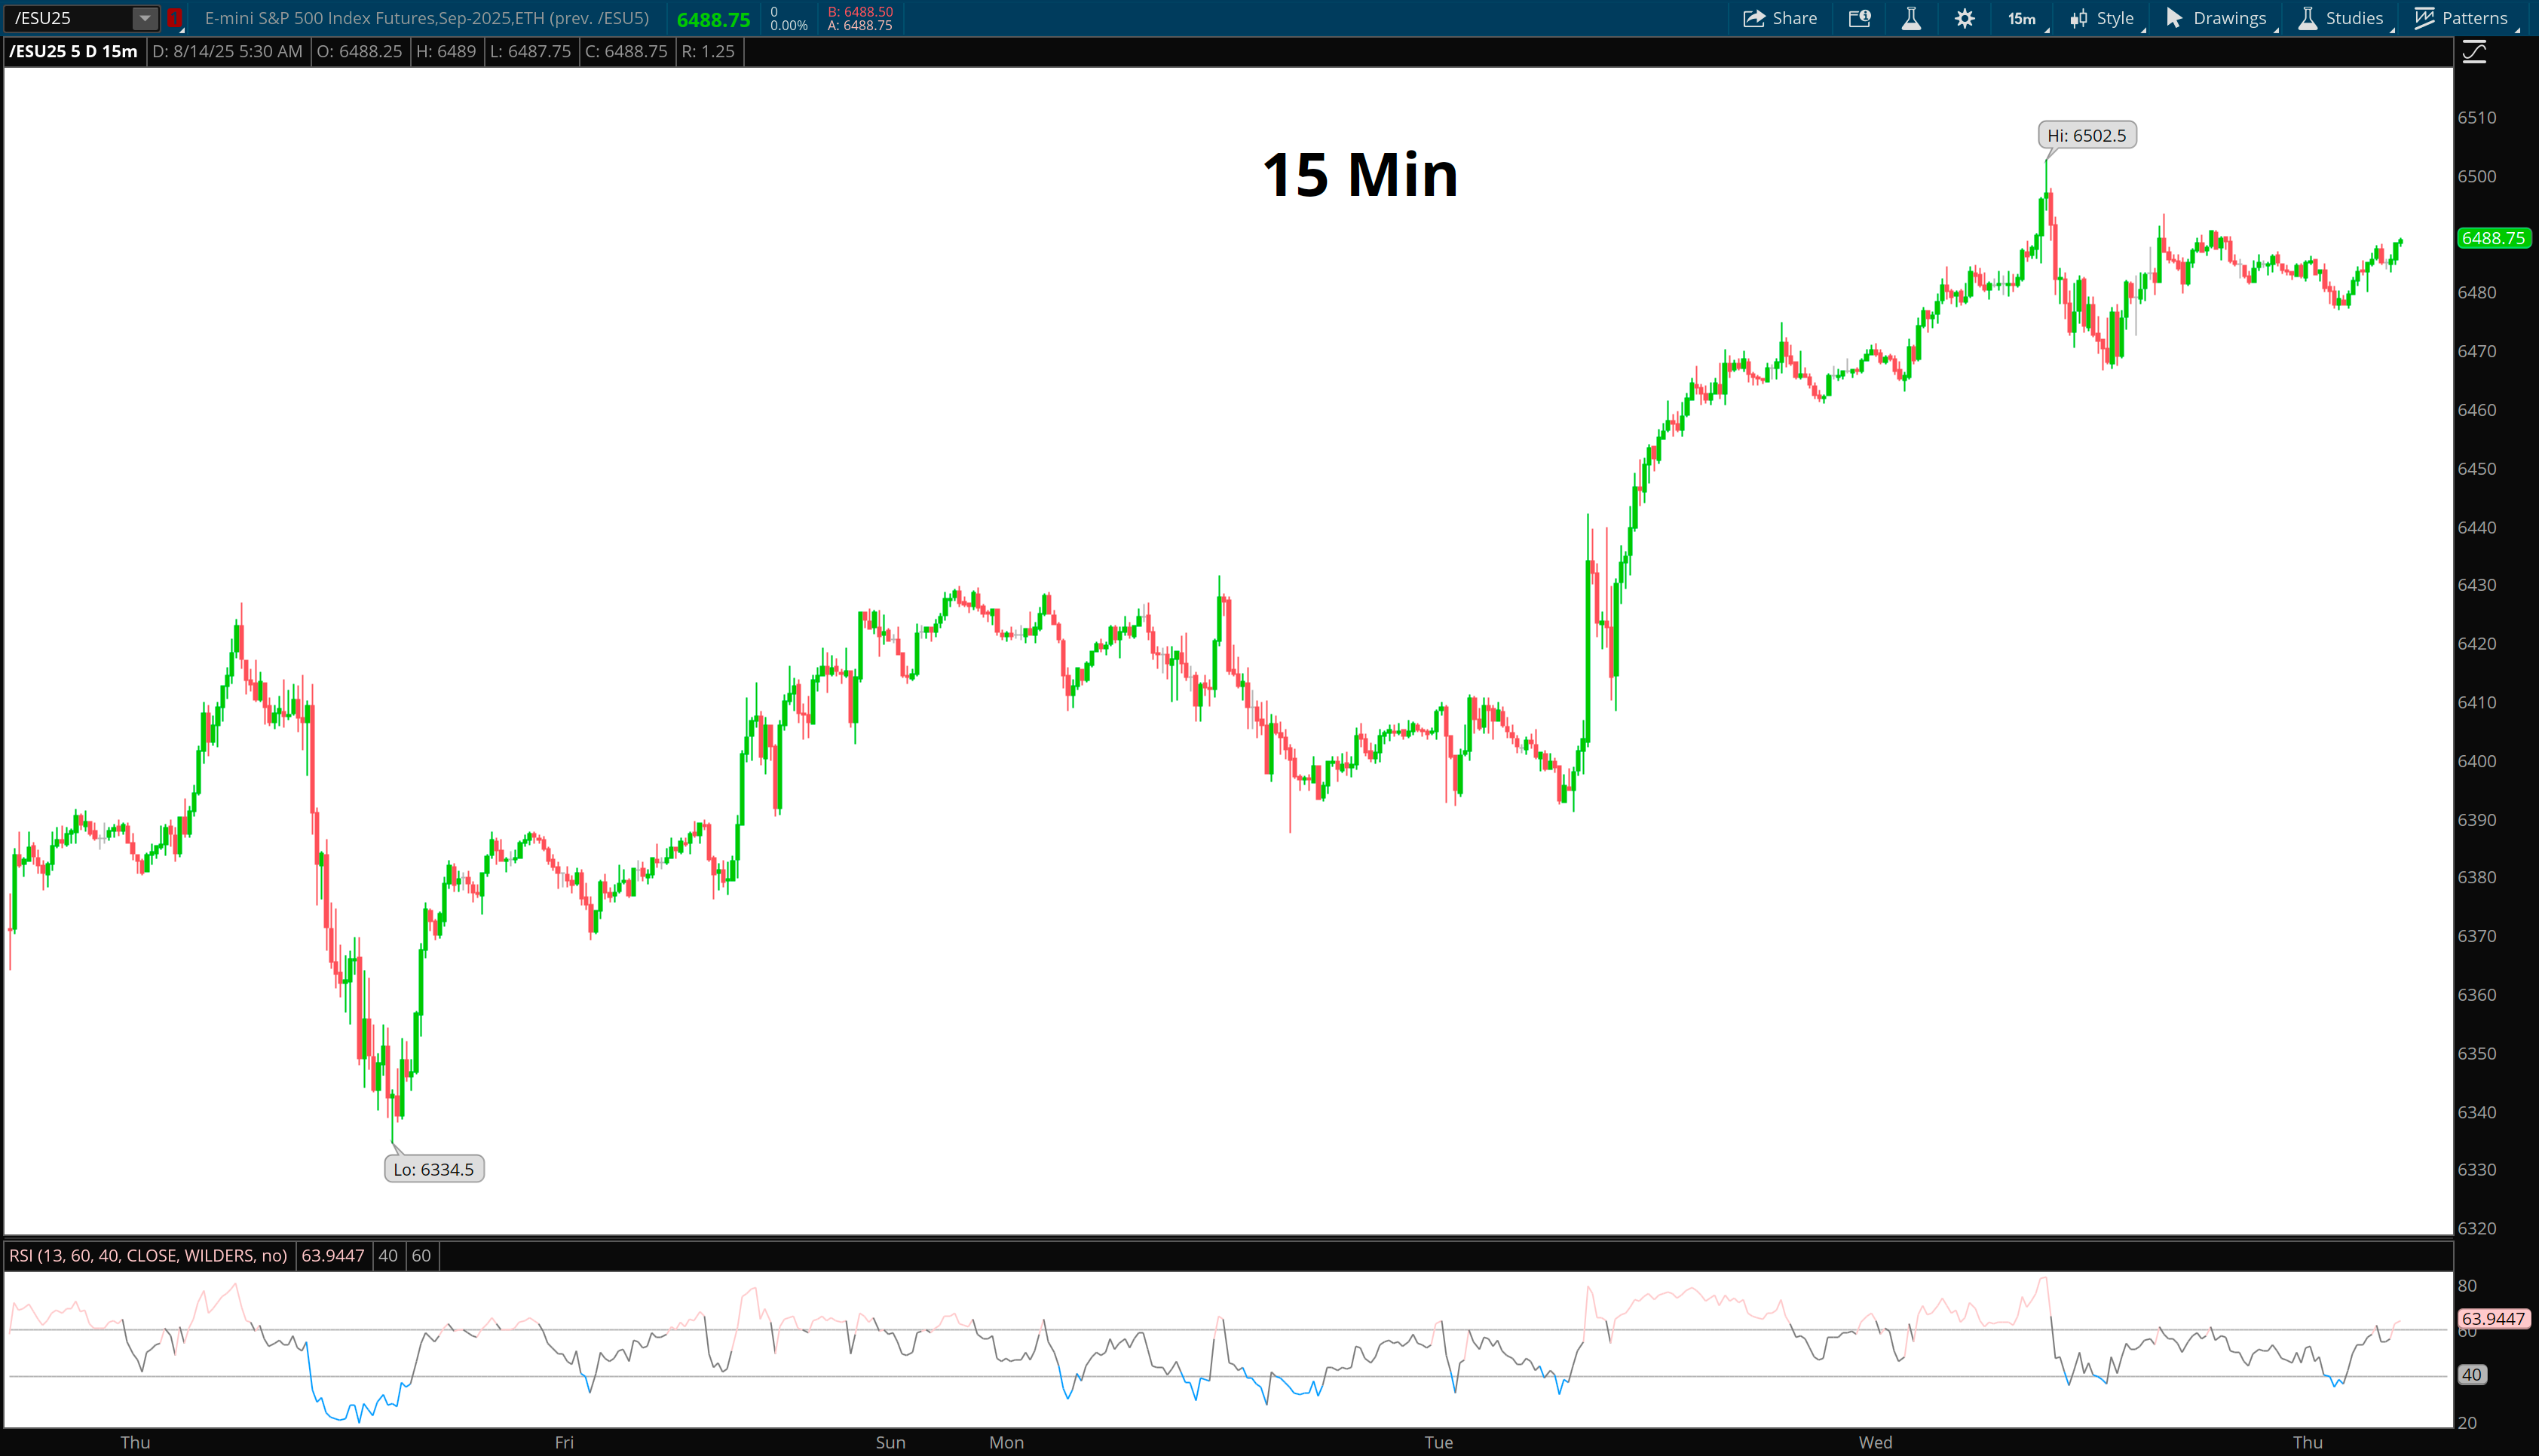
On the 15m, the battle lines are obvious. Yesterday’s high at 6502.50 came in early (9:45 AM) and sellers hit it hard, driving a steady morning fade. That push lost steam into the 6466.75 low, where buyers stepped back in, but they couldn’t produce a squeeze — just a choppy rebound into the mid-range. RSI held neutral; no strong divergence means neither side is exhausted yet. This is coiling action. When it breaks, it won’t be subtle.
We’re not currently pressing into a major higher-timeframe critical area — both edges of the 6466–6502 box are mid-range in the bigger August structure. The real HTF test above sits closer to 6518–6520, and below, the 6439–6443 and 6391 CRA remain the bigger magnets if sellers get traction.
Without a catalyst, the tape is likely to keep leaning on these same boundaries until they crack.
My job as a trader is to find areas of opportunity where the reward:risk ratio is at it's highest.
This lays in the edges of structure as we look for our core setups.
Currently, ES needs a catalyst - Where high on the curve - stuck between two competing levels and there’s little support below
With that in mind:
Here’s what I’m looking at with ES printing 6489 Thursday morning
We’re still holding the 6391.50 long from August 11, stop moved up to 6405. The structure supports the position, and until price forces my hand, it stays.
Likely Supports for 8/14 are:
High priority: 6466.75 (LTB), 6458–6452 (D), 6438 (CRA)
Medium priority: 6480, 6474, 6460, 6448–6446 (D), 6429 (CA), 6424, 6419, 6412, 6404, 6391 (CRA)
Likely Resistances for 8/14 are:
High priority: 6489 (CRA), 6502.50 (CRA), 6517, 6534
Medium priority: 6496, 6508, 6522–6525 (S), 6539 (CA), 6544, 6549–6552 (S CRA)
📈 Opportunity #1 – 6435-6428 LTB CRA Re-test Long
The area I’m interested in today if we see selling pressure is 6435–6428. This band includes the Tuesday RTH breakout level at 6421, which has now been tested multiple times as both resistance and support, and lines up with a CRA pivot from August 8–12. A pullback into this range, with price finding a low in the range would put me back in line with the prevailing trend. A failure of this that isn’t supported by 6421 would put the structure at risk. Approach matters — I don’t want a slow bleed into the zone. I want to see a quick hit, responsive buyers, and a clear reversal sequence. RSI on 45 min less than 40 would be problematic
The high priority support lines are where bulls will look to defend.
For me to add to my position, I want to see ES seek liquidity.
That’s what I focus on - because that’s what works
Cheers,
PriceTrader
Friday August 15, 2025
Patience in the Box – ESDaily Gameplan
Some weeks the market gives you all the information you need in two candles — then spends the next four days daring you to overcomplicate it.
That’s where we are now. Since Monday’s extension to 6502.50, ES has done everything possible to keep us boxed in, offering just enough movement to lure in impatient traders while withholding any real shift in structure.
This is exactly the type of environment where discipline matters most — where doing less often produces more.
Yesterday we opened with a lift to 6485 and hugged that level all morning.
At 8:30 AM, ES sold off — right into the 6460 zone I flagged August 13 as a pretty critical zone area.
That zone marked the 60-min low from July 31 and the Tuesday 12:15 PM high where the prior consolidation started. It had held as overnight support and remained untested since Wednesday.
Price flushed the level.
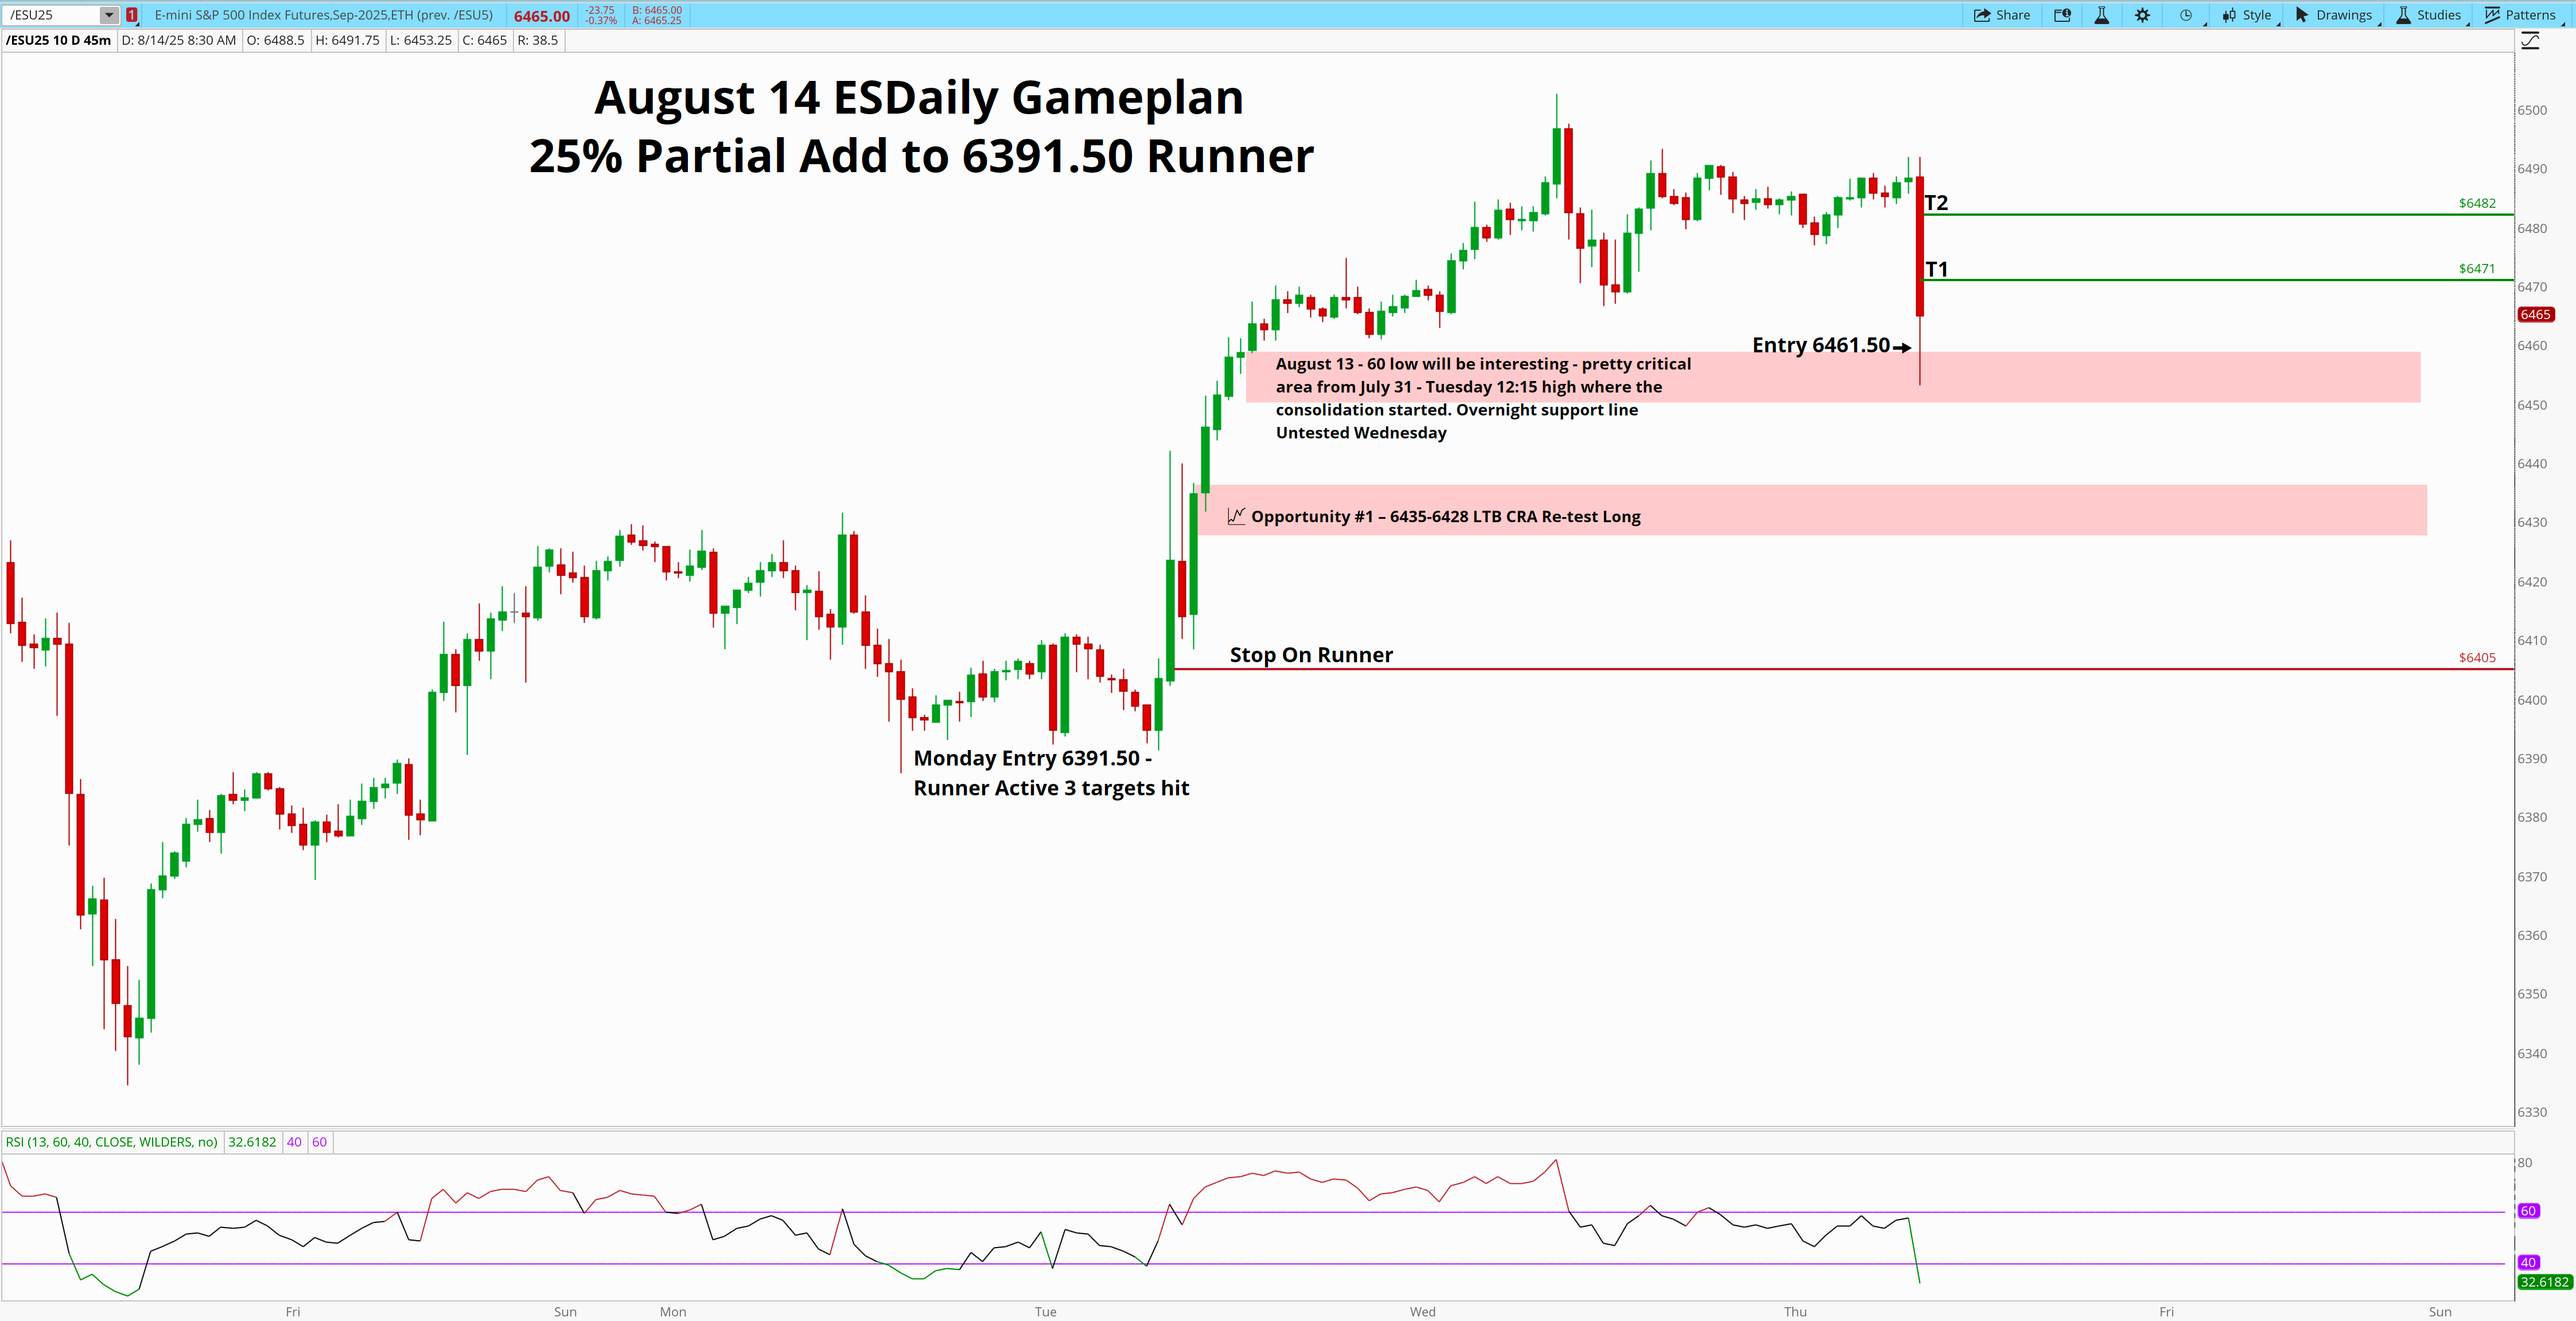
Price needed to hold the low of 53 a reclaim would be a potential add. I wrote about a FBD trade as they happened in the chat.
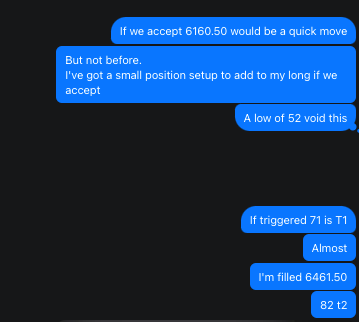
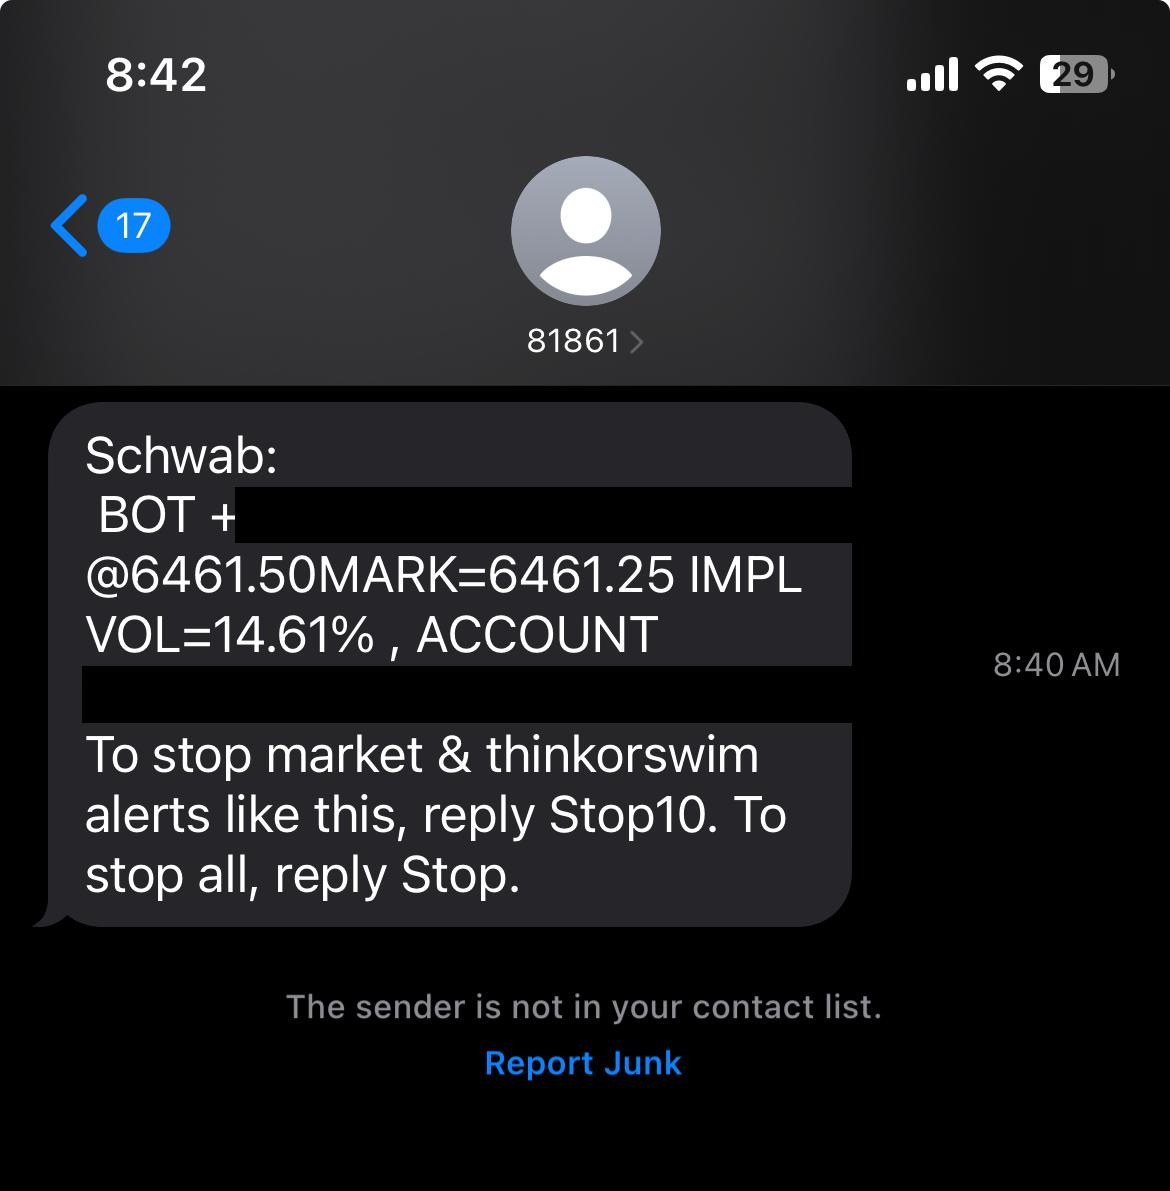
The selloff provided an ideal spot to the 6391.50 runner from August 11, triggering at 6461.50 and working immediately.
As re reclaimed I fired an entry off as a buy stop (enter if price moves above this level)
I was filled at 6461.50 at 7:40AM
T1 (6471) and T2 (6482) both hit before the market settled back into its range.
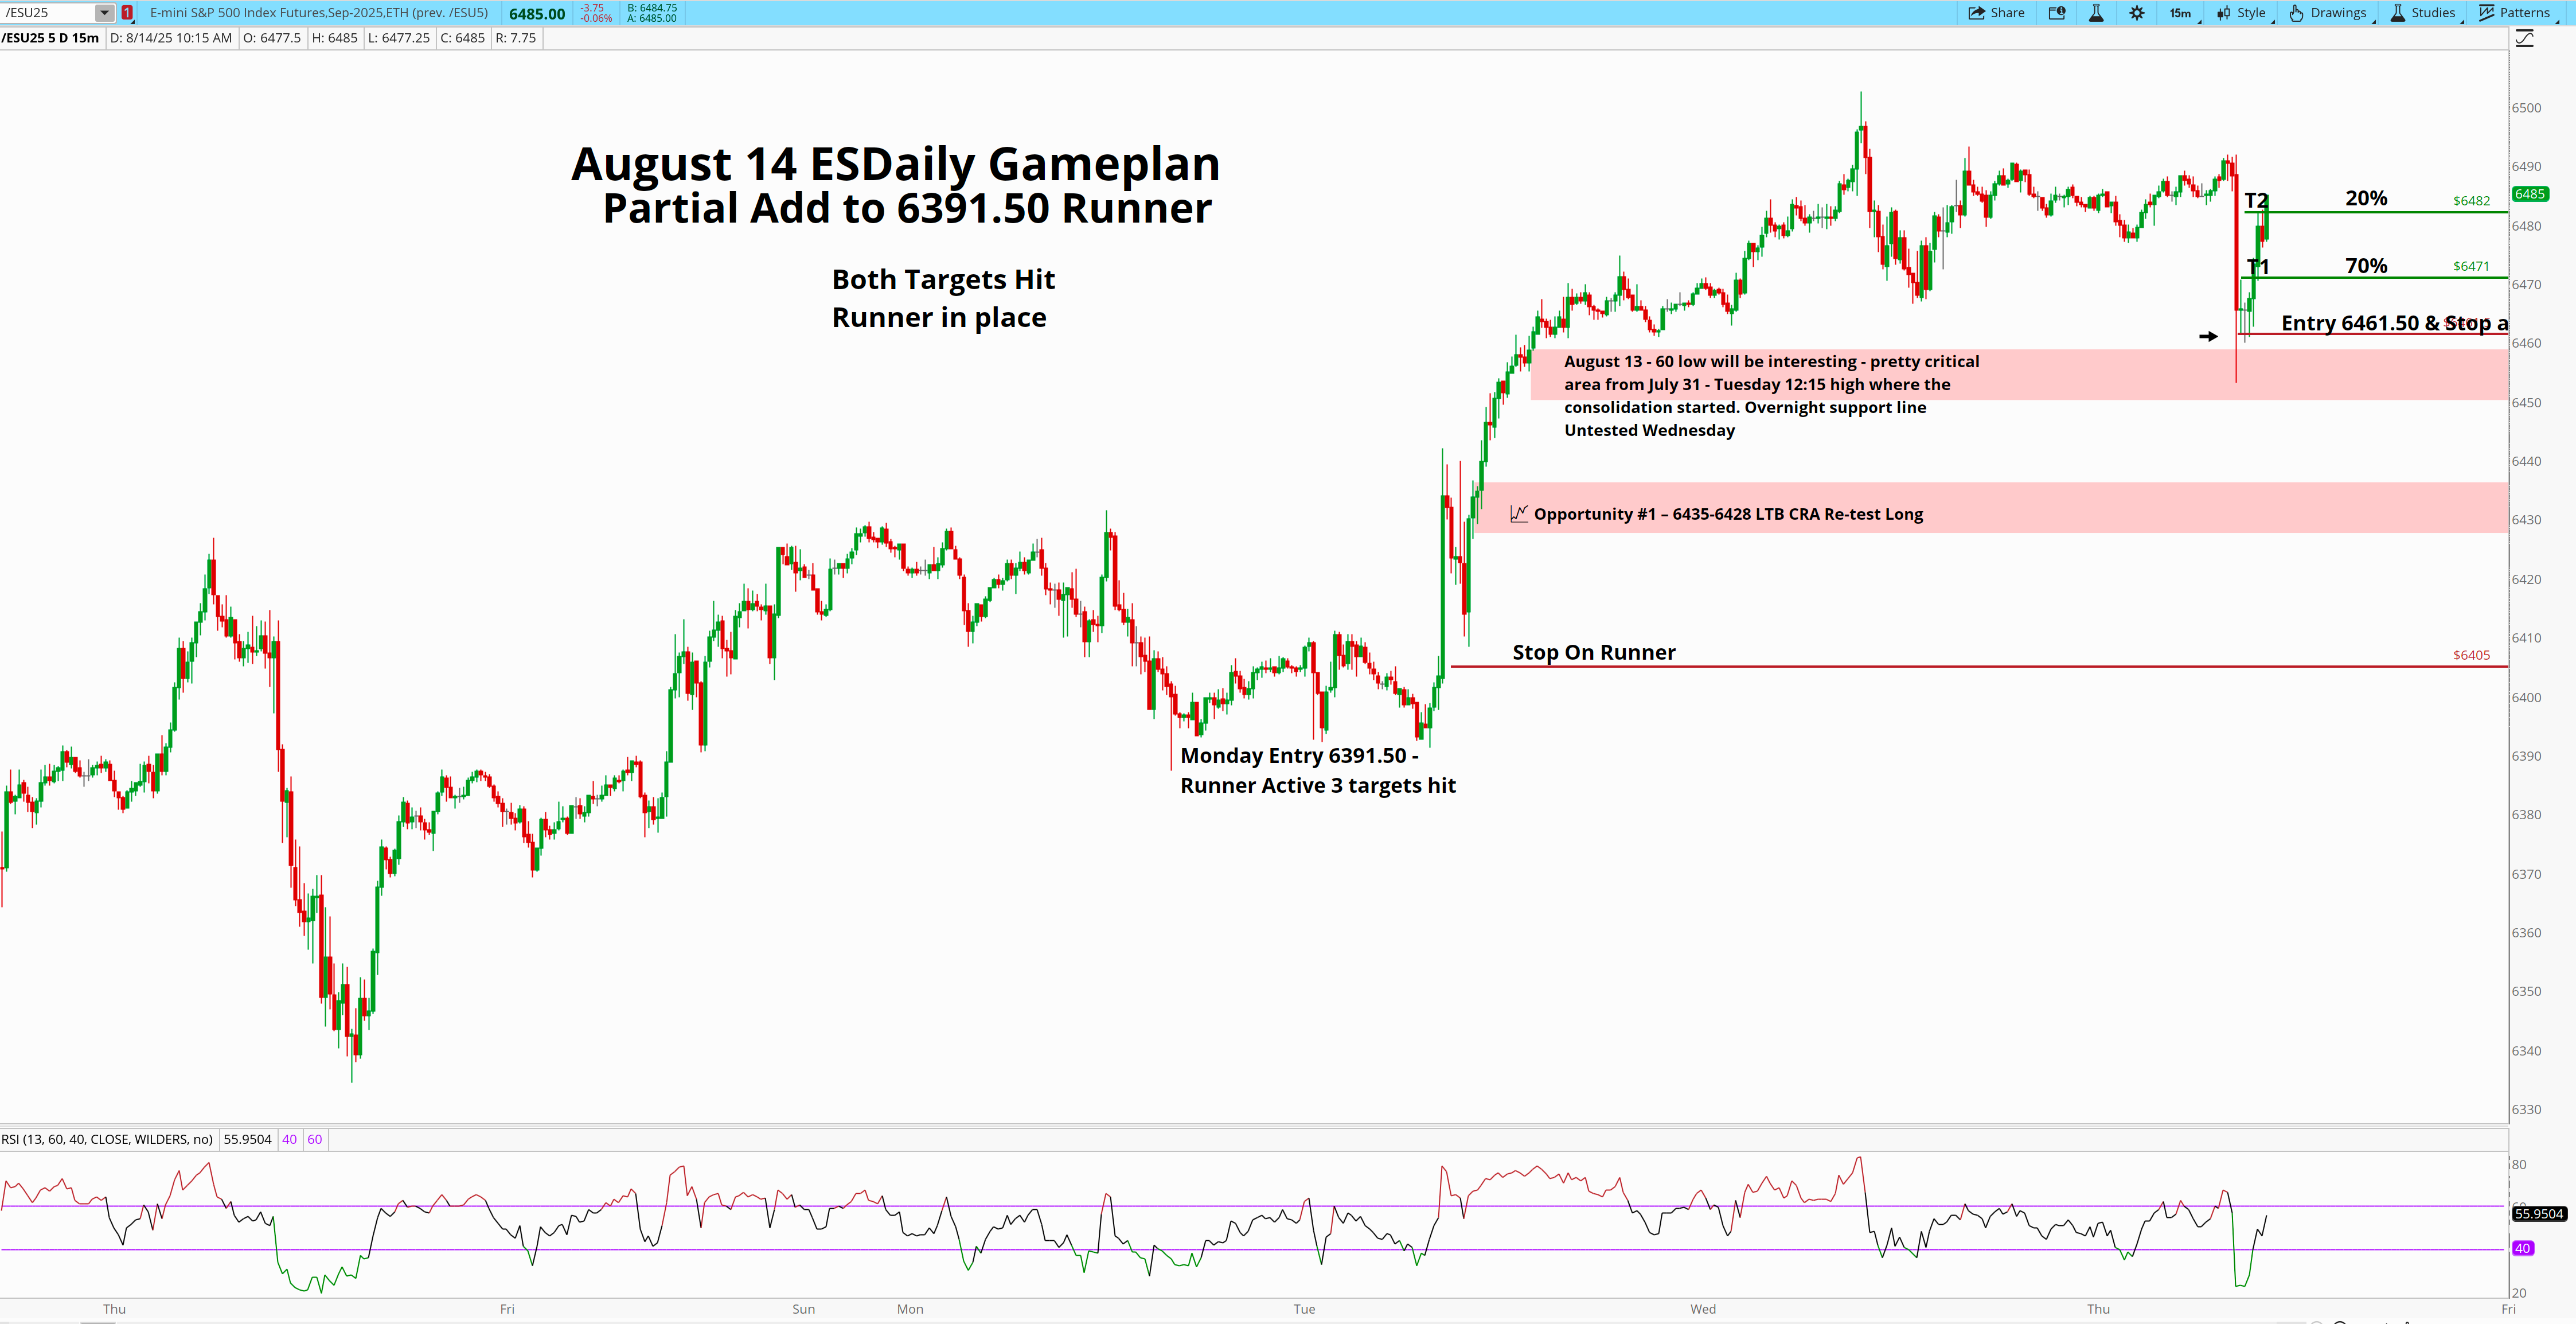
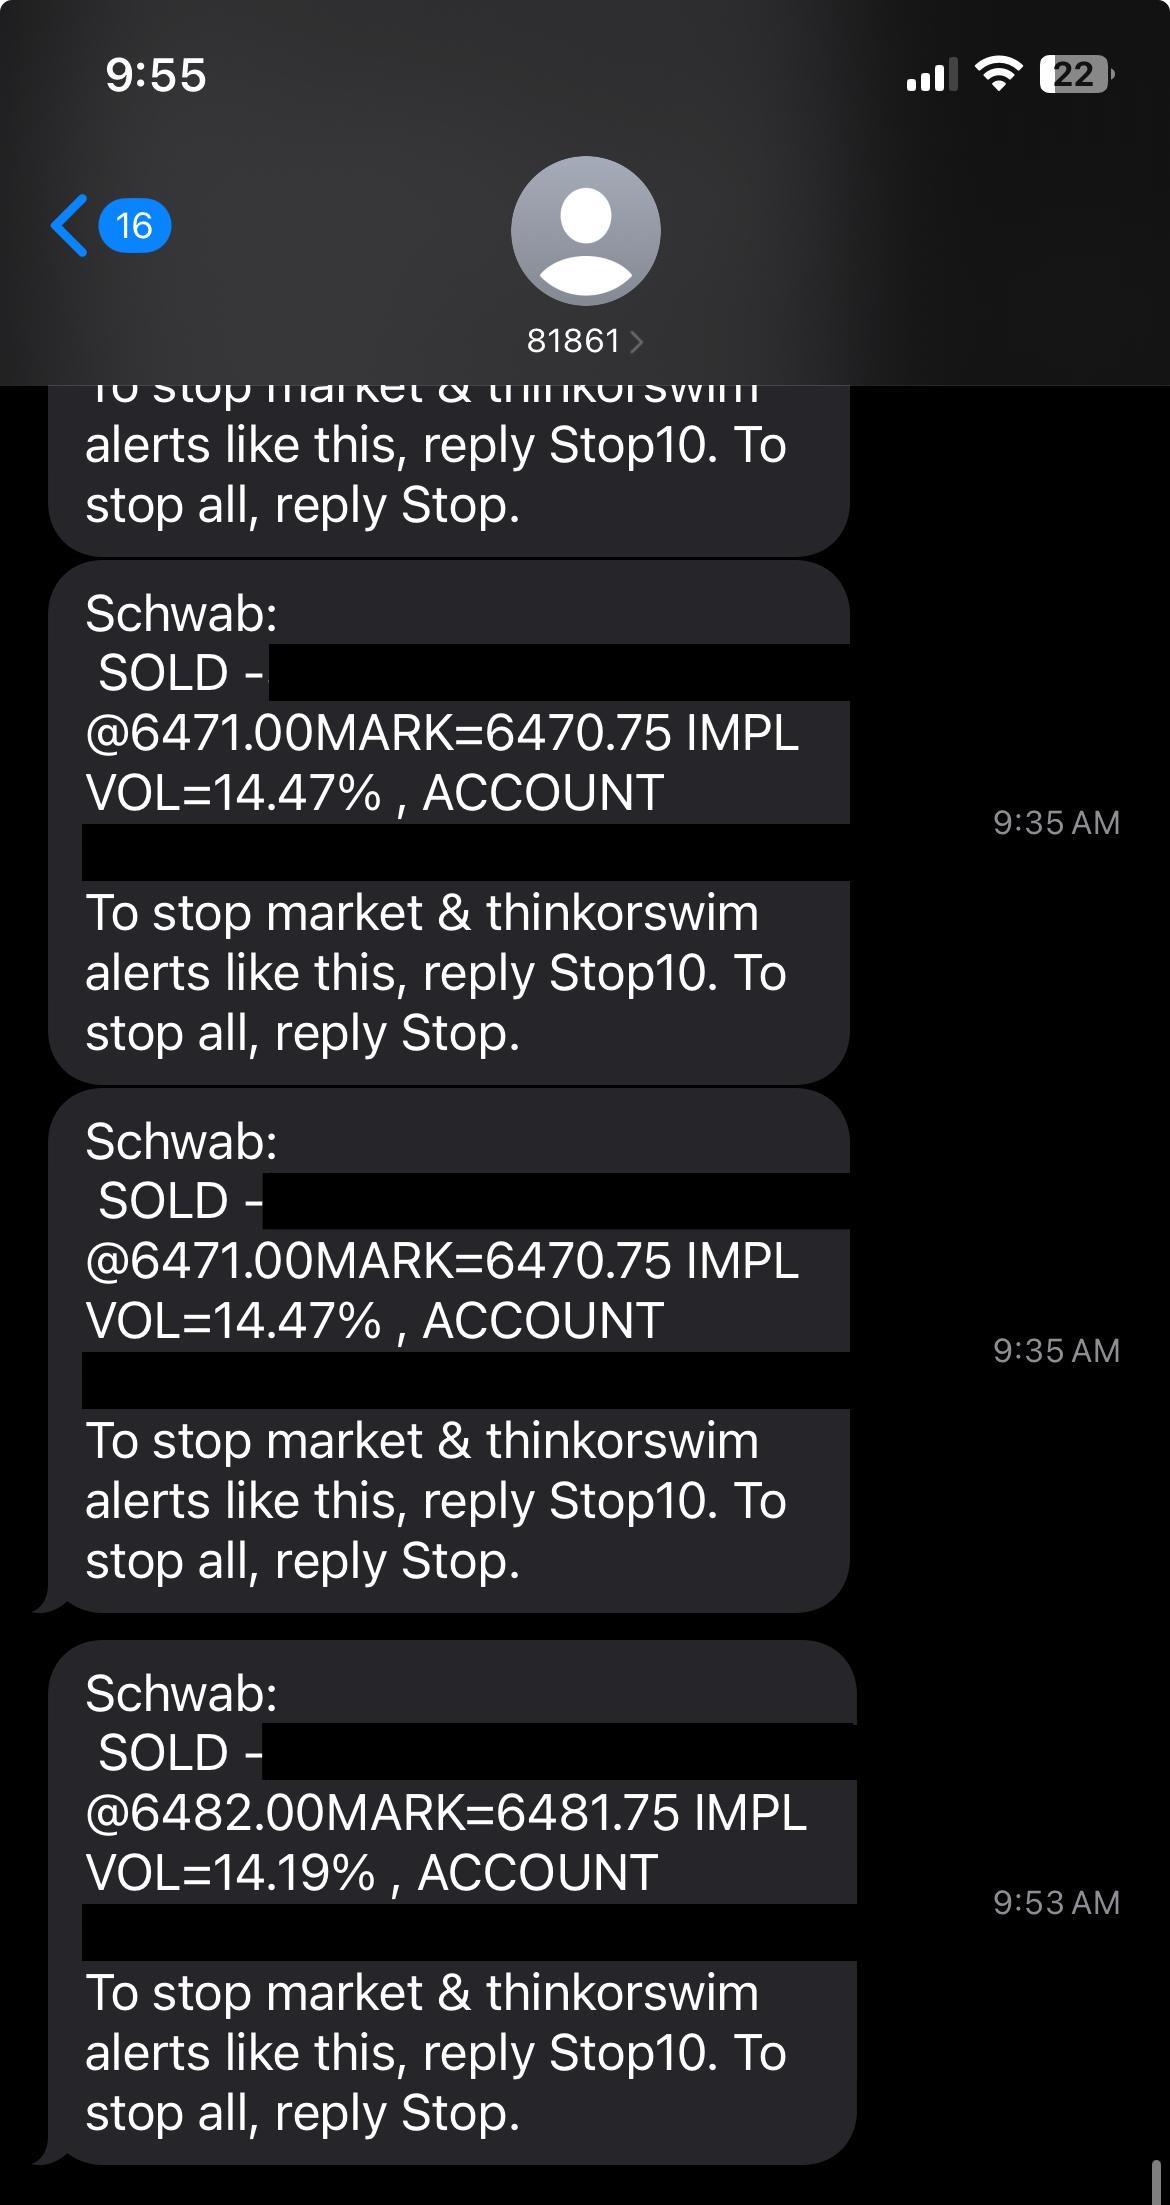
We now have two runners.
On August 14, I said we needed a catalyst. Yesterday, we got it — and when that liquidity event hit, we executed. Patience kept us boxed in with the market all week, waiting for that one high-quality shift. It finally came, and we were ready.
45 Min
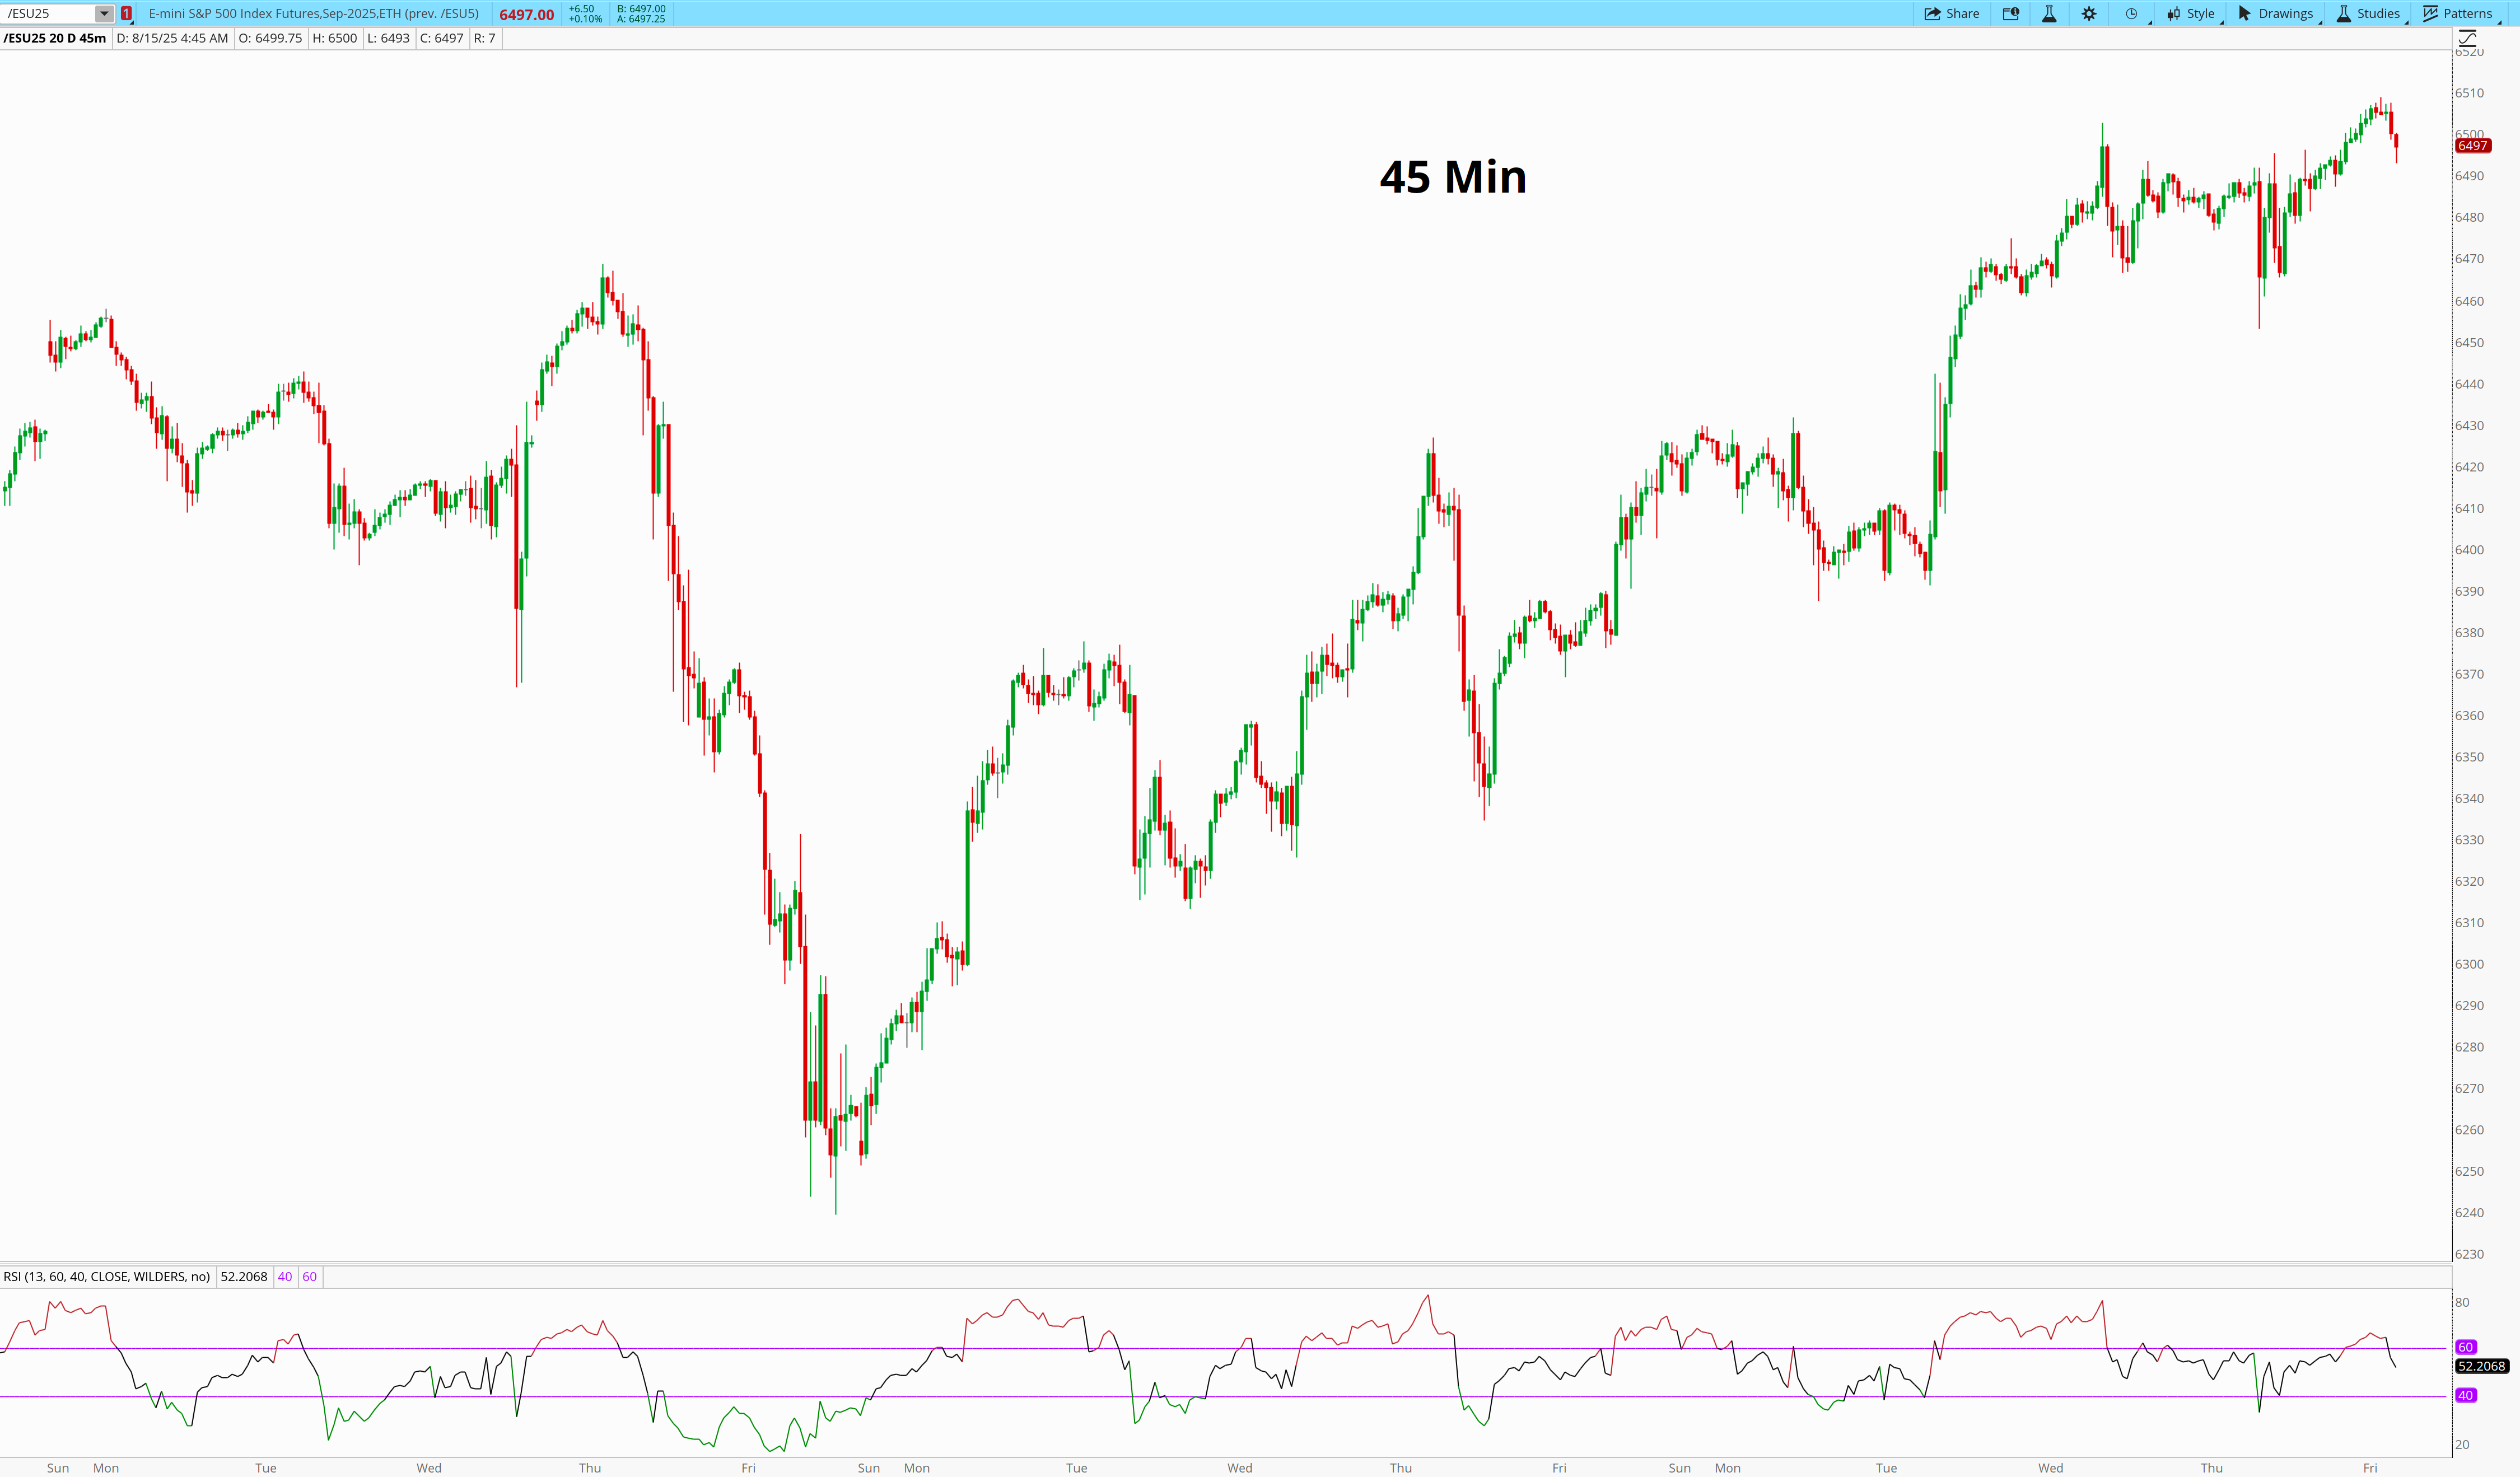
Since August 1, the 45m has printed a textbook stair-step rally: higher highs, controlled pullbacks, and well-respected reclaim zones.
That rhythm shifted slightly this week — from Tuesday forward, each push has stalled earlier, forming a mild descending structure around 6503.
Yesterday kept that pattern alive: an early lift to 6485, followed by a selloff to the bottom of the box at 6460 before buyers stepped in.
The defense there was decisive, rejecting any acceptance below and forcing a climb back toward mid-box.
Today’s chart adds definition to the immediate landscape.
New short-term support is forming at 6488–6486 and 6481 — levels that didn’t exist in Monday–Thursday’s structure. Above, the 6499–6503 band remains the ceiling.
Until we see a sustained close beyond either the 6460 floor or that upper band, the 45m bias stays neutral, with a lean toward continuation if buyers can press back through the descending high sequence.
15 Min
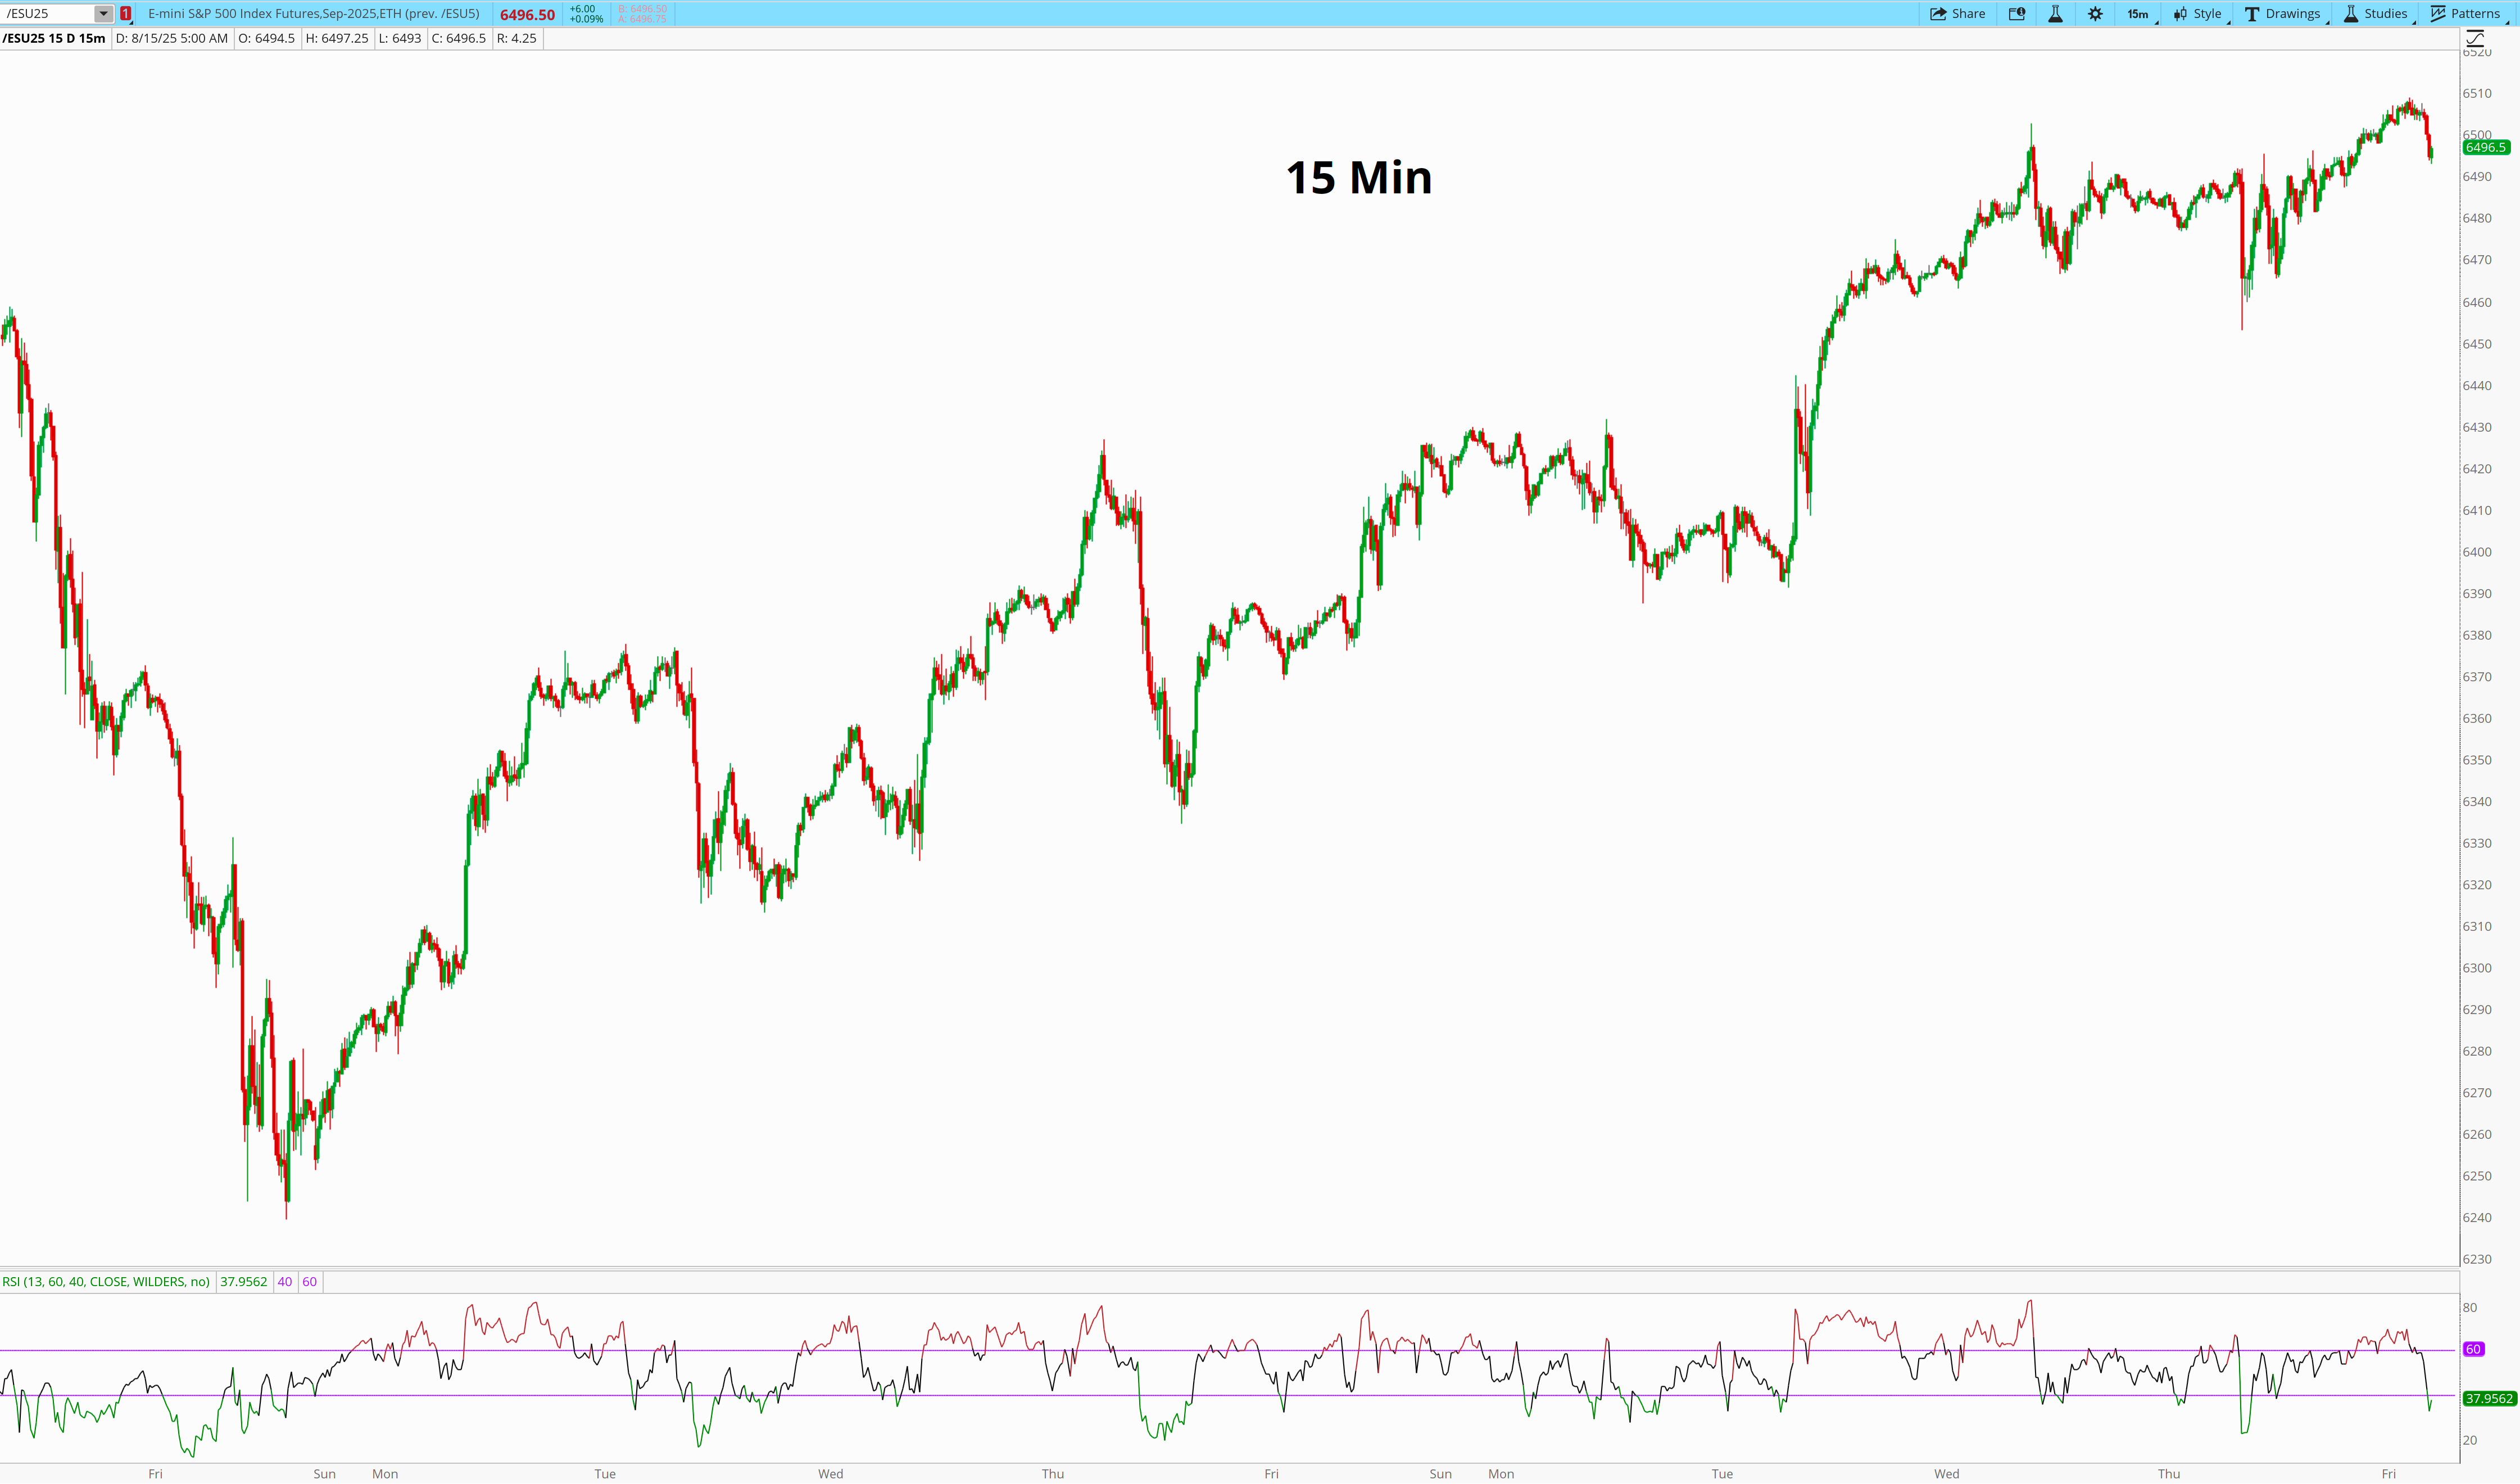
The 15m confirms 6460 as an LTB pivot — multiple clean rejections on the flush, then a controlled, steady climb into the close.
The reclaim off 6481 late in the session now creates a secondary pivot for intraday traders to key off. No strong RSI divergence at yesterday’s low, but RSI is cycling back up from midline, suggesting buyers still have momentum headroom if a breakout comes.
Price is boxed between 6460 and 6485 on this timeframe,
but with micro shelves now forming at 6488–6486 and 6481, the near-term fight will likely play out inside a tighter band.
Any break and hold beyond those edges, especially if supported by RSI pushing into 60+ territory on the 15m, would offer the first real directional conviction we’ve seen since Tuesday.
Here’s what I’m looking at Friday August 15 with ES printing 6495
Likely Supports for 8/15:
High priority: 6488–6486 , 6481, 6475, 6466 (CRA), 6460, 6428–6425 (CRA)
Medium priority: 6453 (intraday pivot), 6448–6445 (D), 6440 (CRA), 6435, 6421.25 (CRA), 6418, 6404 (CRA), 6391 (CRA)
Likely Resistances for 8/15:
High priority: 6499–6503 (CRA), 6507 (CA), 6511–6514 (CRA)
Medium priority: 6518 (minor reclaim), 6523–6525 (CRA), 6532 (CA), 6540 (CRA)
With price still range-bound, there’s no reason to force anything.
The laddered support we saw yesterday inside the box — 6481, 6460, 6453 — makes it tough to isolate high reward-to-risk areas without getting chopped up.
That’s why the focus remains on waiting for a clean break and acceptance beyond the edges, or a liquidity event that clears the clutter and gives us a defined trigger
I’m not interested in breakouts above as we have negative divergence on multiple time frames, and I’d rather let that play out than chase into resistance.
Beneath current price and inside the 91-61 range is chop and while there’s areas of support there I have little interest trading 1st and 2nd level pullbacks.
The runners I have can’t fight that fight.
I will wait for a reason to add — that comes with liquidity events — not a desire to catch every 20 pt move ES makes.
📈 Opportunity #1 6453 FBD
A clean flush below yesterday’s low at 6453, followed by immediate rejection and a reclaim of that level after acceptance takes place, sets up the long side. I want to see it trade below, shake out weak hands, and spring back — not grind. RSI ideally pushes sub-30 on the flush, showing capitulation, before snapping back above the reclaim. The trigger is acceptance above 6444 back over 6453 with order flow confirming.
📈 Opportunity #2 – 6435-6428 LTB CRA Re-test Long
The area I’m interested in today if we see selling pressure is 6435–6428. This band includes the Tuesday RTH breakout level at 6421, which has now been tested multiple times as both resistance and support, and lines up with a CRA pivot from August 8–12. A pullback into this range, with price finding a low in the range would put me back in line with the prevailing trend. A failure of this that isn’t supported by 6421 would put the structure at risk. Approach matters — I don’t want a slow bleed into the zone. I want to see a quick hit, responsive buyers, and a clear reversal sequence. RSI on 45 min less than 40 would be problematic
The objective remains the same: protect capital, protect focus.
I’m not here to trade noise.
If there’s a valid catalyst — a flush into a high-probability level or a clean reclaim at a critical pivot — I’ll act.
If not, I’m content to let the market burn someone else.
Cheers,
PriceTrader
🧠***ESDaily - My Thinking - My Trade Rules***🧠
This is the backbone of consistency in trading. Repeating what’s outlined below:
day-after-day, rain or shine, noise or flow…
Every.
Single.
Day.
What’s outlined below helps strip away hesitation and eliminate decision fatigue. When the rules are clear, there’s no need to think—just execute.
I can’t say this loud enough:
*Take the majority of profits at T1.
If I could write it in blinking lights, I would.
It’s that important.
We do this for one simple reason—it keeps the win rate high.
-If T1 hits and we stop out after? We’re still profitable.
-If T1 and T2 hit? We move the stop to breakeven and let a runner work.
-If T1, T2, and T3 all hit? That’s a big win—and we’re still in if ES wants to push.
Just look at the Scoreboard. The results speak for themselves.
This system works because we take profits early and we’re surgical when it comes to managing risk.*We always leave a runner when permitted. The runner is the unlock.
It reduces FOMO.
It keeps us mentally level.
It frees us from trying to nail the top.
We take most off at T1, and we stay patient, ready to build back in as the tape develops.*Limit your trades.
Know when there’s opportunity—and when there’s not.
It’s hard to sit still. I get it. But learning to wait is a core skill in this business.
We don’t earn steady wages.
We get paid when we execute our setups, with discipline, in the right spots.*The market doesn’t hand out trophies for participation.
Too many traders stack early wins, only to give them back with one bad decision.
One overtrade.
One impulse long.
One “I’ll just try this” at the wrong time.
That’s how edges disappear—and capital evaporates.*Trading rewards patience, not action.
Sit on your hands until your spots come to you.
Let the setup build.
Let the tape reveal its hand.
If it’s not clean—skip it.*The job is not to trade all day.
The job is to extract high-quality risk from the market, and guard your capital like it’s your newborn baby.*Each session is a building block laid on top of the previous day.
Before we can trade well, we need to understand where price is, what structure has been created, and what new structure has evolved since the last session. This helps to identify where the next opportunities exist — which areas are critical — and which are not. That’s why I spend so much time on the trade recaps. I had slight heart palpitations pulling these from the daily letter😂, — Because they are that important. Just because we’ve moved them to a separate page, please make it a habit to review the trades. The winners and the losers. Patterns repeat. Structures evolve. If you know what to look for, it becomes fluid.Wait for the setup → Execute by the rules → Rinse and repeat.
The real work is in the prep.
🧠Why Does ESDaily Strategy Work?
You can see all the different types of trades we take here.
Are they all home runs? No.
Are they all perfect? Definitely not.
But our win rate stays high because we stick to our rules—tight risk, smart profit-taking. That’s what keeps us green.
If T1 hits and we stop out after? We’re still profitable.
If T1 and T2 hit? We move the stop to breakeven and let a runner work.
If T1, T2, and T3 all hit? That’s a big win—and we’re still in if ES wants to push.We always leave a runner. The runner is the unlock.
It reduces FOMO.
It keeps us mentally level.
It frees us from trying to nail the top.
Because we’re already in.We take most off at T1, and we stay patient, ready to build back in as the tape develops.
🧠That’s the key: we’re not chasing the whole pie—
just a clean slice.
We need to take a PIECE of the action, not get all of it.
…Remember, we may just be provided 1 or 2 great opportunities a day. We don’t need multiple.
If we nail it, cool.
If we miss it, cool.Our job is to identify opportunities before they happen, and then execute.
🔑🧾Key Level Codes -
Demand (D)- A high-quality institutional zone where aggressive buying significantly outweighs selling, often leading to strong upward moves that follow thru.
Supply (S) - A high-quality institutional zone where aggressive selling significantly outweighs buying, often leading to strong downward moves that follow thru.Critical Area (CA) - A key level where often support becomes resistance or vis versa
Critical Reclaim Area (CRA)- Not to be confused with CA, CRA is key level where, if reclaimed by bulls or bears, momentum shifts decisively in their favor, often confirming direction with stronger conviction.Level Track-Back (LTB) - A key level price may revisit before continuation
Failed Breakdown (FBD) - When price breaks below support but quickly reclaims it, trapping shorts and often fueling a move higher.
Failed Breakout Reversal (FBR) – When price breaks above resistance but quickly falls back below, trapping longs and often triggering a move lower.Channel Top (CT) - The upper boundary of recent price. Often acting as resistance.
Channel Bottom (CB) – The lower boundary of recent price. Often acting as support.Breakdown (BD) – When price falls below a key level with momentum and room to run, signaling potential continuation lower.
Breakout (BO) – When price pushes above a key level with momentum and room to run, signaling potential continuation higher.For added confluence, please refer to the Core Strategy and Odds Enhancers
🧠Wait for price to tell you where it’s headed — then react.
Do not forecast or assume.🧠Follow our rules, protect our capital, size risk accordingly, take profits when they’re due, and only take Grade A+ setups
We’ll have to wait and see what price delivers today.
As always, stick to the plan.
Note: Important Note: In 94% of trading sessions, ES moves less than 2%. Prices listed as support/resistance are reference points on the chart I am watching as likely bouncing/turning points for price within a 2% range of price at the time of writing. Not all supports and resistances are “engage-able”. Most are not. There’s a time to engage, and a time to watch. I do not buy/sell these. I’m tracking, taking profits, and using them as confluence to trade ideas.
This post will be updated once a day each morning to reflect new levels as ES evolves. The previous days opportunities and support/resistance areas will be left as reference.